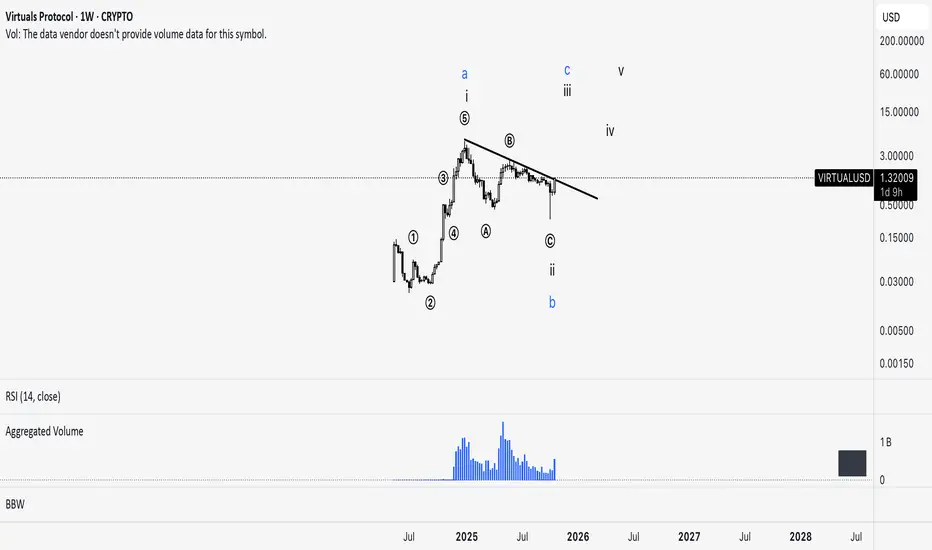
VIRTUALS – wave 3 in progress?VIRTUALS is currently trying to break through its downtrend line with increasing volume. The decline from January to October 2025 can be seen as an ABC zigzag forming wave 2 within a larger impulsive structure. Could this mean we’re just starting wave 3? The risk/reward ratio isn’t very favorable at the moment, but any pullbacks could be viewed as potential buying opportunities.
BTC-D
AITECH – parabolic advance soon?Trading doesn’t have to be difficult. Elliott Wave Theory provides clear, logical invalidation levels and targets. It also shows that the biggest and fastest profits usually come from wave 3 — especially from subwave 3 of wave 3. That’s the best possible setup. Is that exactly the situation we’re seeing on the AITECH chart? The risk is limited — stop loss at 0.018, with targets at 0.13, 0.26, and higher.

Bitcoin Technical Outlook (update)📉 Stage 1 – Bearish Reversal Zone
The red zone and areas below it signal a potential return to the downtrend.
Stage 2 – Launch Zone
The desicion zone between 111,300 to 111,500 could trigger a sharp breakout move.
📈 Stage 3 – Bullish Extension
If price breaks through the 115,000 to 117,000 range, there’s a high probability of reaching 121,000 to 122,000.

Wulf exhausted?NASDAQ:WULF appears exhausted at the upper channel boundary and I have exited completely for now. The Elliot wave pattern completes a leading diagonal which hints at higher to go after a wave 2 pullback which could end at the 0.382 Fibonacci retracement but more a likely target is the 0.5 Fib at $5.84 also the weekly 200EMA.
Breaking out above the channel would change the count and structure and be very bullish. RSI has been overbought for a while. For now we watch and wait.
Safe trading

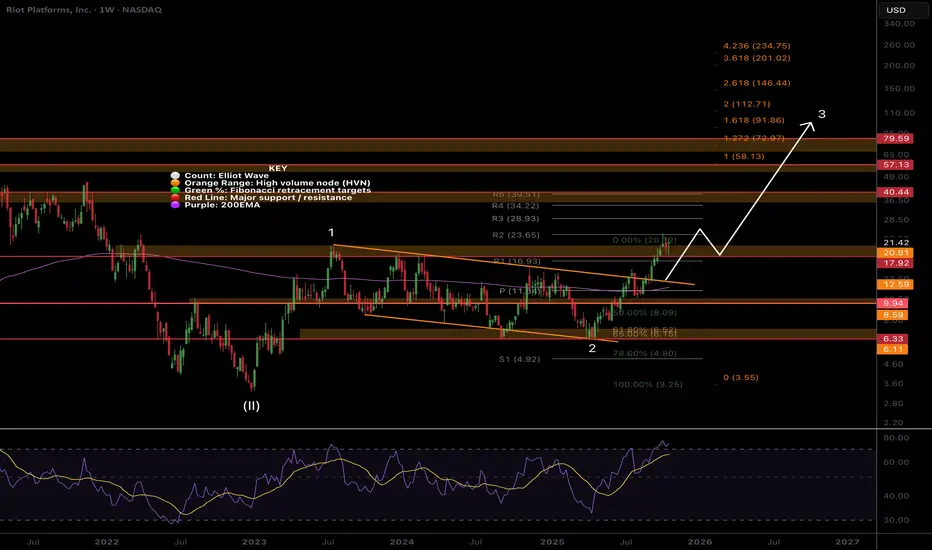
RIOT upwards momentum well in tactNASDAQ:RIOT Price remains in momentum breaking out of the channel in a wave 3 with a minimum target of the 1.618 Fibonacci extension at $91, a 4x from here.
Wav 2 completed at triple support- Fibonacci golden pocket, High Volume Node and channel boundary before quickly overcoming the weekly pivot and 200EMA. Breaking out above wave 1 is a show of strength,
Price should stall at the High Volume Nodes as supply comes in, $21, $40 and $57 but ultimately they should be overcome.
Weekly RSI is overbought where it can stay for months as price extends.
Higher Bitcoin = Higher targets
Safe trading
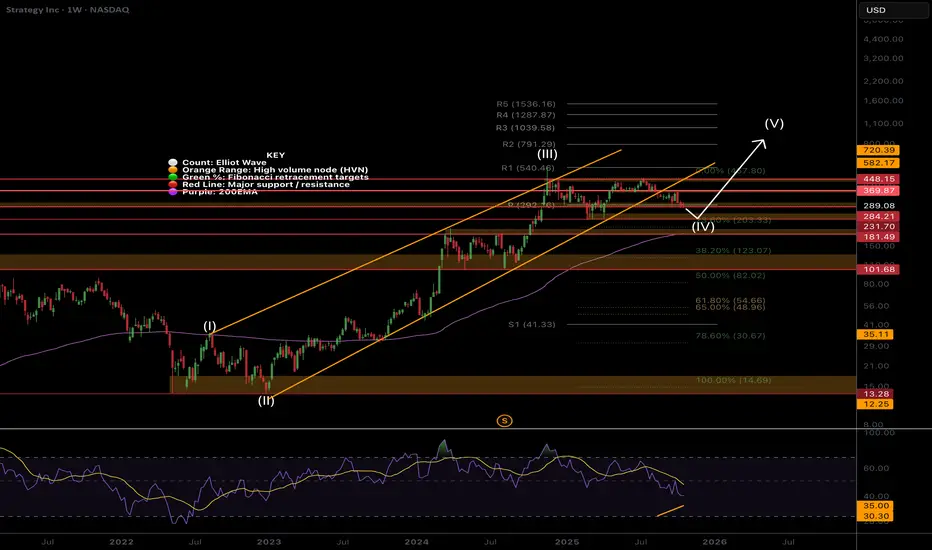
MSTR still in wave 4 rangeNASDAQ:MSTR Price is still in a wave (IV) which are expected to be long and drawn out, yet shallow which is what we have here. I don’t expect wave (V) to kick in until Bitcoin moves. Wave (V) has an expected of the R3 daily pivot at $1039 but will overextend if Bitcoin does.
Price has fallen out of the lower channel boundary and sitting at the weekly pivot, still above the weekly 200EMA so the outlook us bullish. wave (4) may complete at the 0.236 Fibonacci retracement at $203. For now I am waiting to see what happens before entering but believe good opportunities are setting up.
Safe trading
BTC - Liquidity Dynamics leading to new HighsMarket Context
Bitcoin has shown a constructive reaction from the recent lows, printing a clean double bottom structure that suggests short-term demand entering the market. After a previous buy-side liquidity sweep and rejection, price has rebalanced and is now challenging a fair value gap (FVG) that previously served as resistance. This marks a key decision zone where the next directional move will unfold.
Fair Value Gaps & Structure
The FVG overhead has already acted as resistance, capping the first impulsive move from the lows. Should price retrace slightly to take out the remaining sell-side liquidity below the double bottom before re-engaging higher, it would confirm the area as a springboard for a bullish continuation. A clean reclaim and hold above the FVG zone would signal a shift in order flow favoring buyers.
Liquidity Dynamics
The current setup offers both sides of the market clear liquidity targets: sell-side liquidity resting under the double bottom and buy-side liquidity resting above the prior high. Smart money could engineer a sweep of the lower side first to accumulate before expansion, or alternatively, break directly through resistance to trigger a larger bullish leg.
Final Thoughts
The structure reflects a balanced but bullish-leaning scenario — a classic accumulation and breakout setup. A deeper retest to clear out lower liquidity would strengthen the foundation for continuation, while sustained strength above the FVG opens the door for a reaction toward new highs.
If this analysis aligned with your view, drop a like — do you think we clear the lows first, or head straight for a bullish breakout?

MARA Strong breakout incomingNASDAQ:MARA is stalling at the weekly pivot as expected but is above the 200EMA. Wave (II) appears complete at the 0.5 Fibonacci retracement with a swing below the lower boundary trend-line.
Wave 3 of (III) appears to be underway so I am looking for an aggressive breakout to the upside once we clear the current resistance. The R1 pivot is the first target at $30 where the last bit of major resistance before the stronger breakout should come in, the High Volume Node.
Wave (III) has a target of $83 at the next major High Volume Node resistance, just above the R5 pivot.
Analysis is invalidated if we fall below $10. RSI is at the EQ with plenty of room for upside
Safe trading

IREN Exhausted? PUllback time?IREN wave (3) ran incredibly and I am looking for a deeper pullback as people begin to take profit. I have closed my positions at a 10x and am waiting for re-entry. The weekly pivots have been ran, RSI is at max overbought but can remain here for months (as it has done).
Initial downside targets for wave (4) is the 0.236 Fib retracement at $39 followed by the 0.382, $26.43. Expect shorts to pile in adding to any downside momentum.
In the long term I believe we have much higher to go towards $100 in wave (5).
Safe trading

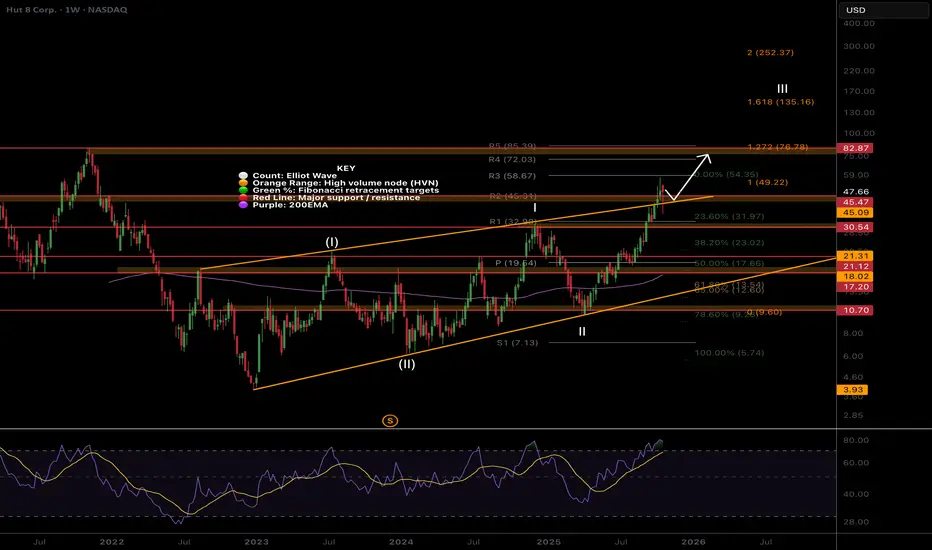
$HUT Breaking out, test of channel done and dusted!Hut has broken out of the channel upper boundary and a test of the boundary took place as expected, quickly catching a bid and recovering 17% Friday, producing a long signal for me.
The next target is the High Volume Node resistance at $82 just under the R5 weekly pivot. Fibonacci extension has a minimum target of the 1.618, $135.
The Elliot wave count suggests a very bullish move come in wave III of (III) which would overextend the 1.618 target above, $200+.
RSI is overbought but can remain here for months.
Safe trading
Coinbase Bottom in, new all time high coming?NASDAQ:COIN had a deep pullback after its recent bullish move but caught a large bid by the end of the week leaving a long lower wick. It appears the bottom is in but investors should be cautious as price is below resistance major resistance High Volume Node and R1 weekly pivot.
If the pullback is complete then we have a very shallow wave 2 within wave (II) and can expect much higher targets perhaps in the $1000s before the end of this business cycle. There will resistance at the upper boundary and R3 weekly pivot around $600 and a breakout above that area will signal we go higher.
RSI has plenty of room for months over overextension in price.
I will be looking to add a long so look out for the signal in my Trade Planning Substack.
Safe trading

BITCOIN → Trend support broken. Consolidation...BINANCE:BTCUSDT.P is consolidating below the previously broken uptrend line. There are no clear signs of the correction ending or the presence of a strong bullish player. A retest of resistance is forming...
Bitcoin is forming a trading range of 111650 - 107377 (106270). There is no clear bullish pattern at the moment, and we are seeing a correction to resistance before a possible decline to the liquidity pool of 106270, which is formed by consolidation and a retest phase. There are two key zones ahead: 111650 and 113600. Resistance at 111650 has been confirmed, but if this zone does not hold the price, it will be necessary to monitor the upper boundary. A false breakout could trigger a pullback. The cryptocurrency market currently looks somewhat weak due to the phase of uncertainty and doubts about policy.
Resistance levels: 111650, 113600
Support levels: 108650, 107375, 106270
Market behavior indicates that a consolidation phase is currently developing within the local downtrend. A breakout of 113K and consolidation above 113500 could confirm a trend reversal, but there are no such signals at the moment. I consider a pullback to the zone of interest from resistance to be a priority.
Best regards, R. Linda!

CLSK, nothing changed, $40+ incoming, 2x minNASDAQ:CLSK is low cap asset and is prone to large volatile swing like we are seeing but also gives way to opportunities.
Price is attempting to breakout the macro triangle upper boundary was rejected at first. Breaking above wave D at $24 is key to trigger the thrust I'm looking for towards $42 and $80 all time High Volume Node after that.
Price has momentum above the weekly pivot 200EMA but currently trapped in a High Volume Node where we expect price to stall before continuing upwards.
RSI can stay in overbought for months.
Participants are still afraid of this asset coming against them and its volatility, a reflection of the broader sentiment of FEAR in retail that is still persisting at all time high. Ridiculous bear market PTSD.
A recipe for MUCH higher. until market wide confidence takes hold.
Safe trading

TradeCityPro | Bitcoin Daily Analysis #206👋 Welcome to TradeCity Pro!
Let’s move on to Bitcoin’s analysis, the market is still moving upward, so let’s review it together.
⏳ 1-Hour Timeframe
Yesterday, Bitcoin formed a resistance zone around 111463, which it touched once, and on the next attempt, it managed to break through this level.
⭐ In this bullish leg that started after the fake-out of 107486, the RSI is strongly supporting the trend and is now close to the Overbought area.
✔️ However, volume is still very low and doesn’t confirm the trend, which isn’t ideal. Since today is Saturday, overall market volume is weak, and there’s a high chance that with the start of the new weekly candle, this entire upward move could turn out to be a fake-out in the next couple of days.
✨ Still, I believe it’s worth the risk to keep the positions open that were entered at 108943 and 111463, because if the 113429 level breaks, price could start a very strong bullish move.
💥 If this upward move turns out to be fake and price stabilizes below 111463, we can consider that as a temporary bearish confirmation — in that case, price could again drop back down toward the 107486 level
📝 Final Thoughts
Stay calm, trade wisely, and let's capture the market's best opportunities!
This analysis reflects our opinions and is not financial advice.
Share your thoughts in the comments, and don’t forget to share this analysis with your friends! ❤️

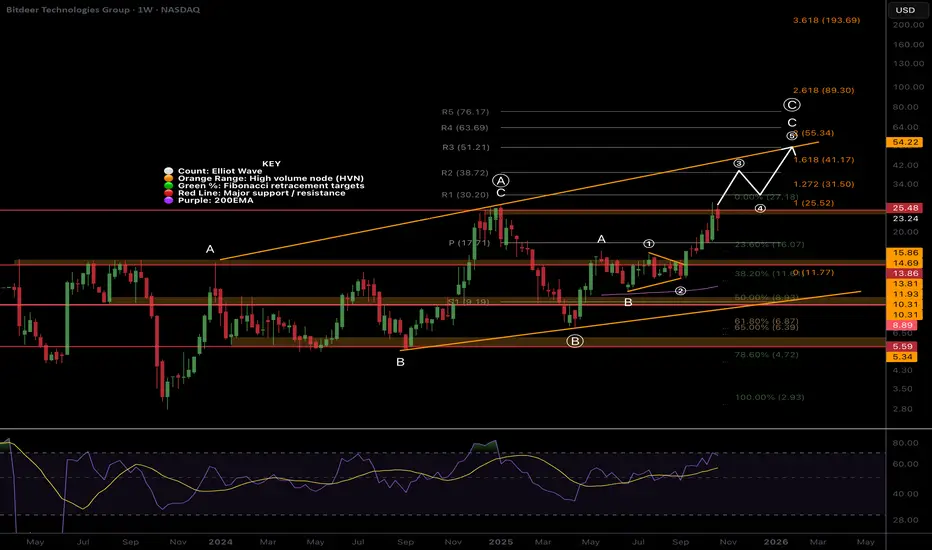
Bitdeer BTDR Macro Outlook. Nothing changed, Min 2x to come $54NASDAQ:BTDR is a low-cap volatile asset so traders and investors should expect wild pullbacks like we are seeing and is feature of these type of assets and is why we can make so much money from them when using the right strategy.
The macro structure is bullish in an Elliot wave ABC as there are many series of 3 wave structures.
Wave (3) of C of (C) is underway with a minimum target of the 1.618 Fibonacci extension $41.17 but price can significantly overextend in these assets.
Terminal target is the channel upper boundary and R3 weekly pivot at $55. A break out above this would be very bullish and could see prices as high as $80+
RSI has months left of upside. Analysis is only invalidated below the 200EMA.
Safe trading
$DOG on Bitcoin A distinct double bottom formation has formed on the chart following the recent decline.
The price reacted strongly to the major support area, and the outlook now indicates upside potential.
Roadmap: Breakout of the neckline.
If it persists above this level, the trend direction should be reassessed.

PIPPIN/USDT — Early Signs of a New Hype Cycle?Looking at the data and historical structure, PIPPIN is showing similar early movement patterns that preceded its last explosive rally.
The current trend shows renewed volume inflow, a base breakout, and a potential start of a new accumulation-to-expansion phase.
If this pattern continues, the structure suggests that a new hype wave could be forming — just like the previous major move that sent it skyrocketing.
📊 Key Observations:
Historical accumulation followed by vertical expansion
Volume returning at local bottom
Early breakout momentum forming
Could this be the start of another hype run?
What do you think — is PIPPIN entering its next cycle? 🔥

Bitcoin is now positioned below its main resistance! | Day 10👋🏻 Hey everyone! Hope you’re doing great! Welcome to SatoshiFrame channel.
✨ Today we’re diving into the 1-Hour Bitcoin analysis. Stay tuned and follow along!
👀 Bitcoin has still not succeeded in breaking the resistance zone at $111,458. However, Bitcoin formed a higher low compared to its previous low, which increases the probability of breaking this resistance and gives it a higher win rate for a breakout.
🧮 Pay attention to the RSI oscillator. The 70 zone has maintained its overlap with Bitcoin just like yesterday, with the difference that the RSI support zone is now in the 45 range, which also overlaps with the newly formed higher low.
💰 Bitcoin’s volume in the 1-hour time frame has increased after forming a higher low, meaning this low is being respected by buyers, and the desire to break multi-timeframe resistances has increased. Breaking the current resistance zone requires strong buying volume so that sell orders are filled and some futures orders get liquidated.
✍️ The expected scenario for Bitcoin does not differ significantly from yesterday’s scenario.
🟢 Long Position Scenario
Break the key resistance at $111,458, surpass the 70 level on RSI and enter overbuy territory, accompanied by increased buying volume and a price squeeze.
❤️ Disclaimer : This analysis is purely based on my personal opinion and I only trade if the stated triggers are activated .

The Clearance Theory Dear Followers
As an analyst I always watch the market and take a notes
I would like to share one of my theorys today
I did notice this pattern did happen before throw the last few years
I call it the The clearance
it did happen before when the market was about to move strongly toward a new direction
and for making sure it will face a weak resistance the market will try to fulfill most of the pending orders before his final move
it takes the pending orders and dumb it till all the major orders fulfilled, Then >>>>>>>>
Good luck everyone

Bitcoin playing games at critical levelsBTC is clearly causing the market to capitulate over time. Price capitulation has already been achieved for the most part. The current sideways chop causes many traders to lose focus and exhaust their patience. This is what the market wants. There are some good signs of support at the current H1 structure, but let your guard down, this PA is CRAZY.

The Market Doesn’t Hate You — It’s Just Doing Its JobEvery trader at some point feels attacked by the market.
You take a trade, it hits your stop loss by one pip… and then runs perfectly in your direction.
You think, “The market is against me.”
But the truth is — the market doesn’t hate you.
It’s simply doing its job: collecting liquidity before moving to its real destination.
💡 Here’s What’s Really Happening
The market is a liquidity machine.
It moves where money is resting — not where traders wish it would go.
When you see price sweeping highs or lows before reversing, that’s not manipulation against you —
it’s Smart Money doing what it’s built to do:
Hunt liquidity
Fill institutional orders
Create displacement before the next move
Your stop loss isn’t being targeted personally —
it’s sitting where millions of other traders’ stops are clustered.
The market simply clears those levels before delivering the real move.
🧠 The Lesson
Stop trading emotionally and start thinking structurally.
Ask yourself before every setup:
Where is liquidity resting?
Has the market collected it yet?
Is structure confirming the new direction?
When you learn to think like Smart Money, you stop blaming the market and start understanding it.
You’ll realize every loss was a lesson pointing you toward better timing, discipline, and patience.
📊 Final Thought
The market is not your enemy — it’s your teacher.
Once you align with how liquidity and structure truly work,
you’ll stop feeling trapped and start trading with clarity and confidence.
💬 Follow for more institutional-based educational posts.
No signals. No hype.
Just pure trading knowledge and Smart Money insights that help you grow.

CLANKER/USDT — Volume Zone Reclaim Could Ignite Major Reversal CLANKER/USDT — Volume Zone Reclaim Could Ignite Major Reversal Momentum 🔥
CLANKER has successfully rebounded from the $33.9 support zone, entering the key volume zone between $34–$70, which has historically acted as a strong liquidity region. The recent +59% move in volume indicates renewed market interest and early signs of accumulation.
If price continues to hold within this volume zone and confirms a breakout above $40, it could signal the start of a mid-term reversal, with potential upside targets toward $69.8.
📊 Technical Overview:
Support: $33.9
Volume Zone: $34 – $69.8
Breakout Confirmation: Above $40
Bias: Accumulation → Bullish once $40+ holds
The strong recovery candle shows buyers returning aggressively, suggesting that CLANKER could be gearing for a trend shift if momentum sustains above the zone midpoint.
📈 Outlook: Volume-driven reversal zone
🎯 Targets: $40 → $69.8

Don't sleep on Ethereum!Ethereum is following the pattern seen before the 2021 bull run of Bitcoin, and we are now in the final stages before the parabolic run for Ethereum.
CRYPTOCAP:BTC 2017\2021 vs. CRYPTOCAP:ETH 2021\2025
