$BTC, $77.5K Target Before Retracement/Bull Run, LONG HoldBitcoin has the potential to drop as much as up to $77.5K as shown by the PnL and patterns setup. That said, holding and getting the dip or doing a short bet depends on your risk tolerance. As currently, I am very bullish on Bitcoin's long-term setup ignoring the in-between noise. As always, none of this is investment or financial advice. Please do your own due diligence and research.
BTC-D

BTC/USDT — Weekly Outlook✔️ The monthly candle closed bearish with a lower wick. RSI has dropped into deep-correction territory (5 more points — and it hits the COVID-crash level). The structure increasingly resembles 2021.
✔️ Bitcoin recovered 4% during the week — but already lost 5% this morning.
🟢 QT officially ended today after 3.5 years . During this period, the Fed’s balance sheet shrank from $9T to $6.6T.
🟢 Positive cumulative delta: +$640M
🟠 Deviation below the channel has been closed — technically opening the path downward.
🟠 ETF flows: green on the week, red on the month.
🟠 Fear index moved from extreme fear back to regular fear — likely not for long.
🔴 Nearly the entire bounce has been retraced. A reversal is possible only after a clear reversal pattern forms. One step back before two steps forward.
🔴 The shortest bear phase in history lasted 1.5 months — that’s the most optimistic benchmark.
🧠 If the scenario plays out, we may see one more drop and a strong buyback within the next month.
A sweep below 80k is possible.
I expect a reversal starting from early January — holiday periods make market manipulation even easier.

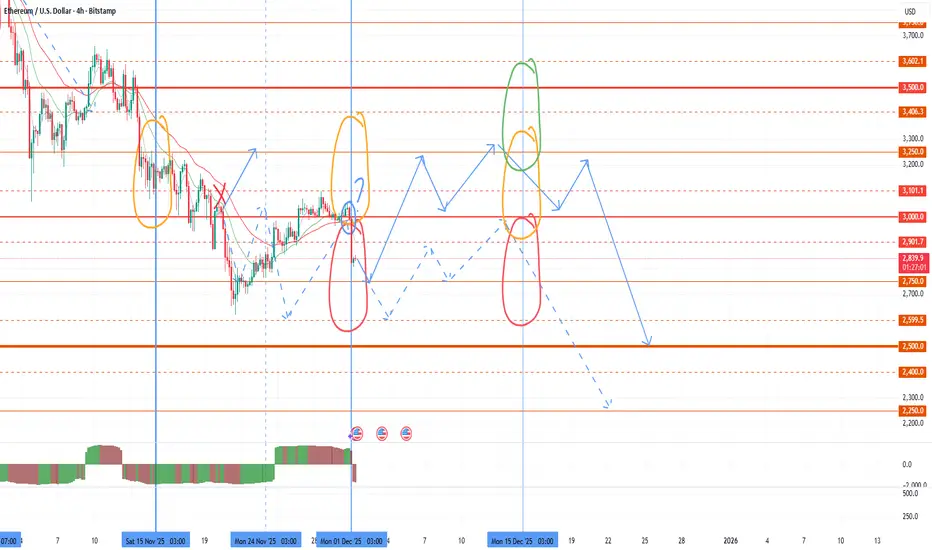
Ethereum (ETH) Rejected from $3K — Key Support AheadETH recently got rejected at the critical $3,000 resistance, a psychological and technical level that’s held firm amidst broader market volatility. However, bulls shouldn’t panic just yet — Ethereum is now approaching a major support zone between $2,640 and $2,770, where it has previously found strong buying interest. If macro conditions stabilize, momentum could return quickly from this level.
💡 Trade Setup
Entry Zone: $2,640 – $2,770
Take Profit Targets: $3,370 and $4,000
Stop Loss: $2,187
This setup offers a strong risk-reward profile, especially if ETH rebounds as it has done historically from this zone. Watch for volume confirmation and potential bullish divergences on lower timeframes to time entries.

Bitcoin: Final Pump Before the Fall?Over the past five to six days, Bitcoin ( BINANCE:BTCUSDT ) has been attempting to recover from previous weekly declines, and it still appears to be in a corrective phase. This analysis builds on my previous idea, and if you’d like a deeper look at Bitcoin’s mid-term chart, you can check out the 4-hour timeframe in that previous analysis .
Now, a key point for Bitcoin traders is that, despite the recent rally in the S&P 500 ( SP:SPX ) over the past few days, Bitcoin hasn’t been able to keep pace. While it had a good correlation with the S&P 500 in the past, it didn’t experience a similar upward movement this time. Therefore, once the S&P 500 corrects, we may also see Bitcoin resume its downward trend.
Currently, Bitcoin seems to be near a resistance zone($92,200-$88,400) and Cumulative Short Liquidation Leverage($91,570-$89,660). It also appears to be forming an ascending channel over the past few days, indicating a corrective structure.
From an Elliott Wave perspective, Bitcoin seems to be completing microwave C of the microwave Y of the main wave 4, and we can expect this corrective phase to end soon, leading to another downward move. A break of the lower line of the ascending channel would confirm the end of this Wave 4.
I expect that after the Cumulative Short Liquidation Leverage($91,570-$89,660), Bitcoin will resume its decline and move towards the Support zone($86,200-$85,130).
Cumulative Long Liquidation Leverage: $86,000-$85,000
Cumulative Long Liquidation Leverage: $83,249-$81,840
Cumulative Long Liquidation Leverage: $80,263-$78,131
First Target: $86,290
Second Target: $83,800
Stop Loss(SL): $92,229
Points may shift as the market evolves
Note: At lower price levels, Bitcoin’s price includes several Cumulative Short Liquidation Leverages, each potentially causing further price drops. However, if the S&P 500 starts another correction, these levels may break more easily.
Note: Overall, trading in crypto has become a bit challenging lately, with less volatility, so it’s wise to be cautious and manage your capital carefully.
Note: If Bitcoin breaks through the resistance zone($92,200-$88,400) around $92,229, we can expect a renewed upward trend and hope for a bullish movement.
💡 Please respect each other's opinions and express agreement or disagreement politely.
📌Bitcoin Analysis (BTCUSDT), 1-hour time frame.
🛑 Always set a Stop Loss(SL) for every position you open.
✅ This is just my idea; I’d love to see your thoughts too!
🔥 If you find it helpful, please BOOST this post and share it with your friends.

BTC Weekly Update📊 BTC Weekly Update
Right now, BTC is testing an important support zone in blue 🔵.
If this support breaks down,
the next major support zone is around $65,000.
However, BTC could first stabilize near $71,000 before moving lower.
At the moment, BTC is more bearish than bullish —
there are no strong bullish signs on the higher timeframes.
As you already know:
when BTC drops, many altcoins dump even harder,
so if you're only holding, be careful.
But remember —
you can still make money in a shorting market.
As long as BTC does not break above $97,000,
I remain more bearish for now.

BITCOIN | Bearish Continuation Below 87,240Bitcoin – Technical Outlook
Bitcoin, the world’s largest cryptocurrency by market capitalization, extended its decline on Monday as broader risk-off sentiment weighed on the market at the start of December.
BTC dropped sharply to an intraday low of $85,595, marking its fourth consecutive day of losses since November 27. It was last seen trading near $85,842, down 5.88% over the past 24 hours.
Technical Analysis
Bitcoin continues to show strong bearish momentum, with the broader structure favoring continuation toward 76,680 and 72,600.
A sustained break below this zone would expose deeper downside targets toward 66,400.
The market has been in a clear downtrend from 87,240, with bearish pressure intact as long as price trades below this pivot level.
A recovery requires a decisive move back above resistance zones, but the current trend strongly favors sellers.
Pivot Line: 87,240
Support: 76,680 · 72,600 · 66,400
Resistance: 95,440 · 100,800
Understanding BTC, Bitcoin Dominance and TOTAL3 Rotations✅Bitcoin Dominance, BTC, Altcoins✅
Today, We're talking about the rotation of cash between Bitcoin and altcoins.
Imagine a pie where each slice represents a different cryptocurrency. The pie here indicates the total cryptocurrency market cap of both Bitcoin and altcoins, which can increase or decrease at any given time. In other words the TOTAL chart.
- If BTC market cap increases but altcoin market cap shrinks (relative), the pie stays the same size.
- If BTC market cap increase and altcoin market cap increases, the pie size increase and so forth.
Total Market Cap and BTC.D
At most of the key moments, we see a clear inverse relationship here. Alts drop harder than BTC, as this clearly shows. But during the cycle, investors hop on and off, injecting money into the ride (buying) and taking it out (selling). This constant movement is what keeps the crypto markets going.
Let's break it down with visuals:
Chart 1: Bitcoin
This rollercoaster represents Bitcoin's price action, and also my view on where we are in the current cycle. (I believe we're in a multimonth correction, followed by the last impulse wave up probably close to XMAS 2025 as usual). You'll need this to know where we are in the cycle right now:
Chart 2: Bitcoin & Bitcoin Dominance
This chart shows Bitcoin's dominance, which is basically its share of the total crypto market capitalization (market cap = total value of all cryptocurrencies). When Bitcoin's dominance goes up (higher on the chart), it means investors are putting more money into Bitcoin, potentially at the expense of altcoins. Conversely, when dominance goes down, it suggests capital is flowing towards altcoins. The difference is clear:
Chart 3: BTC.D vs TOTAL3
In this chart, we overlay the Total 3 Priceline (BLUE) on top of the Bitcoin Dominance chart. TOTAL3 shows us all alts except ETH.
The Bitcoin Rollercoaster and the S&P 500:
When Bitcoin surges (line goes up), it can sometimes lead to increased investor risk appetite. This might entice some investors to move funds from the S&P 500 into riskier assets like Bitcoin, potentially causing a slight dip in the S&P 500. Conversely, when Bitcoin experiences a price drop, investors might flock back to the perceived stability of the stock market, potentially causing a rise in the S&P 500.
So, is there a guaranteed CORRECTION? All the signs are proving this may be the case. By understanding the relationship between Bitcoin, altcoin prices and dominance, you can get a better sense of where the money merry-go-round might be headed.

Breaking:Bitcoin Might Test $50k Support Amidst Market SentimentBitcoin tanked 5% today from a high of $90k+ to the $80k zone albeit there is not any fundamental news tight to the market correction.
However Onchain metrics hints on Bitcoins possible voyage to the $50k support. as per data from crypto quant, the open interest of CRYPTOCAP:BTC on all exchanges is down 4% losing over $24B.
Similarly, the funding rates of CRYPTOCAP:BTC on all exchanges as per data from that same source is down 15% essentially connoting traders are losing interest on CRYPTOCAP:BTC hence they are selling it.
IS IT TIME TO SALE BITCOIN?

Welcome to BEAR SEASONAs the timeline clearly indicates, we've entered bear season. Good luck to everyone. I've opened my Short, lit a cigarette, and sipped my cappuccino, watching with pleasure as the stoves go out.

BITCOIN - PRESSURE BUILDING - SHORT SQUEEZE INCOMING?Traders,
Bitcoin might be preparing a short squeeze. Let’s walk through the flow, structure, math, and correlations step-by-step so you understand what is happening and why it matters.
1. What Happened
Bitcoin dumped from 96k → 80.6k last week. Price then bounced and is now trading around 87k.
Under the surface:
Stablecoin-Margined Futures (USDT-M)
Since 27 Oct:
OI increased from 225k → 280k contracts
That’s +55k contracts (~24% increase)
CVD went down, not up
Meaning:
These new positions were mostly shorts
The market added leveraged short exposure during the dump
Interpretation:
USDT-M traders attacked the move lower aggressively. Increasing OI + dropping CVD = new sellers dominating, not buyers.
Coin-Margined Futures (BTC-M)
Since 27 Oct:
OI and CVD both dropped from 7.41B → 5.90B
BTC-M is usually “higher conviction” demand
A drop in BTC-M CVD means
Longs closing
Capitulation
Reduced bullish positioning
Interpretation:
Native BTC longs stepped aside. Short-term leverage traders pressed the downside.
Spot + Futures CVD (27 Oct → 21 Nov)
Spot CVD ↓
Futures CVD ↓
Price ↓
All making lower lows and lower highs
This was a clean, correlated downtrend.
2. The First Major Shift: Spot CVD Divergence
Since 21 November:
Spot CVD:
Higher highs
Higher lows
Rising together with price
Indicates real demand stepping in
Stablecoin Futures (USDT-M):
Still making lower lows
Still pressing shorts
Still fighting the spot buyers
This is the key:
Spot = real money
Futures = leveraged speculation
Rising spot CVD vs falling futures CVD = absorption pattern
Meaning:
Strong hands buy
Weak shorts keep selling
Price rises anyway
The pressure builds
Shorts eventually run out
The squeeze begins
This is one of the cleanest pre-squeeze structures you can get.
3. The Math: Fibonacci Rotation Logic
Let’s break down the structure.
(A → B → C Structure)
A = 116k (27 Oct)
B = 98.710
C = 107.403 (retracement)
The retrace sits at 0.5.
The reciprocal extension is 2.0
The 2.0 extension lands exactly at the 21 Nov wick (~81k)
This is a perfect harmonic rotation.
(X → Z → A Extension)
X = 06 Oct high
Z = 18 Oct low
A = 27 Oct high
Fibonacci extension from X → Z → A:
1.618 extension = 80.544
It matches the 2.0 from the ABC structure
It matches the 0.886 retracement on the HTF
Three independent mathematical signals hitting the same level. This is extremely rare and confirms the 81k zone as a rotation completion.
4. Structure Break
Since the 10 Nov low:
4H is making higher highs & higher lows
The descending trendline from 11 Nov is broken
Trend shifted from controlled downtrend → early reversal
Structure now favors continuation upwards as long as higher lows hold
Interpretation:
Sellers who relied on the trendline no longer have control.
4.5 Intermarket Correlation: Why Bitcoin Dumped When ES Dumped
Another important factor:
Bitcoin dumped because ES dumped.
From 12 Nov → 21 Nov:
S&P500 (ES)
Dropped from 6900 → 6525
–5.43% correction
Bitcoin:
Dropped from 107k → 80.5k
–24.77% correction
BTC acted as a ~4.5× levered version of ES.
BTC acted as a ~4.5× levered version of ES.
Correlation Data:
Rolling BTC/ES correlation increased from 0.38 → 0.74
Meaning BTC traded almost in sync with equities during the selloff
Why?
Risk-Off Mechanics
When ES sells off:
Equity funds de-risk
Macro algos rotate out of high beta
Volatility spikes
Systematic funds reduce exposure
Crypto is treated as “high beta tech”
BTC amplifies the move by a factor of 3–5×
Bitcoin didn’t dump because crypto was weak — It dumped because macro markets were risk-off.
Why this matters now
ES has stabilized
BTC stopped following ES lower
Spot demand started rising
BTC/ES correlation is dropping again (from 0.78 → ~0.55)
USDT-M shorts didn’t adjust
This is exactly when short squeezes start on BTC:
Macro stabilizes
Crypto regains independence
Shorts remain positioned for risk-off
Spot buyers take control
Price accelerates upward
This is a classic intermarket correlation unwind.
5. USDT Dominance (USDT.D) Confirms Risk Rotation
USDT dominance has turned down, which means:
Traders are deploying capital
Less stablecoin sitting idle
More risk-on appetite
Historically aligns with BTC beginning new legs up after HTF rotations
When USDT.D falls at the same time spot CVD rises, the market is shifting capital into crypto.
6. Targets: 118.5k → 124k
These are the next liquidity magnets.
Target #1: 118.5k
Confluences with:
1.141 extension of the 11 Nov → 12 Nov move
First major liquidity pool
First real “decision point” for the market
Target #2: 124k
Confluences with:
A weak high that will be swept
1.618 extension of the same 11→12 Nov move
Natural squeeze exhaustion zone
Perfect location for a Swing Fail Pattern
Rotation Logic
Shallow retraces → larger extensions (1.618 → 2.0)
Deep retraces → smaller extensions (1.272 → 1.414)
BTC currently fits the shallow retrace profile → favors strong extension
7. Other Pivot Points
Marked on the chart:
Minor LVNs
Minor-imbalances
CME Gaps
Expect reaction at each point.
8. Invalidation & Bearish Pathway
My invalidation is clear:
Trading below 80k invalidates the squeeze setup.
Below 80k, the absorption breaks.
If 80k is lost, the downside extension levels become:
74k
70k
64k
These levels are:
The natural downside extension pathways from the 11 Nov → 21 Nov swing
They form the mirrored rotation of the bullish structure
Final View
We dumped because macro went risk-off
Bitcoin amplified the ES selloff
Shorts loaded heavily into the move
Spot buyers stepped in first
A clean absorption pattern formed
Mathematical rotation completed at ~81k
Structure flipped
Risk metrics like USDT.D turned down
Correlation with ES is now unwinding
If Bitcoin continues to hold above 80k and spot keeps leading, the squeeze toward 118.5k → 124k becomes the most likely path.
Abbreviation List
BTC – Bitcoin
ES – S&P500 E-Mini Futures
OI – Open Interest
CVD – Cumulative Volume Delta
USDT-M – Stablecoin-Margined Futures
BTC-M – Coin-Margined Futures
HTF – Higher Timeframe
LVN – Low Volume Node
AVWAP – Anchored Volume-Weighted Average Price
PRZ – Potential Reversal Zone
SFP – Swing Fail Pattern
Fib – Fibonacci
CTA – Commodity Trading Advisor (systematic trend-following funds)
VIX – Volatility Index
Beta – Sensitivity of an asset’s movement relative to a benchmark
Risk-Off – Market environment where investors reduce exposure to risky assets
Risk-On – Market environment where investors increase exposure to risky assets
-----
If you enjoy this type of deep, data-driven breakdown—spot vs futures, CVD flow, intermarket correlation, and rotation math—drop a like and leave a comment. It helps me see whether these higher-level analyses bring value, and it motivates me to keep sharing them for free.

TradeCityPro | Bitcoin Daily Analysis #237👋 Welcome to TradeCityPro!
Let’s move on to the Bitcoin analysis. The market experienced a strong drop yesterday, and with the start of a new week and a new month, a fresh trend is beginning to form.
⏳ 1-Hour Timeframe
Yesterday, we had a long trigger on Bitcoin at 91,089. After activation, the price moved upward toward 91,813.
🔔 The 91,813 level was our next long trigger, and breaking it could have pushed the price toward the main resistance at 93,555.
✔️ But that didn’t happen.
The price was rejected from 91,813, and gradually, selling pressure increased across the market.
📊 Once the price stabilized below 90,421 — which was our short trigger — the main bearish move began. Bitcoin dropped sharply with a large bearish candle all the way down to 85,770.
🔍 The support zones at 89,082 and 87,942 did not hold either, because the move was extremely sharp and the price ignored them entirely.
💥 If you remember, we also had a momentum support on the RSI at 42.11.
💫 Once RSI stabilized below that level, the bullish momentum completely disappeared. Momentum shifted fully to bearish.
⚡️ Right now, RSI is still in the oversold zone and is pulling back toward the 30 level.
⚖️ If RSI starts moving downward again from here, Bitcoin has the potential to drop much further.
💡 Today, opening a position is much riskier than yesterday, but if you missed the move, breaking 85,770 isn’t a bad option for a continuation short.
✨ Just be careful: the market today is far more risky, so take positions with smaller risk and tighter management.
❌ Disclaimer ❌
Trading futures is highly risky and dangerous. If you're not an expert, these triggers may not be suitable for you. You should first learn risk and capital management. You can also use the educational content from this channel.
Finally, these triggers reflect my personal opinions on price action, and the market may move completely against this analysis. So, do your own research before opening any position.

BTC Dip Resilience: A Healthy Pullback Inside Structure - Dec 1 BTC is dipping again today, but the price action remains orderly and far from bearish breakdown territory. Despite the volatility, BTC continues to hold above the previous cluster of local lows, preserving its higher timeframe structure. More importantly, price is still sitting comfortably within a key support band that has acted as a demand pocket throughout this entire consolidation phase.
The market has not shown any signs of structural damage. Sellers pushed into support, but so far there has been no follow-through or momentum shift that would indicate trend exhaustion. Instead, the reaction looks controlled, with buyers stepping in each time price revisits this region. This kind of behavior usually reflects absorption rather than weakness.
In the bigger picture, this is the type of pullback you expect during a mid-cycle correction: sharp enough to unsettle sentiment, yet technically intact and anchored by strong underlying demand. Until we see a break beneath those prior lows, the path of least resistance remains upward.
Overall, the chart still leans bullish. The current dip is behaving like a constructive reset, not the start of a deeper unwind.

An Attempt at Seasonal Market Growth and BTC RollbackTo date, we have reached another bifurcation point in the market and it's time for another review. So far, there is a share of positivity in the market situation. As I wrote earlier, there is strong medium-term support for BTC in the 85-90k zone, from which a rollback is likely. Unfortunately, last month we broke through the 85k level, which is a signal for a possible test of 75k in the spring. However, the probability of a rollback from 85k to 90-100 still prevails. The broadcast opened the month ambiguously. According to Asian time, the opening is in the negative zone below 3000, higher in the neutral zone at GMT. I think the market will move this month based on the bullish BTC signal, and the coins will continue to move in different directions.
The seasonal growth period in the first half of December is also a positive signal. Once again, I would like to draw attention to the background trigger used by the United States to manipulate the market - brent oil. At the last bifurcation point, prices still collapsed, despite the positive data on US stocks, to which ETH immediately reacted with a consolidation below 3k, as I warned in the review. The current monthly candle opened above the interim support of $ 62.5, against which there is a signal for growth in the first half of the month at least.
As a result, we have signals for new growth waves for individual altcoins that have reached supports and have high growth goals, as part of seasonal growth, attempts to rollback BTC with oil and rollback according to the annual schedule. However, most of the alcoins, especially those with high capitalization or upcoming aggressive issuance, will not have time to show significant growth in this short period and will continue the medium-term bearish trend. Be careful with new purchases in the next couple of weeks. Today - tomorrow is the time when coins draw a shadow down the new monthly candle, but starting tomorrow evening or Wednesday, the probability of a reversal for individual coins will increase. If positive oil data is released in the middle of the week, then the growth of the crypt is likely to accelerate steadily by the end of the week, with a continuation in the next weekly candle. Next, the opening zone of the second half of the month will be of great importance.
For altcoins, in the event of a reversal attempt, the minimum target will be to overshoot the last monthly candle. For work today, I am considering the TURTLE NTRN ENSO VIC MITO BMT HOOK first of all. These tools were recently listed on binance, which reduces the threat of delisting hanging over projects from 20-22. The issue of these instruments is also smooth, which reduces the likelihood of further large drawdowns. Given today's circulating supply, these instruments are already in an oversold position and the likelihood of a reversal to growth at the slightest provocation from the market prevails. They also previously provided strong technical signals for growth up to 300%+, which will be worked out in the medium term.
Secondly, I am considering CHESS UTK COS DATA QUICK FIO for scalping, which can give new growth waves of up to 40-50% at least, but I recommend using a smaller position size for them. CHESS has been assigned the monitoring tag, but there are strong technical signals for a 0.1 retest, which is why a large exit pump is likely. After that, I will no longer consider using the token.
COINBASE Still looks strong!NASDAQ:COIN Coinbase appears to have printed completed 2 of (V), extending the targets to the upper boundary trend-line and R4 weekly pivot, $718.
Price found support at the weekly pivot just above the weekly 200EMA and lower trend-line.
🎯 Terminal target for the business cycle could see prices as high as $718 based on the weekly pivots
📈 Weekly RSI has reset below the EQ.
👉 Analysis is invalidated below wave (IV)
Safe trading

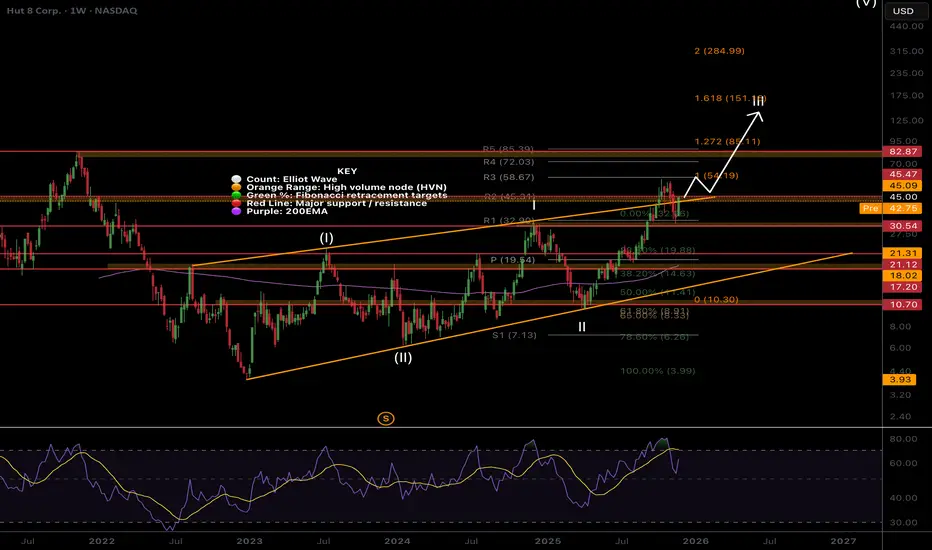
HUT Uptrend intactNASDAQ:HUT A large bearish engulfing candle at major resistance saw the price drop back into the range. It is now attempting break-out once more.
Price remains in a firm uptrend at major resistance with not much to add.
🎯 Terminal target for the business cycle could see prices as high as $135 based on Fibonacci extensions
📈 Weekly RSI hit overbought and reset back to the EQ.
👉 Analysis is invalidated if we close back below the weekly 200EMA
Safe trading
IREN Well overextended.... deeper pullback before upsideNASDAQ:IREN Price has overextended in a macro wave 3, the strongest and most powerful move described as a “wonder to behold” by Elliotticians. Novice investors are likely to get over-confident in these conditions, enter without risk management and keep chasing the price upwards only to be underwater when it turns around.
Profit taking appears to be taking place. I have closed my positions and am waiting for re-entry. The weekly pivots have been run.
Initial downside targets for wave (4) have been hit $39, the next is 0.382, $26.43. Expect shorts to pile in, adding to any downside momentum.
In the long term, we have higher to go in wave (5).
🎯 Terminal target for the business cycle could see prices as high as $124 based on daily pivots
📈 Weekly RSI hit overbought with no divergence
👉 Analysis is invalidated if we continue into price discovery
Safe trading

MARA cant catch a break, macro outlook still strongNASDAQ:MARA found support at the golden pocket and channel lower boundary just above the S1 pivot.
Price appears to be in an Elliot wave B, restricting upside targets to the 1:1 Fibonacci extensions at $106. Price is below the weekly 200EMA and pivot.
🎯 Terminal target for the business cycle could see prices as high as $106 based on Fibonacci extensions
📈 Weekly RSI is nearing oversold with room to fall
👉 Analysis is invalidated if we close back below wave (II)
Safe trading

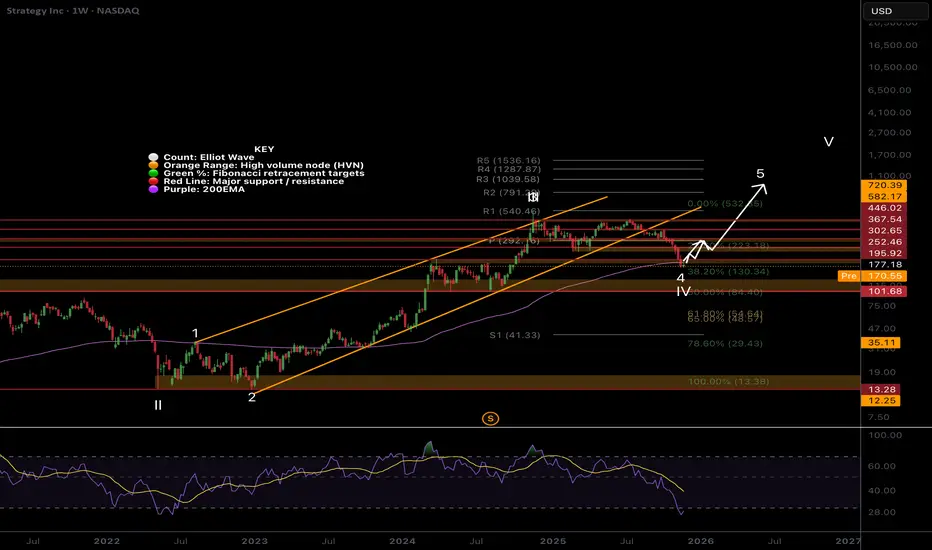
MSTR when will it end? Soon...NASDAQ:MSTR Sentiment is low, the asset is hated and misunderstood by TradFi and retail. It’s a recipe for a bottom!
Price hit the weekly 200EMA in wave 4. Not much more to add, there is room to fall to $101 High Volume Node, but a bottom should emerge soon.
🎯 Terminal target for the business cycle could see prices as high as $1000 based on pivots
📈 Weekly RSI hit oversold with bullish divergence from wave 2
👉 Analysis is invalidated if we close back below $84
Safe trading
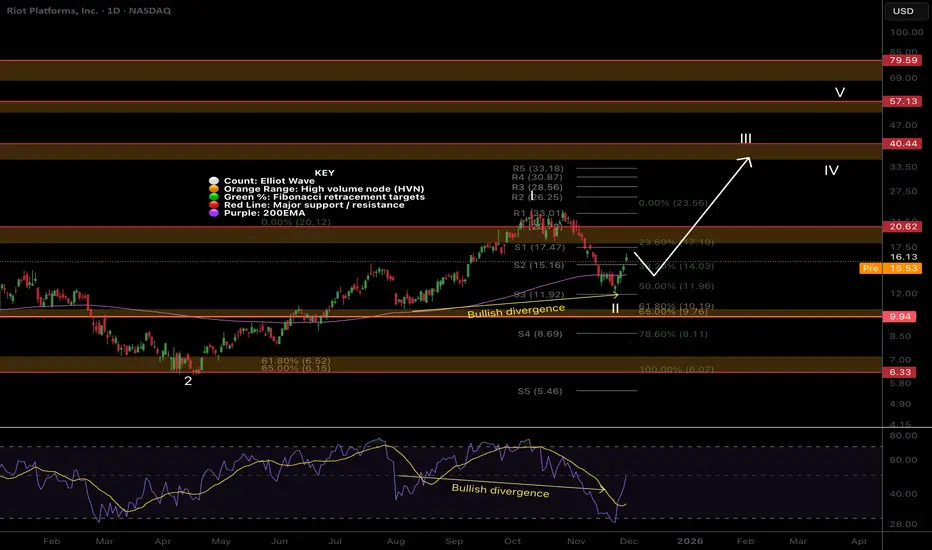
RIOT Macro outlook, weekly bullish divergenceNASDAQ:RIOT tested the upper boundary trend-line after its breakout. Expected behaviour.
A large weekly candle formed after hitting the weekly 200EMA and support suggesting the bottom is in.
Price remains above the downtrend and showed strength by poking above the wave 1 high.
🎯 Terminal target for the business cycle could see prices as high as $112 based on Fibonacci extensions
📈 Weekly RSI has bullish divergence
👉 Analysis is invalidated if we close below $6.33
Safe trading
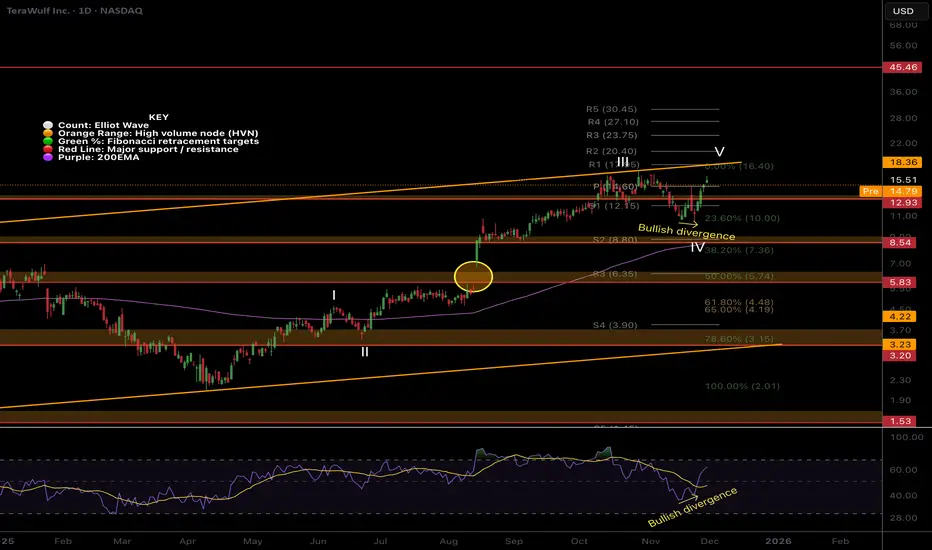
WULF LocalPrice caught a bid above the daily 200EMA on bullish divergence. It’s possible a triangle is forming for wave IV.
Price is stuck between the breakout upper-boundary and mean support, its hard to decipher the next direction as it stands. A breakout above the line could see it rally to $25 while back below wave IV would test the 200EMA.
📈 Daily RSI had confirmed bullish divergence but not from oversold
👉 Continued upside will invalidate this analysis.
Safe trading
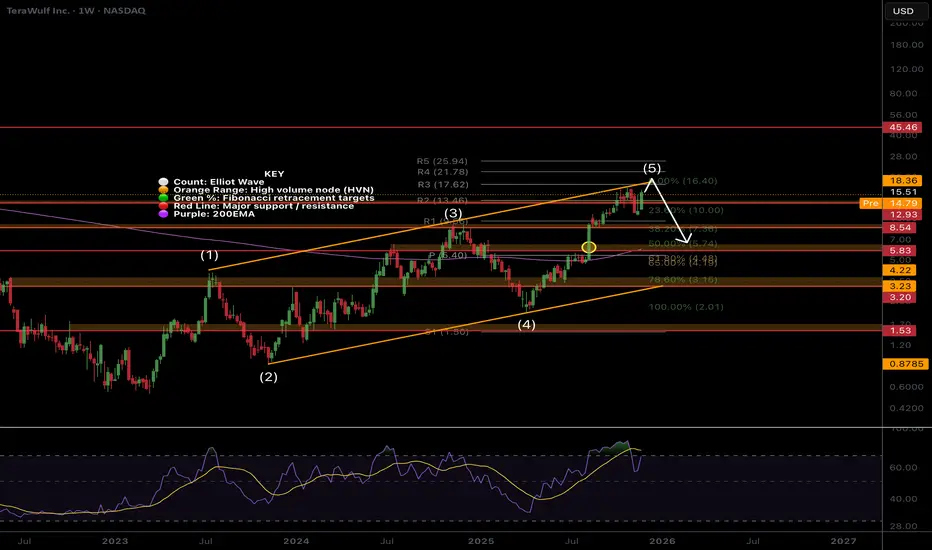
WULF Macro looks exhausted... pullback before higherNASDAQ:WULF Price appears exhausted at the upper channel boundary, and I have exited completely for now. The Elliot wave pattern completes a leading diagonal, which hints at higher to go after a deep wave 2 pullback, which could end at the 0.382 Fibonacci retracement, $8, but a more likely target is the 0.5 Fib at $5.84 with downside momentum. Also the weekly 200EMA.
Breaking out above the channel would change the count and structure and be very bullish. RSI has been overbought for a while. For now, I watch and wait.
🎯 Terminal target for the business cycle could see prices as high as $25 based on weekly pivots
📈 Weekly RSI is oversold with no divergence and can remain here for months as price keeps increasing.
👉 Analysis is invalidated if we close back above $20
Fair value sits at $11.
Safe trading
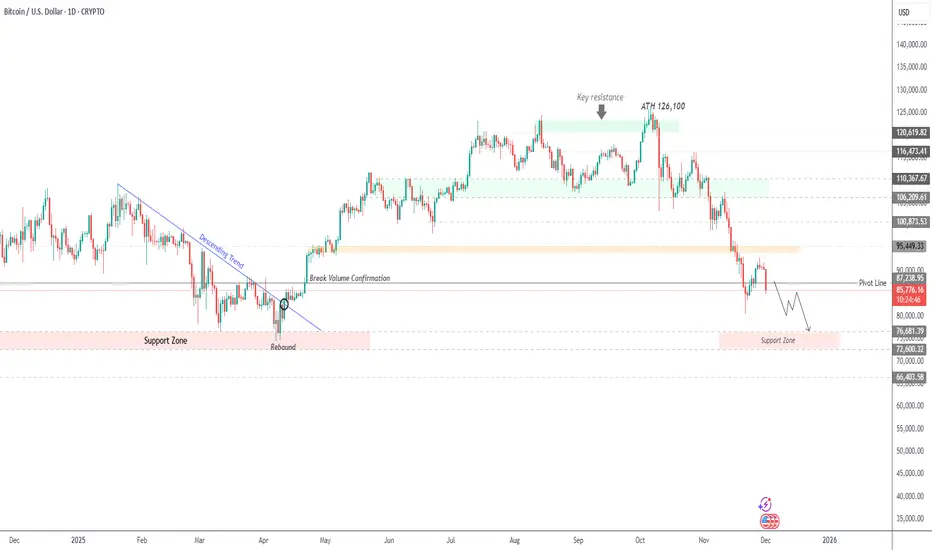
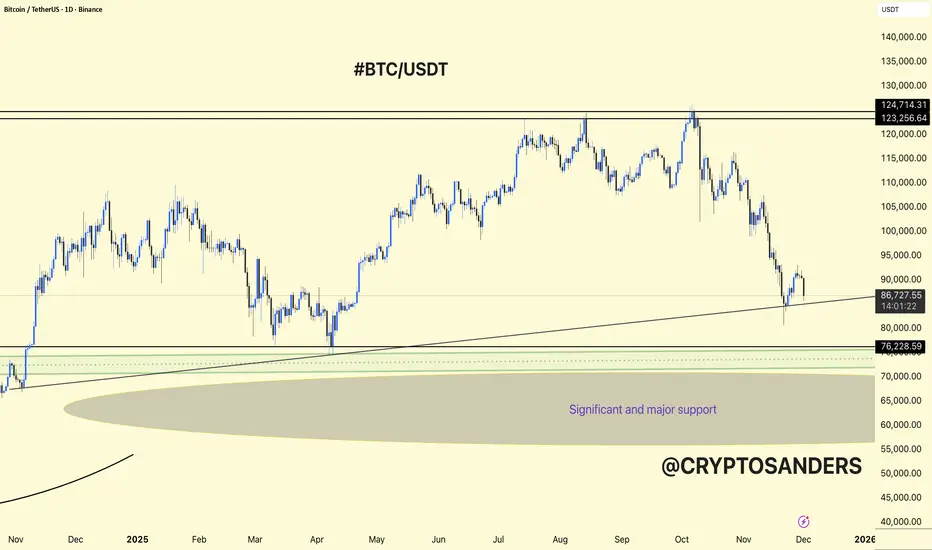
BTC/USDT 1DAY CHART UPDATE. BTCUSDT is in a corrective phase on the 1D chart, but it is still sitting above a major higher-timeframe support zone.
The chart shows a long-term ascending trendline from late 2024 to early 2025 that currently intersects just below the price, acting as dynamic support together with the horizontal 80k–82k area.
Below that, the wider “significant and major support” region lies roughly between 70k and 65k, which is the last strong demand block if 80k breaks.
Bullish case: Holding above the trendline and 80k–82k could form a higher low; from there BTCUSDT can attempt a recovery toward 95k–100k and eventually back to the 120k+ resistance, but it needs clear higher highs and higher lows on the daily to confirm.
Bearish case: A clean daily close below the trendline and 80k support opens room for a deeper flush into the 70k–65k major support zone, where a larger accumulation base may form before any new up‑leg.
DYOR | NFA
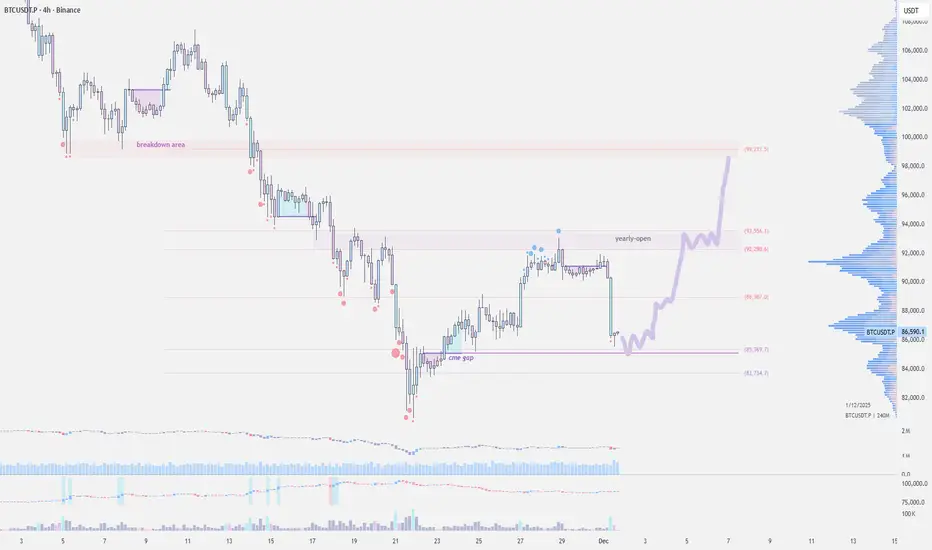
Bitcoin Kicks Off December in the RedCRYPTOCAP:BTC opened the month in red, a strong sell-off slammed BTC from $91.5k to $85k in just three hours.
Bitcoin's recent strength was largely driven by hopes of a December Fed cut, but this move looks more like the market finally cooling off after running overheated for weeks.
Now price is trying to stabilize around the $86k support near the CME gap. There are early signs of a bounce, and if buyers defend the 84–86k zone, a move back toward the 94–95k breakdown area is possible. If that support gives way, expect another dip or continued consolidation.