ETH — Price Slice. Capital Sector. 2884.25 BPC 2.5© Bolzen | The Architect | BPC Framework
Bolzen Market Institute
🏷 ETH — Price Slice. Capital Sector.
TradingView Publication Date: 09.01.2026
🏷 2884.25 — price not yet reached at time of publication.
🏷 BPC — The Bolzen Price Covenant — Strength Index: 2.5
Quantum structure of obligations and capital flow in price formation via energy blocks.
🏷 Vertical chart — Energy Grid Dashboard.
🏷 Static Stream 1: price published in energy-block production sequence.
🏷 The price energy block is already ordered—not by time, but by execution priority. Crucially: block priority dynamically reconfigures in response to hidden energetic impulses, whereas price execution order records their market manifestation. Every price in the dynamic stream is tied to proprietary energy-production metrics inaccessible to the general public. Those who perceive structure before its manifestation do not follow price—they anticipate it.
EΞ2Φ8Ψ45Θ·ζ⁻¹·106Λ732·Ω²
📎 Screenshot:
🏷 When trading from levels, use liquidity zones from BPC 10 and above.
🏷 Bolzen Liquidity Map — ETH (numerical equivalent):
🏷 I. Interactive Reference Guide: BPC — The Bolzen Price Covenant
🏷 P.S. English is not my native language — I offer no apologies for stylistic imperfections. What you see here is not a post. It is a demonstration of another level of preparation: the symbiosis of human intuition and algorithmic precision. Mathematics and aggressive market analysis — against the machine of liquidations.
The persistent ETH and BTC Energy Grid Dashboard remains publicly accessible and is intended for international institutional review.
Dear users!
At the request of all those who support my work and use it for analytics, I’ve decided to start publishing short weekly analytical notes for the upcoming week. Subscribe and read — you already have all the tools to see the market clearly: Prefactum prices, quantum analytics, analytical notes, and the monitoring dashboard.
Every price represents a separate energy block and scenario, down to the smallest changes. I would like to thank the TradingView moderators for the opportunities provided on the international stage.
Over time, it becomes clear who creates the picture, who is a dilettante, who is a professional, who is an institution, and who is an architect. Your attention and time are your main resources. Thank you!
— The Architect
BPC — The Bolzen Price Covenant
Btc-e

GBPNZD NEXT MOVEGBPNZD is showing a clear bearish reversal setup after breaking down from an ascending channel and losing key trendline support, signaling a shift in market structure toward sellers. The strong impulsive bearish candle indicates increasing downside momentum, with price now targeting the major demand zone below where previous accumulation and strong buying reactions occurred. Fundamentally, the New Zealand dollar is gaining relative strength on expectations of tighter monetary conditions and stable economic outlook, while the British pound remains pressured by growth concerns, inflation sensitivity, and policy uncertainty. As long as price remains below the broken trendline and fails to reclaim prior resistance, rallies are likely to be corrective, favoring continuation toward lower liquidity zones, making short-side positioning aligned with trend, structure, and macro flow for profit-focused trading.

NZDJPY NEXT MOVENZDJPY is showing a strong bullish continuation after reclaiming and holding above a key demand and resistance flip zone, confirming a market structure shift in favor of buyers. The impulsive move higher followed by shallow consolidation signals healthy momentum and sustained buying interest, often seen before another expansion leg. From a fundamental perspective, the New Zealand dollar remains supported by relatively resilient economic outlook and carry trade demand, while the Japanese yen continues to weaken due to accommodative monetary policy, low yield environment, and persistent divergence against higher-yielding currencies. As long as price maintains above the breakout zone and continues to print higher highs and higher lows, the probability favors further upside continuation, making pullbacks into structure attractive for trend-following long opportunities with momentum, liquidity flow, and macro bias aligned for profit potential.

Bitcoin Alert: Bear Flag on weekly chartPreviously, I shared the big map on Bitcoin with three paths there
It looks like the first orange path to the downside could play out soon as the price charted
well-known Bear FLag pattern (yellow)
Watch breakdown
Target: $53-54k
Invalidation: $98k
The target zone perfectly aligns with the bottom of previous consolidation (white)

Interesting Channel on BTCUSDs. 2month log chartThis channel has provided support for bitcin’s price action since 2013. Currently retesting its bottom trendline as we speak. Yes it’s true rising channels usually breakdown instead of up, but this one is so strong that I wouldn’t be surprised if it holds support again here and goes for a retest of the top of the channel again.if so we should likely see bitcoin resume its uptrend by the next 3month candle if not the current one. *not financial advice*

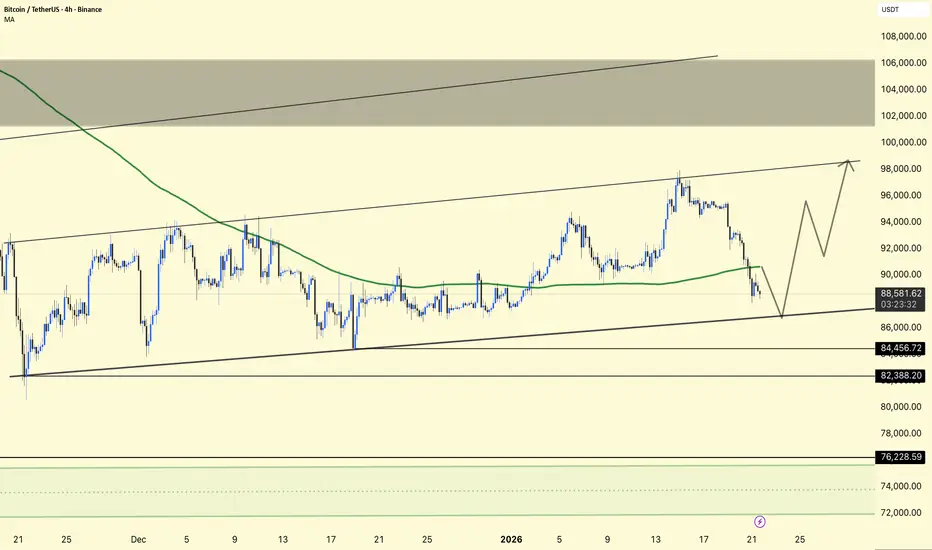
BTC/USDT – 4H Small Chart Update. BTC/USDT – 4H Small Chart Update.
Price is moving inside a rising parallel channel (upper & lower trendlines respected).
BTC is currently pulling back toward the lower channel support and the moving average zone.
The green MA is acting as dynamic support on dips.
Support: 88,000 – 86,500 (channel base + MA confluence)
Major Support: 84,500 → 82,300 (breakdown risk zone)
Resistance: 94,000 – 98,000 (upper channel/supply)
Hold above lower trendline → bounce → retest 95K–98K
Breakdown below 84.5K → deeper correction likely
The structure remains bullish while it is inside the channel. This looks like a healthy pullback, not trend failure—unless the lower trendline is lost on strong volume.
Not financial advice. Manage risk.
BITCOIN The ultimate RSI Fibonacci cheat-sheet you MUST know.Bitcoin (BTCUSD) continues to consolidate within its 1W MA50 (blue trend-line) and 1W MA100 (green trend-line), a zone whose importance we've covered on various previous analyses. This time we re-introduce a old concept, which was always an integral part of our long-term Cycle analyses, the 1W RSI Channel.
As you can see, the 1W RSI has bounced on its 0.786 Fibonacci level, a trend-line where it always hits and rebounds historically (blue circles) before completing Stage 1 of the Bear Cycle. In the previous two Bear Cycles, this has coincided with the 1W MA50-100 consolidation. After that, the RSI rebounded and tested the 0.618 Fib (orange circles), which again in the last two Cycles coincided with a 1W MA50 test, and got rejected (initiating Stage 2) towards the bottom of the Channel for the eventual Cycle bottom (green circles).
As a result, it is likely to see one last rally for that 1W MA50/ 0.618 Fib rejection (unless the 1W MA100 breaks/ closes first) before the eventual Cycle bottom on Fib 1.0 (Channel bottom). That is expected to be on the 1W MA350 (red trend-line) at least ($50000), which is where the previous Cycle bottomed in November 2022.
So do you think that's a useful RSI cheat-sheet? Feel free to let us know in the comments section below!
---
** Please LIKE 👍, FOLLOW ✅, SHARE 🙌 and COMMENT ✍ if you enjoy this idea! Also share your ideas and charts in the comments section below! This is best way to keep it relevant, support us, keep the content here free and allow the idea to reach as many people as possible. **
---
💸💸💸💸💸💸
👇 👇 👇 👇 👇 👇

Bitcoin enters bullish reversal zone —RSI Oversold, 6 red days &There are two signals supporting a bullish reversal around current price levels. Any trading below $90,000 should be instantly bought.
This chart shows Bitcoin on the 4H timeframe including the RSI.
Bitcoin's 4H RSI hit the lowest since 21-November 2025 and also entered "oversold" territory, extremely weak. This reading of oversold on the 4H timeframe has been present only twice since the end of the correction.
The first time was 21-November and Bitcoin started to grow. The second instance happened 1-December and right after Bitcoin started to grow. Then never again the 4H RSI reads oversold.
When Bitcoin becomes oversold on the 4H RSI, this signals that a reversal is coming next. There is more.
The highest bearish volume on the current drop happened 15-January. Yesterday and today, 19 and 20 January, Bitcoin produced a lower low yet volume is lower. Signaling weakening bearish momentum.
The final signal is based on the daily timeframe. Bitcoin produced five consecutive days red only once in several years and this happened only recently as part of a consolidation. After the fifth red day, the action tends to turn bullish.
Here is the thing, Bitcoin is now trading on its 6th consecutive red day. This event only happened once back in May 2023. Needless to say, Bitcoin turned bullish the ensuing day.
Retraces should be an opportunity to buy-in, rebuy and reload. The relief rally is not over. Bitcoin is trading within a very strong higher low compared to 21-November, and the action is happening above $90,000. Any trading below $90,000 is a strong buy opportunity in anticipation of a bullish resumption.
Thanks a lot for your continued support.
Namaste.

Why Does BTC Often Move Strongly During the U.S. Session?Not by coincidence — but because real money enters the market
If you’ve traded BTC long enough, you’ve probably noticed a familiar pattern:
Asian session: slow price action, compression, sideways
European session: increased volatility, trap-building
U.S. session: BTC makes the real move
So the question is:
👉 Why does BTC usually show its strongest volatility during the U.S. session?
1. The Largest Capital Flows Enter During the U.S. Session
The U.S. session is when:
U.S. banks
Hedge funds
Prop desks
Institutional traders
U.S.-based crypto whales
👉 Start trading aggressively
This is not retail money.
This is institutional capital, trading large size — not scalping a few dozen dollars.
When big money enters → the market must move.
2. The U.S. Session Is When News Gets “Activated”
Most major news that impacts BTC happens during the U.S. session:
CPI, PPI, FOMC
Fed interest rate decisions
DXY and U.S. Treasury yields
U.S. stock market open
👉 All occur during the U.S. session.
BTC doesn’t exist in isolation.
It reacts strongly to:
Risk-on / Risk-off sentiment
USD strength or weakness
Capital flowing into or out of risk assets
3. Highest Liquidity → Structure Breaks More Easily
The U.S. session has:
The highest daily volume
The deepest liquidity
More stable spreads
➡️ This makes it the ideal time to break ranges,
take out highs and lows from the Asian and European sessions.
💡 Many:
True breakouts
Large stop hunts
Strong expansions
👉 Happen at the start or middle of the U.S. session.
4. Europe–U.S. Overlap: BTC’s “Golden Hour”
During the Europe–U.S. overlap:
European traders are still active
U.S. traders are just entering
📌 Liquidity + liquidity = explosive volatility
If BTC has:
Been compressed all day
Accumulated for a long time
Gathered enough liquidity
👉 The U.S. session is often when that energy is released.
5. Retail Traders Get Trapped the Most During the U.S. Session
One hard truth:
Retail traders often FOMO on large candles
Enter when volatility is at its peak
Place stop losses where everyone can see
👉 And that’s also when:
Whales sweep stops
The market shakes violently before moving in the real direction
💡 The U.S. session is not just when BTC moves,
but also when those without a plan get eliminated the fastest.

Bitcoin at the Edge of the 4-Year CycleOn the BTCUSD Daily timeframe, the chart is signaling a high-risk, late-cycle environment rather than a fresh bullish expansion. When viewed through the lens of the Bitcoin 4 year cycle, the current structure closely mirrors prior cycle tops in 2014, 2018, and 2022 , where price accelerated into a rising channel, printed euphoric highs, and then formed a bull trap before a deep corrective phase.
Structurally, Bitcoin remains inside a rising macro channel, but momentum has clearly weakened. Price has failed to sustain acceptance above the upper trendline and is now rotating near the mid–upper range of the channel, a location that historically favors distribution, not accumulation. The repeated rejection zones highlighted on the chart show where smart money previously offloaded positions while retail chased continuation.
From a cycle + EMA perspective, this is critical. In previous cycles, once price stretched far above the long-term EMAs and momentum began compressing, the market transitioned from markup into distribution. The current price action higher highs with overlapping candles and fading impulse fits that same behavioral profile. This is where bull traps are engineered: price holds elevated levels just long enough to trap late buyers before liquidity is pulled.
The projected downside scenario toward the ~$60,000 support region is not extreme it is structurally logical. That zone aligns with prior cycle support, channel equilibrium, and historical re-accumulation levels. A breakdown from the current consolidation would likely trigger a cascade move, as leverage unwinds and long term holders hedge risk.
To be clear:
This does not invalidate Bitcoin’s long-term bullish thesis. It suggests that the market may be transitioning from late-cycle euphoria into a corrective/reset phase, which is a normal and necessary part of every 4-year cycle.
In summary:
👉this scenario is absolutely possible and technically justified.
👉 Current price action favors risk management, not aggressive longs.
👉 The coming phase is about who exits late and who prepares early for the next true accumulation cycle.
Smart money is already thinking in cycles, not candles.

Smart Money Accumulation or Just a Dead Cat Bounce?Bitcoin on the H1 timeframe has just printed a textbook liquidity sweep, and this move is far more meaningful than it looks at first glance. After spending an extended period compressing below the descending trendline and beneath the resistance zone around 95,500–95,800, price failed to reclaim that supply area. The rejection was clean and decisive, followed by a sharp impulsive sell-off, slicing through the EMA and breaking the internal range support without hesitation. This type of candle structure is not retail-driven it signals active distribution and aggressive sell-side execution.
The drop flushed price directly into a clearly defined demand / support zone around 92,000–91,800, where liquidity had been resting for multiple sessions. The reaction so far is constructive: long lower wicks, slowing downside momentum, and a short-term bounce suggest buyers are defending this zone, at least temporarily.
From a structural perspective, this is now a make-or-break area:
If BTC holds above the support zone and builds higher lows, a corrective rebound toward 94,000 → 94,600, and potentially a retest of 95,700 resistance, becomes technically valid. This would align with a classic liquidity grab → mean reversion scenario.
However, if price fails to reclaim the EMA and shows weak follow-through, this bounce should be treated as a corrective pullback, not a trend reversal. A clean breakdown below 91,800 would confirm bearish continuation, opening the path toward deeper liquidity near 90,900 → 90,200.
➡️ Bias: Neutral-to-bullish only while support holds
➡️ Key level: 91,800 demand zone
➡️ Risk: High — market is transitioning, not trending
This is not a FOMO long environment. The next move depends entirely on how price behaves inside this demand zone accumulation or breakdown will decide the next impulse.

OIL consolidating. OIL is moving in the range. Will wait patiently to either SELL at RESISTANCE or BUY at SUPPORT.

AAVEUSDT - Bear market. Breakdown of support at 162.0BINANCE:AAVEUSDT is testing the support of the range amid a market decline. Bulls are reversing their positions due to weakening fundamentals. Focus on support at 162.0
Bitcoin is falling due to the deterioration of the fundamental background. The altcoin market is reacting aggressively and entering a short zone. AAVE is breaking out of the range, and if it closes below 162.0, the decline may intensify
A pre-breakout base is forming relative to 162.0. Before the fall, a retest of the local liquidity zone at 165.9 is possible. However, closing below the support at 162.0 will be a signal for a further decline to 157.0 - 148.0.
Support levels: 162.0, 157.23, 148.06
Resistance levels: 165.9, 169.1
The price breaking out of the range suggests readiness for further movement. A breakout of support indicates that the movement will be downward. Closing below 162.0 could trigger a sell-off to 157 - 148 - 145.
Best regards, R. Linda!

Bitcoin Breakdown Complete: Accumulation or Just a BounceOn the BTCUSD H1 timeframe, price action has officially shifted into a post-breakdown environment, and the structure on this chart is very clear from a professional market-structure perspective. Bitcoin previously spent a significant amount of time rotating inside a tight accumulation/balance range around 93,000 – 93,500, with price holding above the EMA 89. However, that range was distribution, not accumulation. The decisive bearish impulse candle sliced cleanly through the range, the EMA, and prior intraday support confirming acceptance below value, not a fake break.
After the breakdown, price attempted to stabilize briefly, but sellers maintained control and forced continuation lower. This behavior tells us two things:
1. Buyers failed to defend the range, and
2. The market is now actively searching for real demand, not resting.
The current move into the 91,800 – 90,800 support zone is structurally logical. This zone aligns with a prior demand base and represents the first area where responsive buyers may step in. The green projected path on the chart reflects a technical rebound scenario, but it should be viewed strictly as a corrective reaction, not trend continuation.
As long as price remains below the broken accumulation range (~93,000), any upside move is classified as a lower-high pullback within a bearish intraday structure. A clean reclaim and acceptance back above that range would be required to shift bias bullish again. Until then, rallies are vulnerable to selling pressure.
This is not a dip-buy environment yet, it is a range failure followed by a liquidity run. If price reacts strongly from the support zone, short-term bounces are tradable. But structurally, Bitcoin remains weak below value, and patience is required to see whether this support produces real accumulation or simply fuels the next leg down.
Smart traders wait for confirmation not hope.

Bitcoin Sweeps Lower Support — Relief Bounce or SetupOn the BTCUSD H1, price has completed a clean bearish displacement from above the EMA cluster, confirming a short-term shift in control from buyers to sellers. The impulsive sell-off sliced through prior balance and left behind a clearly defined resistance zone around 93,200–93,700, which now acts as a supply cap rather than a reclaimable level in the immediate term.
After the breakdown, Bitcoin attempted a weak corrective pullback into that resistance zone. The reaction there was telling: upside momentum stalled quickly, bullish follow-through failed, and sellers stepped back in aggressively. This behavior confirms lower-high formation and reinforces that the move up was corrective, not impulsive. Structurally, the market is now in a markdown continuation phase, not consolidation.
Price has since flushed into the 90,300–90,600 support zone, where the current pause is taking place. This area is a logical place for short-term demand to react, and the green projection reflects a technical relief bounce scenario. However, it’s important to frame this correctly: any bounce from support is still counter-trend unless BTC can reclaim and hold above the 93,200 resistance band with acceptance.
If buyers defend the support zone and build a base, a corrective push toward 92,500 → 93,200 is realistic as liquidity is rebalanced. That move would mainly serve to reload supply rather than signal trend reversal. Conversely, a clean breakdown and acceptance below the support zone would expose BTC to deeper continuation, as there is limited structure beneath to slow momentum.
Bitcoin remains bearish on the H1 structure. The current support zone may generate a bounce, but until resistance is reclaimed with strength, rallies should be viewed as corrective and sell-side opportunities, not trend continuation. Patience is required the market is still digesting downside liquidity.

Capitulation Then Compression — Is Bitcoin Building a Base Bitcoin has just experienced a sharp impulsive sell-off, breaking down aggressively from the prior balance area. This move was fast, vertical, and emotional a classic liquidity-driven dump rather than a slow structural unwind. Such behavior typically signals capitulation, where weak hands are forced out of positions. After the drop, price did not continue trending lower immediately. Instead, BTC transitioned into a sideways consolidation range, marked clearly on the chart. This range reflects temporary equilibrium as selling pressure cools and the market begins to reassess value.
📊 Market Structure & Price Context (H1)
Bitcoin has just experienced a sharp impulsive sell-off, breaking down aggressively from the prior balance area. This move was fast, vertical, and emotional — a classic liquidity-driven dump rather than a slow structural unwind. Such behavior typically signals capitulation, where weak hands are forced out of positions.
After the drop, price did not continue trending lower immediately. Instead, BTC transitioned into a sideways consolidation range, marked clearly on the chart. This range reflects temporary equilibrium as selling pressure cools and the market begins to reassess value.
🟢 Support Zone: The Key Inflection Area
Price has now reached and reacted from a well-defined support zone, which aligns with the base of the recent sell-off. This area is critical for short-term structure:
- It represents the zone where buyers are willing to step in.
- It is the first level where a meaningful reaction is expected.
- Failure or acceptance here will determine the next directional leg.
The current price behavior suggests stabilization, not continuation selling an important distinction.
🔄 Rotation vs Breakdown Logic
From a price action perspective, two paths are clearly developing:
Bullish rotation scenario:
If BTC holds above the support zone and begins forming higher lows, price can rotate back into the previous sideways range. Acceptance above that range would confirm a mean reversion move, opening the door for a recovery toward the upper boundary of consolidation.
Bearish continuation risk:
If support fails with strong momentum and acceptance below the zone, the market would signal that sellers remain in control, exposing BTC to a deeper continuation leg.
At the moment, there is no confirmation of breakdown only a test.
🧠 Structural Takeaway
This is no longer a trending environment it is a reaction zone. The impulsive drop has already occurred; what matters now is how price behaves at support, not how far it already fell.
Strong moves are followed by decisions. Bitcoin is now at that decision point.
Patience is essential here. Let the market confirm whether this is a base for rotation or just a pause before continuation.

Relief Bounce Is Likely, But Trend Is Still FragileOn the H1 timeframe, Bitcoin has just experienced a sharp impulsive sell-off, breaking below both short-term and mid-term EMAs and accelerating straight into a key support zone around 90,800–91,000. This move is characteristic of a capitulation leg, where stops are flushed aggressively and price travels quickly without meaningful pullbacks.
The most important detail is the sequence of events. BTC was previously consolidating above the EMA cluster, but once that structure failed, selling pressure expanded rapidly. Price did not pause at minor levels, confirming that this was initiative selling, not simple profit-taking. The loss of EMA support has clearly flipped short-term market control back to sellers.
However, as price reaches the highlighted support zone, momentum is beginning to slow. This area represents prior demand and liquidity, where buyers have previously shown interest. The small-bodied candles and reduced downside follow-through suggest that selling pressure is being absorbed, opening the door for a short-term relief bounce.
Any upside from here should be treated as corrective by default. The former breakdown area around 91,800–92,000 is the first upside target and also a key decision zone. A reaction into this level would simply be a mean reversion after an oversold move. If price stalls or shows rejection there, it would reinforce the bearish continuation scenario.
The higher resistance zone around 93,000–93,300, aligned with prior structure and EMA resistance, marks the upper boundary of a potential corrective rally. Only a strong reclaim and acceptance above this zone would invalidate the bearish short-term bias and suggest that the sell-off was a false breakdown.
In summary, Bitcoin has likely completed the impulsive leg down and entered a reaction phase. A bounce from support is technically reasonable, but as long as price remains below broken structure and EMA resistance, the market is still in a sell-the-rally environment. This is a moment for patience and confirmation, not aggressive prediction.

The Bitcoin bull runBitcoin began its bull run in November of 2022, we are currently 40% of the way through the bull run.
I think the bull run will end around the end of 2026.
Long entry: 89k USD
Take profit: between 1 million and 2 million USD
In my opinion there is a high probability that it will reach between 1 and 2 million, 1.2 million could be a likely target.
This is my personal opinion and this is not a financial advice! Good trading!

This Does Not Look Good For Bitcoin!Trading Fam,
Real talk. It does not look good for Bitcoin.
I will not make friends with this post. But I'm not into popularity contest. I simply want to show you what the charts are saying.
My old followers know that I ignored the Head and Shoulders pattern I spotted last cycle. Though, I got a much higher ratio of "likes" on that one post because I continued to believe in hope and hype ...I paid dearly.
I show my wins. And I show my most embarrassing losses. But one thing I will not do is lie.
After all, there is truly no loss if we learn. And so, we will either win here with me OR we will learn.
I learned. And maybe? So did you. I'm tired of paying for expensive lessons. It's time to be cautious and preserve our capital.
Though this Head and Shoulders pattern is not even complete yet, we have to put it on our radar. It's an ominous looking beast. Over 85% of the time, these things do play out. If you're into hopium you might be like, "So you're saying there's still a chance"? Well, yeah. I guess. If you want to look at it that way. Maybe, up to a 15% chance Bitcoin negates this pattern. But let's review a few of the other bearish indicators that have already played out (I have noted these numerous times in previous posts and videos):
Couldn't break above that Pi Cycle Top Trendline. Hit it to the 'T' three times but could not break it.
Wyckoff Market Cycle (previous post) currently playing out.
Megaphone pattern (previous post) played out
Bear Flag broken today (though not yet confirmed)
Below that orange 350-day SMA - almost always indicates entry into a bear cycle
A "SELL" signal from my most reliable indicator, The Pivot Zones Indicator .
And now?
Now, we are forming that very ominous Head and Shoulders pattern. I will not ignore it again. A break below that RED 2021 Top Trendline, which is also acting as the neckline, is not good. It's not good at all.
I'll leave it at that and let the chart do the rest of the talking.
Take care friends,
✌️Stew

ETH — Price Slice. Capital Sector. 2912.51 BPC 2© Bolzen | The Architect | BPC Framework
Bolzen Market Institute
🏷 ETH — Price Slice. Capital Sector.
TradingView Publication Date: 03.01.2026
🏷 2912.51 — price not yet reached at time of publication.
🏷 BPC — The Bolzen Price Covenant — Strength Index: 2
Quantum structure of obligations and capital flow in price formation via energy blocks.
🏷 Vertical chart — Energy Grid Dashboard.
🏷 Static Stream 1: price published in energy-block production sequence.
🏷 The price energy block is already ordered—not by time, but by execution priority. Crucially: block priority dynamically reconfigures in response to hidden energetic impulses, whereas price execution order records their market manifestation. Every price in the dynamic stream is tied to proprietary energy-production metrics inaccessible to the general public. Those who perceive structure before its manifestation do not follow price—they anticipate it.
EΞ2Φ8Ψ45Θ·ζ⁻¹·106Λ732·Ω²
📎 Screenshot:
🏷 When trading from levels, use liquidity zones from BPC 10 and above.
🏷 Bolzen Liquidity Map — ETH (numerical equivalent):
🏷 I. Interactive Reference Guide: BPC — The Bolzen Price Covenant
🏷 P.S. English is not my native language — I offer no apologies for stylistic imperfections. What you see here is not a post. It is a demonstration of another level of preparation: the symbiosis of human intuition and algorithmic precision. Mathematics and aggressive market analysis — against the machine of liquidations.
— The Architect
BPC — The Bolzen Price Covenant

ETH — Price Slice. Capital Sector. 2920.48 BPC 19© Bolzen | The Architect | BPC Framework
Bolzen Market Institute
🏷 ETH — Price Slice. Capital Sector.
TradingView Publication Date: 20.01.2026
🏷 2920.48 — price not yet reached at time of publication.
🏷 BPC — The Bolzen Price Covenant — Strength Index: 19
Quantum structure of obligations and capital flow in price formation via energy blocks.
🏷 Vertical chart — Energy Grid Dashboard.
🏷 Static Stream 1: price published in energy-block production sequence.
🏷 The price energy block is already ordered—not by time, but by execution priority. Crucially: block priority dynamically reconfigures in response to hidden energetic impulses, whereas price execution order records their market manifestation. Every price in the dynamic stream is tied to proprietary energy-production metrics inaccessible to the general public. Those who perceive structure before its manifestation do not follow price—they anticipate it.
EΞ2Φ8Ψ45Θ·ζ⁻¹·106Λ732·Ω²
📎 Screenshot:
🏷 When trading from levels, use liquidity zones from BPC 10 and above.
🏷 Bolzen Liquidity Map — ETH (numerical equivalent):
🏷 I. Interactive Reference Guide: BPC — The Bolzen Price Covenant
🏷 P.S. English is not my native language — I offer no apologies for stylistic imperfections. What you see here is not a post. It is a demonstration of another level of preparation: the symbiosis of human intuition and algorithmic precision. Mathematics and aggressive market analysis — against the machine of liquidations.
The persistent ETH and BTC Energy Grid Dashboard remains publicly accessible and is intended for international institutional review.
Dear international community,
I extend my gratitude to the TradingView moderation team for their impartiality and support of analytical work at the global level, as well as to all who follow my research. This platform serves as a space to demonstrate contributions to the advancement of market analytics.
Attention and time are your most valuable resources. ATH is emotion; timeframes are your truest allies. Thank you.
— The Architect
BPC — The Bolzen Price Covenant

ETH — Price Slice. Capital Sector. 2944.78 BPC 10.1© Bolzen | The Architect | BPC Framework
Bolzen Market Institute
🏷 ETH — Price Slice. Capital Sector.
TradingView Publication Date: 08.01.2026
🏷 2944.78 — price not yet reached at time of publication.
🏷 BPC — The Bolzen Price Covenant — Strength Index: 10.1
Quantum structure of obligations and capital flow in price formation via energy blocks.
🏷 Vertical chart — Energy Grid Dashboard.
🏷 Static Stream 1: price published in energy-block production sequence.
🏷 The price energy block is already ordered—not by time, but by execution priority. Crucially: block priority dynamically reconfigures in response to hidden energetic impulses, whereas price execution order records their market manifestation. Every price in the dynamic stream is tied to proprietary energy-production metrics inaccessible to the general public. Those who perceive structure before its manifestation do not follow price—they anticipate it.
EΞ2Φ8Ψ45Θ·ζ⁻¹·106Λ732·Ω²
📎 Screenshot:
🏷 When trading from levels, use liquidity zones from BPC 10 and above.
🏷 Bolzen Liquidity Map — ETH (numerical equivalent):
🏷 I. Interactive Reference Guide: BPC — The Bolzen Price Covenant
🏷 P.S. English is not my native language — I offer no apologies for stylistic imperfections. What you see here is not a post. It is a demonstration of another level of preparation: the symbiosis of human intuition and algorithmic precision. Mathematics and aggressive market analysis — against the machine of liquidations.
— The Architect
BPC — The Bolzen Price Covenant

ETH — Price Slice. Capital Sector. 2957.65 BPC 2.5© Bolzen | The Architect | BPC Framework
Bolzen Market Institute
🏷 ETH — Price Slice. Capital Sector.
TradingView Publication Date: 08.01.2026
🏷 2957.65 — price not yet reached at time of publication.
🏷 BPC — The Bolzen Price Covenant — Strength Index: 2.5
Quantum structure of obligations and capital flow in price formation via energy blocks.
🏷 Vertical chart — Energy Grid Dashboard.
🏷 Static Stream 1: price published in energy-block production sequence.
🏷 The price energy block is already ordered—not by time, but by execution priority. Crucially: block priority dynamically reconfigures in response to hidden energetic impulses, whereas price execution order records their market manifestation. Every price in the dynamic stream is tied to proprietary energy-production metrics inaccessible to the general public. Those who perceive structure before its manifestation do not follow price—they anticipate it.
EΞ2Φ8Ψ45Θ·ζ⁻¹·106Λ732·Ω²
📎 Screenshot:
🏷 When trading from levels, use liquidity zones from BPC 10 and above.
🏷 Bolzen Liquidity Map — ETH (numerical equivalent):
🏷 I. Interactive Reference Guide: BPC — The Bolzen Price Covenant
🏷 P.S. English is not my native language — I offer no apologies for stylistic imperfections. What you see here is not a post. It is a demonstration of another level of preparation: the symbiosis of human intuition and algorithmic precision. Mathematics and aggressive market analysis — against the machine of liquidations.
— The Architect
BPC — The Bolzen Price Covenant
