BTCUSDT - Short-Term Pullback Opportunity?Hello everyone, today let's analyze BTCUSDT in the current market context. The 3-hour chart shows that BTCUSDT has been on a strong uptrend, but it has now encountered strong resistance at the 114,800 USD level. If this level is not broken, a short-term pullback is highly likely.
Currently, a pullback seems necessary after a significant rally. The nearest support level is 112,200 USD, and if this is broken, the price could decline further. This correction could be temporary before the uptrend resumes, but if the support is not maintained, BTCUSDT could face a deeper drop.
Trading Strategy:
Sell if the price continues to face resistance at 114,800 USD.
Watch key support levels, especially 112,200 USD, for a potential entry point.
In conclusion, BTCUSDT may experience a pullback in the short term. If the key support is broken, the downtrend could continue. Stay alert for clear signals before entering the trade!
BTC-M

Altcoins we are so back.Toyal2 \ After the major downward trend break in the bitcoin parity cycle, the altcoin bull run has started again.

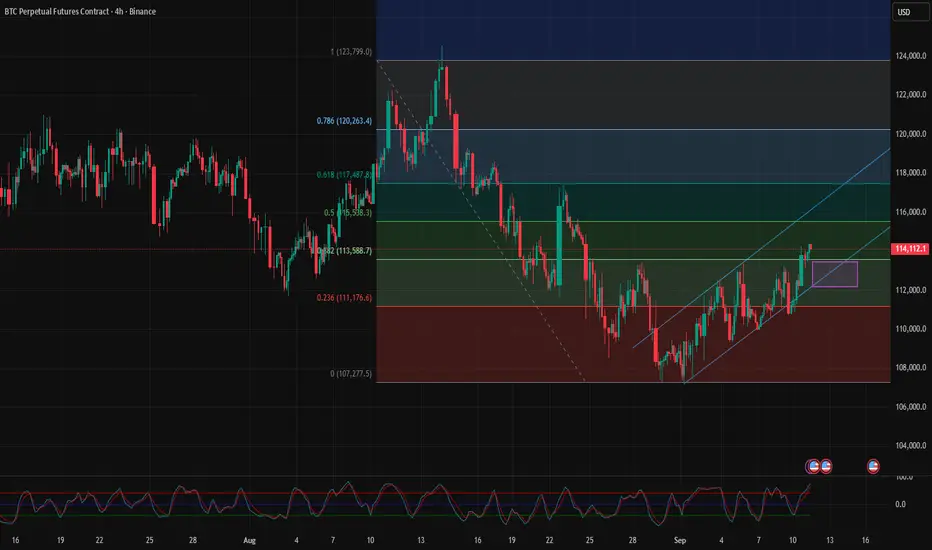
116.15K is the next BTC TARGETMorning folks,
So, after two solid pullbacks out of 113.5K resistance area, BTC is decided to break it on a background of 50bp cut from the Fed next week. So, both Thu setups has worked nice. You either hold longs or out at breakeven with shorts that we have taken last week...
Anyway, we consider 116.15K as the most probable target for now, because price shape doesn't show signs of acceleration and looks more like AB=CD pullback out from 105-108K support area.
Thus, for short entry we prefer to wait when this target will be met. Long entry now theoretically could be possible, but we do not see good stop order placement that let us to turn probability in our favor. That's why, if you have longs - keep it, but price possession is not perfect for a new one, especially at the eve of CPI release...

BTCUSD POSSIBLE BUY SETUP -----118K Break of Structure (BOS): Multiple bullish BOS indicate a trend reversal from bearish to bullish.
Change of Character (CHoCH): Confirmed trend shift early on.
Descending trendline broken: Signaling the end of bearish momentum.
Price broke above resistance (~$113,250): Now acting as a support zone (highlighted in green).
Current price: ~$114,272
Bullish target zone: Between $116,000 – $118,000, marked in maroon.

BITCOIN passed the PIVOTOn the daily timeframe, Bitcoin broke above the monthly pivot at 113,350 with a strong green candle yesterday, surpassing the resistance area at 112,700. The next resistance is around 119,380, the first pivot resistance.

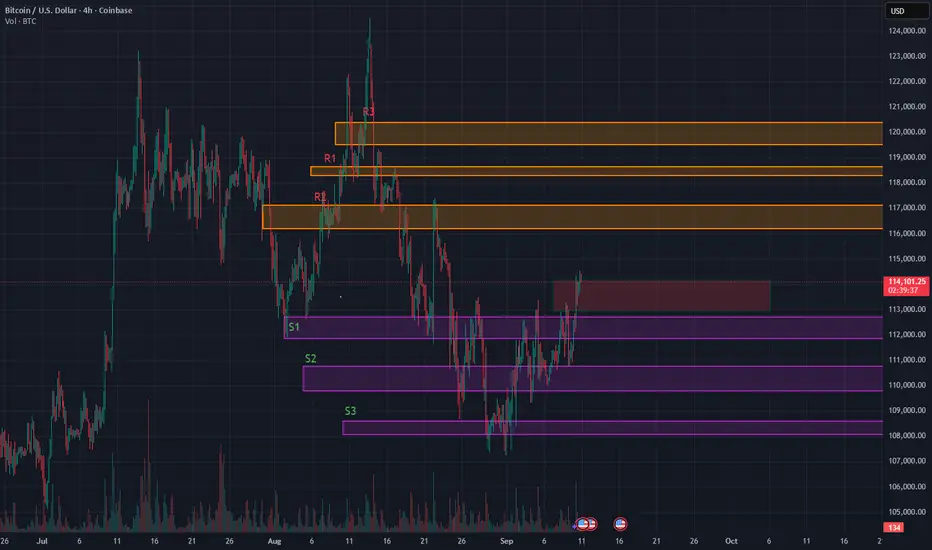
Range-Bound Rocket: BTC’s Coiled Spring Between S1 and R3-ATHRange Bound Rocket: BTC Loaded and Coiled for $120k Retest
Description:
BTC is now trading around $114,260, still inside the range I’ve flagged earlier. We reloaded at our previously posted support zones between $110k and $111k. That gives us a strong base.
I’m watching for acceptance above the $113k to $114k red box, which overlaps with the neckline of a potential reverse Head & Shoulders on the 4‑hour chart. It hasn’t triggered yet but we are in validation mode. (expecting a retest to 113k and then a break up) If we get a breakout with volume expansion and wide‑bodied candles, I’ll treat that as a valid activation. Target remains $119k and above.
This table shows how likely BTC is to stay above certain price levels over the next two weeks based on current volatility. These are not predictions, they represent statistically expected ranges based on price behavior.
2WK/Probability, Price Level, Meaning
90%, ~$96,700 BTC is very likely to stay above this level
75%, ~$103,200 BTC has a strong chance of staying above here
50%, ~$111,000 This is the midpoint, BTC has equal chance of being above or below
25%, ~$119,400 BTC has a one in four chance of closing higher than this
10%, ~$127,400 Only a small percentage of outcomes put BTC above this level
Key takeaways:
BTC is currently trading around $114,260, sitting just above our red resistance zone at $113,000 to $114,000.
Our first upside target, $118,000, lines up with the top 25 to 30 percent range of expected outcomes. This is reachable if the broader market stays supportive.
$120,000 sits closer to the top 20 percent threshold. BTC would need strong momentum and favorable macro data to push there in the next two weeks.
Downside probabilities
While the structure looks bullish, we should still consider these potential retracement levels:
Around 46 percent chance BTC dips below $110,000
Approximately 43 percent chance it drops under $109,000
Roughly 30 percent chance BTC trades below $105,000
These downside paths are consistent with our S2 and S3 support zones, which were successfully defended during the last major pullback.
What I'm doing and suggest :
Breakout confirmation:
I’m looking to add above $113k to $114k only if volume expands and candles show conviction, meaning minimal wicks and strong closes. Weak volume or upper wicks mean the breakout could fail. Main stop is back inside the range. Scalpers can use a tighter invalidation below $112.2k.
Reload zone:
A move into $110k to $109k is a statistically common retest. I’ll look for buyer defense and fading downside pressure to reload.
Volatility risk:
I'm already positioned long from our previously posted support zones around $110k to $111k, so I’m not actively adding or hedging right now. Into CPI and the Fed, I’m staying hands-off unless we get a clear breakout or strong market signal.
For those not in position:
Avoid chasing breakouts before the event
Look for confirmation or reaction post-data
If we get a volatility spike, retests of $110k to $109k are still statistically common and may offer a better entry
The goal is to avoid being overexposed heading into binary catalysts. I’m holding my current spot exposure and letting the trade breathe.
If no breakout forms:
I expect BTC to remain in a range between $111k and $118k. Support zones from prior posts maintained a bullish bias. If BTC consolidates below $114k but keeps forming higher lows, I’ll consider that ongoing accumulation.
Catalysts to monitor:
Nasdaq or NQ breakdown
• Tech strength: Nvidia up ~30% YTD on strong Blackwell Ultra demand, ADI and MX showing strength despite macro headwinds.
Jobless claims rising again
• U.S. jobless claims are rising to 237K, signaling labor market cooling. Continuing claims are easing but job additions in August were weak at just 22K. Recent wide downward revisions (~911K fewer jobs year-to-date) reinforce rate‑cut bets.
Geopolitical risk
• Geopolitical tensions remain tail‑risks.
Fed rate tone and CPI reaction
• Fed tone and CPI outputs are increasingly important as data is tilting soft and markets are pricing in easier policy.
• The USD’s trajectory matters. Further weakness helps BTC and tech space gain more cushion.
Tech remains a key driver. AI and semis continue to lead Nasdaq strength, and BTC still tracks equity moves closely. A soft dollar also reduces market drag and supports upside potential.
$BTC bounce at $112 or drop down to $101.3??CRYPTOCAP:BTC is forming a massive “M” pattern with a potential target around $101.3.
There are multiple support levels on the way down, so a bounce could happen at any of them. Ideally, this scenario gets invalidated with a strong rebound from $112K. Otherwise, the correction may drag on for weeks until a solid bottom is found.
The RSI is oversold on the 2H, but on the 1W timeframe, CRYPTOCAP:BTC looks like it’s just entering a longer-term correction.
⚠️ If the weekly bearish trend confirms, we could be facing several months of downside.
Will this trigger the start of alt season, or will altcoins get crushed even harder? Nobody can say for sure—so stay cautious and don’t get trapped by FOMO.
Here is the 1W chart, which is scary to be honest.
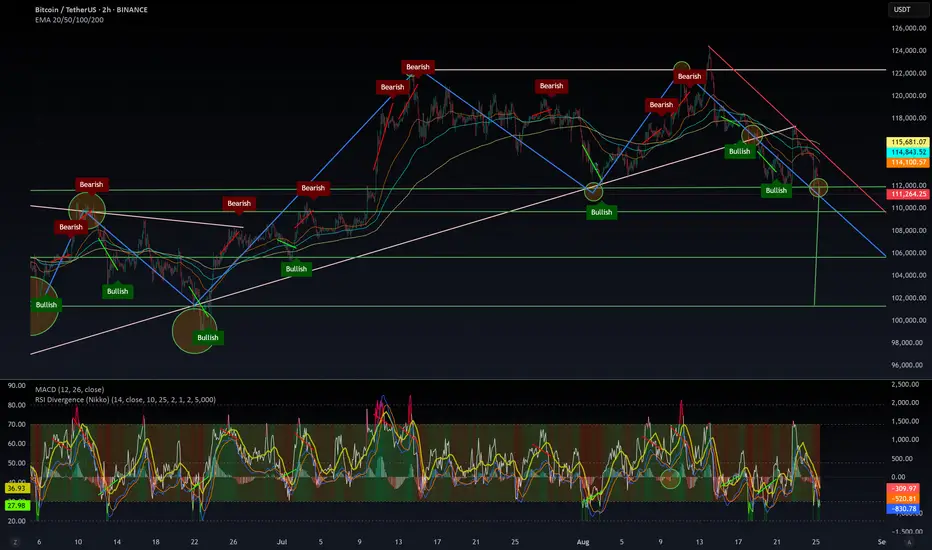
$BTC : bearish MACD crosover on 1WThe chart speaks for itself: we have a bearish crossover on the weekly MACD — historically a strong signal for a 3 to 6-month correction.
I know this goes against the current bullish sentiment, but every time this setup has appeared, the market corrected for several months. This time, however, the RSI isn’t extremely overbought, which could mean a shorter correction (1–2 months).
👉 Will this time be different?
If history repeats, the correction target sits around $96K–$98K at the 50-week SMA, a level that has always provided strong support in the past.
But if that support breaks… welcome to a new bear market.

Don't miss the final BTC Rocket of this cycle !!!When it dips, get ready to jump in! BTC is about to moon this cycle 🚀 See you at $124k!
No more retesting $104k — even breaking below $107k looks tough now. Get ready to ride the final wave of this cycle!!! 💰
If you don’t have any position yet, now's a good time to enter your first one. BTC just broke through the legendary EMA200.
As for me, I’ve been buying and selling along the way, locking in profits during this uptrend.
Spot portfolio’s running, options are live, and the futures with x20 leverage — I’m running it, but trying not to get too reckless 😛
For those already holding — stay strong and enjoy being rich.
#BePatientStayCalm #LifeHackTrader
BTC Inverse Head and ShouldersThe chart clearly shows an inverse head and shoulders formation:
Left Shoulder: ~Aug 26 low.
Head: ~Aug 29 low.
Right Shoulder: ~Sep 5-7 low.
This is a bullish reversal pattern after a prolonged downtrend. The breakout above the neckline (around 113,200 – 113,500) confirms the bullish bias.
Fib & Extension Targets :
Immediate target: Fibonacci 1.0 extension ~119,600.
Extended target: 1.618 extension ~123,500.
These align well with previous resistance levels (early August highs).

BTC/USD 4H Chart Review1. Growth channel (orange lines)
• The price moves inside the growing channel.
• Currently testing the upper part of this channel → potential resistance.
2. Horizers of support and resistance (red and green lines)
• Support:
• $ 111 632
• 110 019 $ (key support, breaking down can deny an upward trend).
• resistance:
• $ 113 255 (local, currently tested).
• 115 197 $
• 117 416 $ (strong target resistance in the channel).
3. STOCHASTIC RSI (bottom of the chart)
• The oscillator is in the bribe zone (80-100) → possible short -term withdrawal.
• But - if the upward trend is strong, the indicator may remain in this zone for a long time.
⸻
📊 Scenarios
• Bull (continuation of the trend):
• Benefinage above 113K and a breakdown of 115.2k → opens the road to 117.4k.
• The growth channel acts as a guide - as long as the lower line is maintained, the upward trend continues.
• Bear (correction):
• Rejection from 113–115K with a simultaneous signal with RSI → decrease towards 111.6k.
• If 111.6k falls, the goal is 110k.
⸻
⚠️ Applications
• The short -term market looks bought (Stoch RSI), so the correction cannot be ruled out.
• medium -term - as long as the price stays in the growth canal and above 111K, the advantage is on the buyers' side.
• Key level for observation now: 113K -115K. Breaking up = continuation, jet = correction.

LTC CONFIRMATION $114 can get LTC to up $120LTC is at this moment at an important zone, and if it targets $114 with confirmation, it could break to up $120

Bitcoin Warming Up- Like always, everything in the graphic to simplifies the information, stay simple is better.
- Bitcoin is known for its extreme price volatility, which can lead to major fluctuations, such as a significant crash in value followed by a rapid doubling of its price in a very short period, for that simple reason i avoid to predict low timeframe moves.
- Now check the hidden bullish divergence, check the level of BBW, the volality could be low, but TheKing could be ready to make parabolic move soon or later.
- I do my best to try to post at the good time for medium long term investment.
- Don't forget that 125,000$ is far to be enough.
Happy Tr4Ding !

TradeCityPro | Bitcoin Daily Analysis #174👋 Welcome to TradeCity Pro!
Let’s dive into Bitcoin analysis. Today the U.S. inflation data was released, so let’s see how it impacted the market.
⌛️ 4-Hour Timeframe
Earlier today, the PPI index came in favorably for the market, and Bitcoin responded with an upward move following the news.
🔔 Yesterday, however, we saw some unusual global events. Israel carried out a military strike in Qatar, and at the same time, Nepal’s government collapsed following a popular revolution.
✨ These developments were negative for risk assets like Bitcoin, and as a result, the price was rejected from its resistance zone.
✔️ That said, news like this usually impacts markets only temporarily. Today, Bitcoin once again found support at the trendline and pushed higher with strong volume back into the key zone.
📊 Volume has risen significantly, and with today’s bullish PPI release, the current candle is closing above the resistance area.
💥 At the same time, the RSI is breaking through the 64.92 level, which greatly increases the likelihood of Bitcoin starting its next bullish leg. So if you’re already holding a long position, it’s worth keeping it open—there are no clear signs of weakness in the trend yet, and the market still has room to move upward.
🧩 If you don’t have a position open, you can look for entries on lower timeframes once resistance breaks. However, keep in mind that I personally already opened my positions with earlier triggers, and any new triggers appearing today come with higher risk.
❌ Disclaimer ❌
Trading futures is highly risky and dangerous. If you're not an expert, these triggers may not be suitable for you. You should first learn risk and capital management. You can also use the educational content from this channel.
Finally, these triggers reflect my personal opinions on price action, and the market may move completely against this analysis. So, do your own research before opening any position.

BTCUSD: Fake Breakout and Drop to Support LineHello everyone, here is my breakdown of the current Bitcoin setup.
Market Analysis
From a broader perspective, the price of Bitcoin has transitioned from a downward channel into a large rising wedge pattern. This structure has defined the price action for several weeks, creating a volatile environment with clear boundaries at the support zone near the 109000 level and the resistance zone up to the 113000 area.
Currently, we are at a very interesting and critical point. The price has once again rallied to the top of the Wedge and is testing the major horizontal resistance at the 112500 level. This is the third significant test of this ceiling in recent history.
My Scenario & Strategy
My scenario is built on a repeating pattern of behavior I've observed at this resistance. On the two previous tests of this 112500 area, the price created a 'fake breakout', briefly pushing above the level only to be aggressively sold off. This repeated failure is a strong clue that sellers are dominant here.
My expectation is that history will repeat itself. I'm looking for the price to make one more 'fake breakout' push into the 112500 - 113000 resistance zone. A swift reversal and a fall back below the 112500 level would be the key signal that sellers have once again taken control. The primary target for this move is 110700, which aligns with the ascending wedge support line.
That's the setup I'm tracking. Thank you for your attention, and always manage your risk.

BITCOIN PREDICTION: IS USA MANIPULATING THE MARKET?! (big move) Yello Paradisers! We have been taking a look at what's going on with the new data release from USA. We have been taking a look at the CME futures gap. We have been taking a look at the multi-timeframe analysis on the ultra-high timeframe chart. We have been going through the moving average touch channel possible reclaim and the Elliott Wave Theory on multiple timeframes. I've shared with you where, with the highest probability, the next move will happen and what kind of confirmations we are waiting for.
Paradisers! Keep in mind to trade only with a proper professional trading strategy. Wait for confirmations. Play with tactics. This is the only way you can be long-term profitable.
Remember, don’t trade without confirmations. Wait for them before creating a trade. Be disciplined, patient, and emotionally controlled. Only trade the highest probability setups with the greatest risk to reward ratio. This will ensure that you become a long-term profitable professional trader.
Don't be a gambler. Don't try to get rich quick. Make sure that your trading is professionally based on proper strategies and trade tactics.

BTC's situation+next targets and expected movementsThe price seems to have completed the corrective wave, and from now on, it's time for a price increase, which will continue up to around $150k .
_ _ _ _ __ _ _ _ _ _ _ _ _ _ _ _ _ _ _ _ _ _ _ _ _ _ _ _ _ _ _ _
✅Thank you, and for more ideas, hit ❤️Like❤️ and 🌟Follow🌟!
⚠️Things can change...
The markets are always changing and even with all these signals, the market changes tend to be strong and fast!!

BTC - Are the bulls looking for a liquidity grab?Market Context
Bitcoin is holding strong after bouncing from a higher support zone and is now pressing into an area packed with liquidity. The recent bullish price action has carved out multiple fair value gaps on the way up, each serving as confirmation of demand and strengthening the bullish structure. Above current price lies a major cluster of buy-side liquidity — a magnet for price.
Fair Value Gaps & Confirmations
On the way up, price created several bullish fair value gaps that have each been respected as support. The first, second, and now third retests into these imbalances show that demand continues to step in, absorbing supply and building pressure upward. Adding to that, a bullish inversion fair value gap (IFVG) has formed, giving extra confirmation that buyers are in control.
Liquidity Target Above
The most obvious draw for price is the heavy buy-side liquidity resting above recent highs. With so many stops positioned there, the market is incentivized to push higher and sweep that zone. The path toward it could involve another retest into one of the fair value gaps below before expansion takes place, or a direct continuation straight into the liquidity pocket.
Final Thoughts
This structure is showing textbook bullish strength: stacked fair value gaps, IFVG confirmation, and a clear liquidity pool overhead. Unless the market breaks back below the deeper support zone, the expectation remains a run into buy-side liquidity.
If this breakdown sharpened your view, a like is appreciated — and I’d love to hear from you: do you expect a retest first, or do we shoot straight into liquidity?

BTC 4H Analysis - Key Triggers Ahead | Day 38😃 Hey , how's it going ? Come over here — Satoshi got something for you!
⏰ We’re analyzing BTC on the 1-Hour timeframe.
👀 On the 4-hour timeframe of Bitcoin we can see that Bitcoin was under a descending trendline, and each time it touched this trendline it faced selling pressure. Bitcoin broke this trendline at the end of August, and since the beginning of September until now it has been ranging below the $113,000 resistance, where it has touched this level 3 times and then got rejected downward. Usually, these kinds of zones don’t break easily, and if they do, it is together with major global economic news.
⚙️ The key RSI zone of Bitcoin in the 4-hour timeframe is at 65. A swing scenario is considered for Bitcoin after the news, and if this news comes in favor of the risky market (crypto), it can move above the 65 range and even enter overbought territory.
🕯 The size, volume, and number of green candles have almost increased, while red candles are still accompanied by selling pressure. There is a taker-seller zone above, at the $113,000 resistance, that has kept the price down. With the release of news, a good wave of capital can enter or exit the market.
📊 On the 4-hour timeframe of USDT.D we can see that Tether dominance is in a very important support zone, and losing this support can bring good volume into the market. I think this support break can also happen with today’s PPI news. Tether dominance, like Bitcoin, was above a continuation ascending trendline, but now it has broken the trendline and is ranging below it. This shows us the importance of the news!
📊 On the 4-hour timeframe of BTC.D we can see that Bitcoin dominance is in a support zone, and with a 4-hour candle that looks like multiple profit-taking it got supported and moved upward. Although the move is small, we should pay attention. The resistance zone of Bitcoin dominance is at 58.36%, and the support zone is at 58.06%. Losing these zones can give altcoins very strong moves.
🔔 Bitcoin is now under an important resistance at $113,000. If this zone is broken, it can move upward again. A very strong support zone is also built by maker buyers at $107,627, which is quite far from the current price. For a long position, wait until the taker-seller zone is taken out with a whale candle and then enter on the pullback. Also pay attention that altcoins can give us the most profit during this period when both Bitcoin dominance and Tether dominance are dropping.
❤️ Disclaimer : This analysis is purely based on my personal opinion and I only trade if the stated triggers are activated .

Gold | H2 Double Top | GTradingMethodHello Traders 👋
🧐 Market Overview:
I’ll be honest — I’m feeling a little hesitant about entering another Gold trade. The last few setups have gone against my system more than I would like. But trading is always a game of probability — clusters of losses are part of the process.
The key is staying disciplined. Over the long run, probability is in my favour, and that’s why I have to take this trade. My system is flagging a potential double top on the H2 chart, and the so far setup aligns with my rules.
Some of the variables I look for:
- Negative rsi divergence
- decreasing volume on the second top
- Need candle to close in range to take the trade
📊 Trade Plan:
Risk/Reward: 3.7
Entry: 3666
Stop Loss: 3689
Take Profit 1 (50%): 3592
Take Profit 2 (50%): 3565
💡 GTradingMethod Tip:
Even the best systems go through losing streaks. The edge comes not from avoiding them, but from executing consistently and letting probability work itself out over time.
🙏 Thanks for checking out my post!
Make sure to follow me for more setups and share your thoughts — will this H2 double top play out, or does Gold still have momentum to push higher?
📌 Disclaimer:
This is not financial advice. This content is to track my trading journey and for educational purposes only.

Gold | H1 Head and Shoulders | GTradingMethodHello Traders 👋
We’re finally getting a clean pattern to short Gold on.
🧐 Market Overview:
The chart is showing signs of exhaustion. We already have negative RSI divergence and decreasing volume on the right shoulder — both pointing to weakening buying momentum. I’m still waiting for confirmation before fully committing, but the setup is looking solid.
📊 Trade Plan:
Risk/Reward: 4.0
Entry: 3640.77
Stop Loss: 3652.5
Take Profit 1 (50%): 3602.4
Take Profit 2 (50%): 3581.5
💡 GTradingMethod Tip:
When trading reversal patterns like head & shoulders, volume is key. A drop in volume on the right shoulder often strengthens the case for a potential move lower.
🙏 Thanks for checking out my post!
Make sure to follow me to catch the next setup and let me know what you think — will this H&S confirm, or does Gold still have room to push higher?
📌 Disclaimer:
This is not financial advice. This content is to track my trading journey and for educational purposes only.

Bitcoin BTC is at a Critical Level: Equal Highs Trade Plan💰 Bitcoin (BTC) Update 💰
BTC is currently trending upward 🟢📈 on the 30M timeframe ⏰ and has reached a critical level ⚖️. We’re seeing a shift in structure 🔄, but there are equal highs forming 📍, leaving the question: will price break higher and continue bullish 🚀, or reject and move lower 🔽?
📊 My trade plan is simple:
✅ Wait for a break above the current range/equal highs 📈
✅ Look for a retrace + retest 🔄
✅ Enter long on confirmation 🎯
If this setup fails to play out, then the idea is invalidated ❌ and we stand aside.
⚠️ This analysis is for educational purposes only and not financial advice. 📚

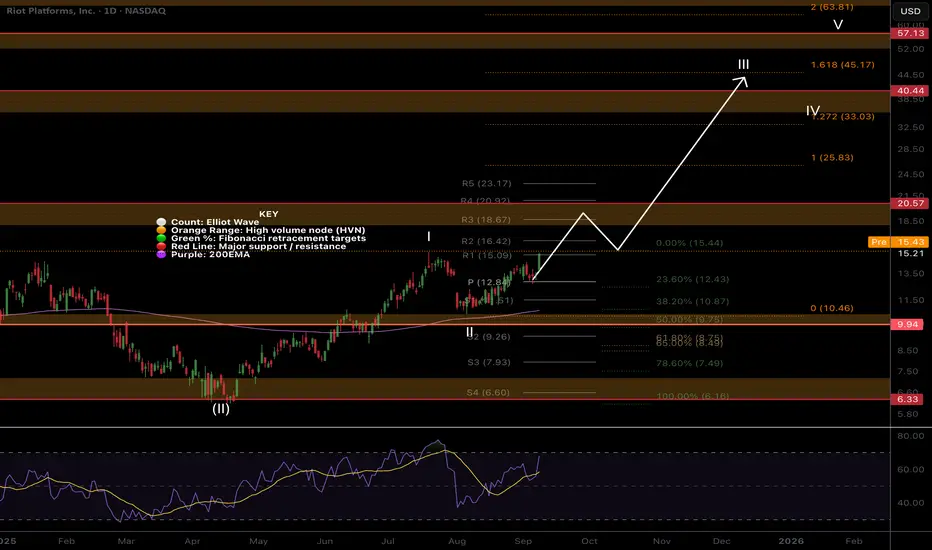
RIOT Continues wave 3.NASDAQ:RIOT is moving well in wave 3 after price completed wave 2 at the triple support -0.5 Fibonacci retracement, High Volume Node (HVN) and daily 20EMA.
Fibonacci extension targets for wave 3 are minimum $45.17, which falls in line with wave 4 retesting the High Volume Node resistance as support at $34.
Daily RSI will put in bearish divergence if we continue higher today so watch out for that. An initial rejection or consolidation at $18 HVN is expected.
Analysis invalidated below $10.5
Safe trading