Gold | H2 Double Top | GTradingMethodHello Traders 👋
🧐 Market Overview:
I’ll be honest — I’m feeling a little hesitant about entering another Gold trade. The last few setups have gone against my system more than I would like. But trading is always a game of probability — clusters of losses are part of the process.
The key is staying disciplined. Over the long run, probability is in my favour, and that’s why I have to take this trade. My system is flagging a potential double top on the H2 chart, and the so far setup aligns with my rules.
Some of the variables I look for:
- Negative rsi divergence
- decreasing volume on the second top
- Need candle to close in range to take the trade
📊 Trade Plan:
Risk/Reward: 3.7
Entry: 3666
Stop Loss: 3689
Take Profit 1 (50%): 3592
Take Profit 2 (50%): 3565
💡 GTradingMethod Tip:
Even the best systems go through losing streaks. The edge comes not from avoiding them, but from executing consistently and letting probability work itself out over time.
🙏 Thanks for checking out my post!
Make sure to follow me for more setups and share your thoughts — will this H2 double top play out, or does Gold still have momentum to push higher?
📌 Disclaimer:
This is not financial advice. This content is to track my trading journey and for educational purposes only.
BTC-M

Gold | H1 Head and Shoulders | GTradingMethodHello Traders 👋
We’re finally getting a clean pattern to short Gold on.
🧐 Market Overview:
The chart is showing signs of exhaustion. We already have negative RSI divergence and decreasing volume on the right shoulder — both pointing to weakening buying momentum. I’m still waiting for confirmation before fully committing, but the setup is looking solid.
📊 Trade Plan:
Risk/Reward: 4.0
Entry: 3640.77
Stop Loss: 3652.5
Take Profit 1 (50%): 3602.4
Take Profit 2 (50%): 3581.5
💡 GTradingMethod Tip:
When trading reversal patterns like head & shoulders, volume is key. A drop in volume on the right shoulder often strengthens the case for a potential move lower.
🙏 Thanks for checking out my post!
Make sure to follow me to catch the next setup and let me know what you think — will this H&S confirm, or does Gold still have room to push higher?
📌 Disclaimer:
This is not financial advice. This content is to track my trading journey and for educational purposes only.

Bitcoin BTC is at a Critical Level: Equal Highs Trade Plan💰 Bitcoin (BTC) Update 💰
BTC is currently trending upward 🟢📈 on the 30M timeframe ⏰ and has reached a critical level ⚖️. We’re seeing a shift in structure 🔄, but there are equal highs forming 📍, leaving the question: will price break higher and continue bullish 🚀, or reject and move lower 🔽?
📊 My trade plan is simple:
✅ Wait for a break above the current range/equal highs 📈
✅ Look for a retrace + retest 🔄
✅ Enter long on confirmation 🎯
If this setup fails to play out, then the idea is invalidated ❌ and we stand aside.
⚠️ This analysis is for educational purposes only and not financial advice. 📚

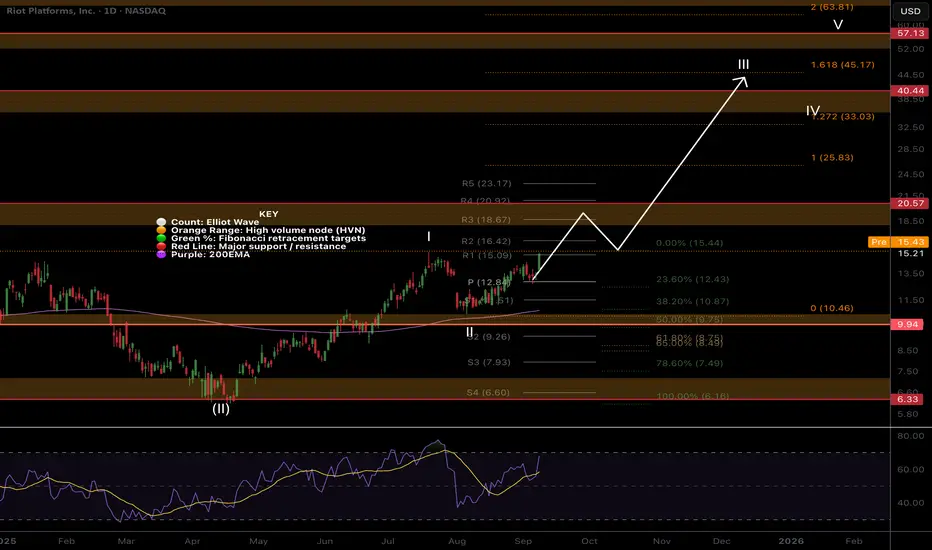
RIOT Continues wave 3.NASDAQ:RIOT is moving well in wave 3 after price completed wave 2 at the triple support -0.5 Fibonacci retracement, High Volume Node (HVN) and daily 20EMA.
Fibonacci extension targets for wave 3 are minimum $45.17, which falls in line with wave 4 retesting the High Volume Node resistance as support at $34.
Daily RSI will put in bearish divergence if we continue higher today so watch out for that. An initial rejection or consolidation at $18 HVN is expected.
Analysis invalidated below $10.5
Safe trading
COIN Ready for Gap Fill?NASDAQ:COIN Coinbase looks ready for move up to at least fill the gap at $359 if not make new all time highs.
Daily RSI printed bullish divergence and price broke out yesterday into bullish market structure. A break above the High Volume Node resistance could see new all time highs sooner than expected!
Analysis is invalidated if we drop below the swing low and that will continue my previous analysis downwards with a target of the ascending 200EMA, High Volume Node support, S1 Pivot at $282.
Safe trading

BTCUSD POSSIBLE BUY SETUP 112,167 TO 120,000📊 BTCUSD – Potential Bullish Continuation Ahead
Description:
BTCUSD has recently shown a break of structure (BOS) and a clean break above the descending trendline. Price is currently forming higher lows, which suggests a possible continuation to the upside.
Support Zone: $110,000 – $111,000
First Target Zone: $113,000 – $114,000
Main Target Zone: $116,000 – $117,000
My Bias (plan):
I remain bullish as long as the price holds above $ 110,000.
Possible entry: retracement around $111K – $112K.
Stop Loss: below $110K.
Take Profit: $113K – $117K.
Risk Management:
⚠️ This is not financial advice. Manage your risk properly—never risk more than you can afford to lose.
Community Note:
I share analysis like this regularly. If you find it useful, feel free to follow me here on TradingView for more updates 🙌.

BTC - Biggest Bull crypto fake-out ever?Hello Traders,
While many are thinking the party is just about to resume I have found clear bear divergence on BTC and other crypto plus much other TA supporting the move will be down and real soon. Also I believe the move will be down in stocks. Bad inflation data will be the cause starting this morning and accelerating with tomorrow’s follow up. Let’s see how this ages.

US100 - New Highs are coming!Market Context
The US100 is trading within a strong bullish structure after bouncing from a well-defined support zone. Price has been respecting key levels on the way up, forming fair value gaps (FVGs) that act as stepping stones for continuation. The overall picture points to a market that is building momentum for a potential liquidity grab higher.
Support Zone & Initial Rally
The chart shows a strong support zone at the lows, which provided the foundation for the current bullish impulse. Once price tapped into this area, buyers stepped in aggressively, leaving behind multiple bullish imbalances on the way up. This confirms that institutional interest is present at these levels.
Fair Value Gaps & Structural Strength
On the rally, price created overlapping FVGs, including a bullish fair value gap and an inversion fair value gap (IFVG). Importantly, candles never closed below the primary FVG — reinforcing its validity as strong demand. This means that even if price retraces, these areas will be closely watched for re-entries.
Liquidity Grab & Next Move
Above current price action lies a clear buy-side liquidity (BSL) level. The market is likely to target this zone, either directly from current levels or after a retest into the stacked FVGs. A liquidity sweep above the highs would be the natural continuation of the bullish structure, unlocking the potential for new short-term highs.
Final Thoughts
The US100 is showing a textbook bullish setup: strong support, healthy retracements, and unmitigated FVGs acting as demand. As long as the lower support holds, the expectation remains for a run into the BSL above.
If this analysis brought value, drop a like — and let me know: are you waiting for the retest, or do you think the market runs the highs straight away?

btc run itEvery correction in Bitcoin bull run is the preparation for a new parabolic rise.
CRYPTOCAP:BTC

TIA ANALYSIS🚀#TIA Analysis : What Next ??💲💲
✅As we can see that there was a formation of Descending Triangle Pattern in #TIA and given a breakout. We are expecting around more than 30% bullish move in coming weeks 📈📈
🔰Current Price: $1.815
🎯 Target Price: $2.081
⚡️What to do ?
👀Keep an eye on #TIA price action. We can trade according to the chart and make some profits. Stay tuned for further analysis and stay updated with market sentiments and news.⚡️⚡️
#TIA #Cryptocurrency #TechnicalAnalysis #DYOR

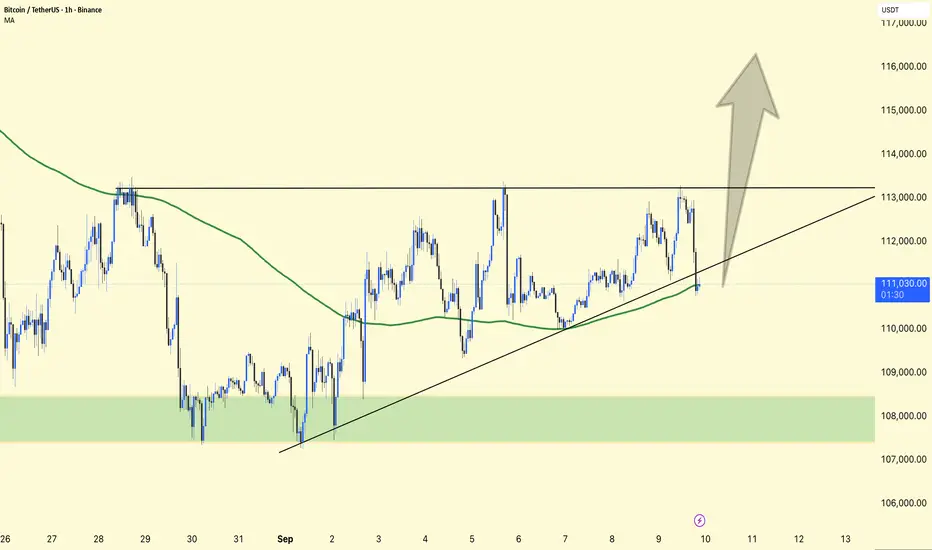
BTCUSDT 1H Chart Analysis !!BTCUSDT 1H Chart Analysis
Current Price
BTC is trading near $111,000, sitting right on top of the trendline support.
The 111K MA (Moving Average) is also aligned here, adding extra strength to this support zone.
Resistance Zone
The most important level above is $113,000.
This has acted as a ceiling multiple times; a clean breakout with volume could send BTC quickly higher.
Bullish Scenario 🚀
If BTC breaks $113K with strength, the next upside targets are:
$115,000 (psychological resistance)
$117,000 (measured move from the ascending structure).
Strong breakout here may trigger short squeezes, fueling momentum.
Bearish Scenario ⚠️
If BTC fails to hold the trendline + MA support, price could drop back into the $109K–108K demand zone (highlighted green box).
Below $108K, downside risk increases sharply.
Market Context
Structure is higher-lows, showing buyers still defending dips.
But BTC is stuck in a range between support ($111K) and resistance ($113K).
BTC is at a decision point.
✅ Break above $113K = bullish continuation toward $115–117K.
❌ Rejection and break below support = pullback into $109–108K demand zone.
BTC weak consolidation....could drop hardTechnicals are not looking good for BTC. Massive drop from 124k and really struggling to make headway above 110k. SMA lines show weakness and moving towards 200SMA, which if broken could lead to the next support line of around 70k.

BTC LOWER LOW INCOMING?On Aug 9th I suggested a breakout pattern that would lead Btc (with the highest probability) to an ideal low around $108K. This was based on a repeating historical Btc pattern I discovered.
That pattern played out as anticipated and on Aug 31st I called the bottom at $107,300 and suggested a "bounce - incoming".
I've held this long since the bottom, but I believe the anticipated bounce may be ending soon. I am anticipating a reversal at the above targets on/or before Sept 18th
With the highest probability, this reversal will lead to a lower low (below $107K).
"IF" Btc holds support above $123K I will switch to a more bullish stance. Until then the stats point downward.
Trade safe and may the trends be with you.

CRVUSDT – Accumulation Breakout Setup After 163% MoveWe nailed a 163%+ move on CRV in the first round — a textbook momentum play. Now, price action is showing signs of breaking out of accumulation, and we’re watching closely for confirmation.
🔍 Key Levels & Setup
Entry Zone: Around $0.80 (support retest)
Breakout Confirmation: Daily close above $0.83
Stop Loss: Daily close below $0.73
Take Profit Targets:
TP1: $0.94
TP2: $1.07
TP3: $1.31

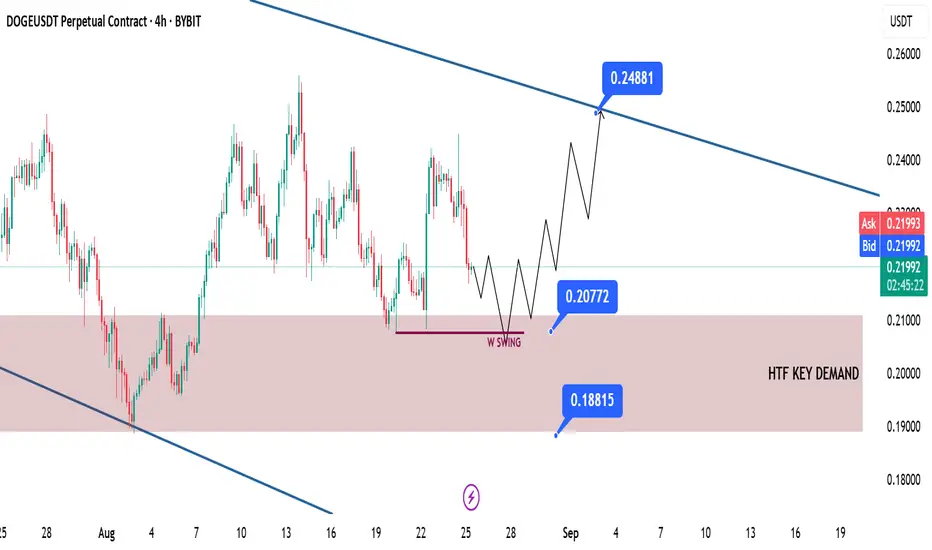
DOGE Swing Long Idea DOGE Game Plan
📊 Market Sentiment
Overall sentiment remains bullish, supported by expectations of a 0.25% rate cut in the upcoming FOMC meeting. A weakening USD and increasing global risk appetite are creating favorable conditions for further upside in crypto assets.
📈 Technical Analysis
Price is retracing towards the HTF Demand zone, which I expect to act as a bounce area.
Moreover, price currently seems to be seeking liquidity to fuel its next bullish move. That liquidity could be the weekly swing low at $0.207.
📌 Game Plan
Wait for price to reach the HTF Demand zone.
Look for price to sweep liquidity and close back above the $0.207 level.
🎯 Setup Trigger
I will be waiting for a 4H market structure shift before entering the trade.
📋 Trade Management
Stoploss: Daily close below HTF support zone — $0.188
Target: $0.248
💬 Like, follow, and comment if you find this setup valuable!
⚠️ Disclaimer: This content is for informational and educational purposes only and does not constitute financial, investment, or trading advice. Always do your own research before making any financial decisions.
1-2-3 Correction coming in BTC?We reached the low of the weekly CR target last week. WIth the new bullish candle of last week, we can expect this week to be bullish as well but the target is shallow; the high of the bearish candle from 2 weeks ago 👀
We expect another selloff from the bearish imbalance range (purple) that will complete the 1-2-3 correction

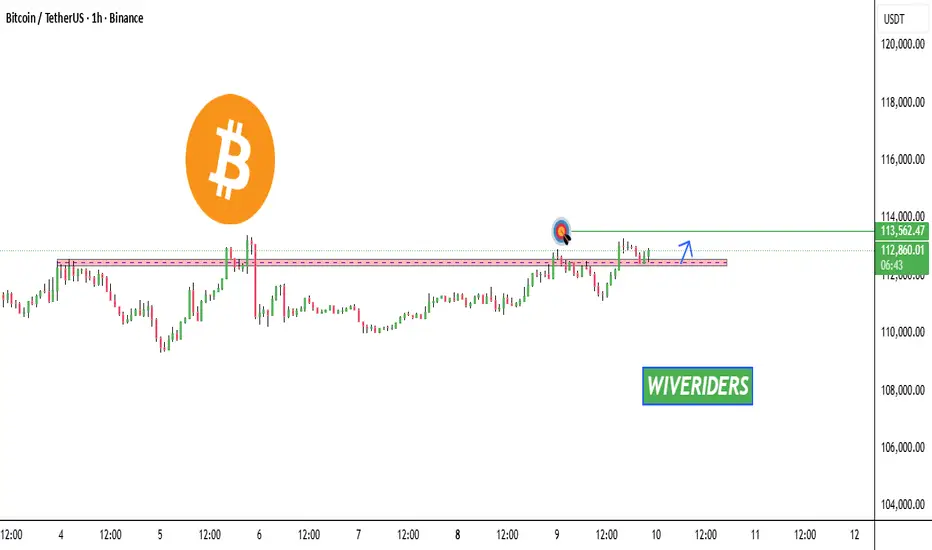
BTC Trading UpdateCRYPTOCAP:BTC Trading Update
CRYPTOCAP:BTC looks to be making a pullback at a past resistance zone. If momentum continues, the first target 🎯 sits around 113,560 USD.
⚠️ Waiting for confirmation before entering is important to avoid false breakouts.
Happy trading ✨
TradeCityPro | Bitcoin Daily Analysis #173👋 Welcome to TradeCity Pro!
Let’s dive into Bitcoin analysis. Today and tomorrow are very important days, and it’s crucial to have the right outlook on Bitcoin. We’ve got some interesting triggers for opening positions that could potentially hit our trading targets for the next few weeks.
⌛️ 4-Hour Timeframe
Bitcoin has been moving upward along a trendline and is now sitting inside a resistance zone. How price reacts to this level is key—it could determine Bitcoin’s next major move.
🔍 If the resistance breaks, an upward rally could begin, as volume has been increasing strongly and the RSI is sitting just below 64.92. That’s an important resistance level, and breaking it could bring fresh momentum into the market.
💥 Rising momentum and strong buying volume are always good signs of a powerful uptrend, and as long as these two factors align with price action, the trend should continue.
⚡️ So, if you already have open positions, you might want to take profits if the price rejects from support and RSI plus volume show divergence with the price move.
✨ If you’re looking to open a new position, the breakout of 113,237 is currently the best trigger for a long entry, provided no divergence appears.
🔽 On the other hand, if price rejects this zone and breaks below the trendline, a short setup could form. However, keep in mind that in the current market, where higher cycles remain bullish, all short positions are risky. Personally, I don’t take shorts in this environment and prefer to stay aligned with the broader uptrend.
📰 Finally, tomorrow we have the U.S. inflation report—one of the most important releases of the month, and it will have a big impact on the market. Be extra careful with your positions, because sharp volatility is highly likely once the data comes out.
❌ Disclaimer ❌
Trading futures is highly risky and dangerous. If you're not an expert, these triggers may not be suitable for you. You should first learn risk and capital management. You can also use the educational content from this channel.
Finally, these triggers reflect my personal opinions on price action, and the market may move completely against this analysis. So, do your own research before opening any position.

BTC 1H Analysis - Key Triggers Ahead | Day 37💀 Hey , how's it going ? Come over here — Satoshi got something for you!
⏰ We’re analyzing BTC on the 1-Hour timeframe.
👀 On the 1H timeframe for Bitcoin, we can see that after breaking the 111,330$ resistance, BTC managed to push higher and is now approaching its next key resistance at 113,000$. This level overlaps with the multi-timeframe range high, making it a critical zone. A clean breakout above this area could drive BTC toward higher price targets.
⚙️ On the RSI, the key zones are around 70 and 50. If momentum pushes past these levels—especially with positive news flow—BTC could enter an overbought phase, fueling further upside.
🕯 Candle structure is showing strength: green candles are getting larger with more volume. At the range high, we’ve seen some red candles forming, reflecting seller absorption. However, each test shows weaker selling pressure compared to the last time BTC hit this level—back then, price dumped sharply within just 2 red candles.
📊 Looking at Tether Dominance (USDT.D) on the 1H, after reacting to 4.45%, it broke lower toward 4.39% and even closed below that level. Right now, it’s retesting 4.39%. If this new support fails, dominance could extend lower toward the next support. A breakdown below 4.37% would be strong confirmation for BTC breaking its range high.
🔔 Trading plan : Bitcoin is currently sitting just below the 113,000$ resistance. Don’t rush into a position here. Ideally, wait for : Another test of this resistance. A confirmed breakout with a pullback/retest of 113,000$. Enter long after the retest for a safer entry.
❤️ Disclaimer : This analysis is purely based on my personal opinion and I only trade if the stated triggers are activated .

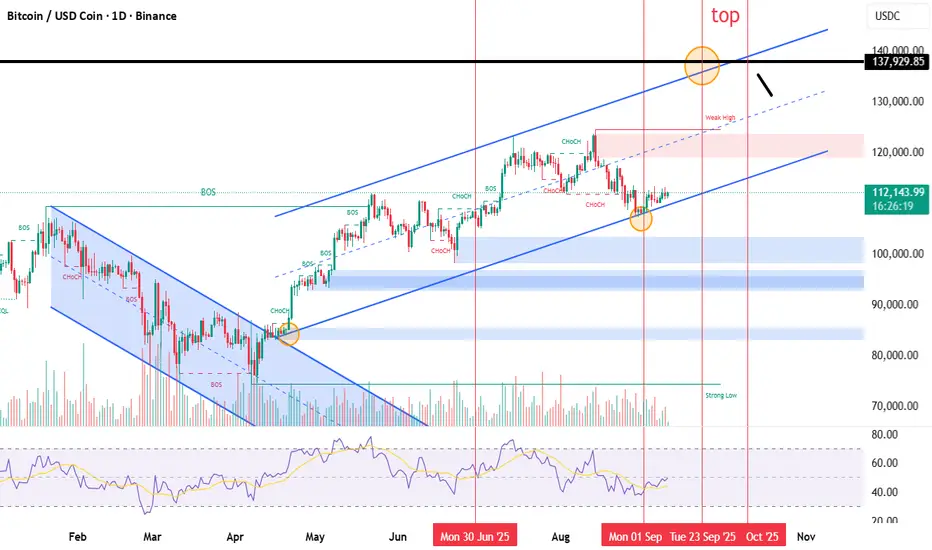
Bitcoin Cycles: History Repeating Itself?Bitcoin has always moved in cycles — a strong impulsive rally 📈 (1), followed by a healthy correction 🔻 (2), then a breakout above the previous high 🔓 (3).
Looking at the chart, the current price action is following this same rhythm once again. After the last correction, BTC bounced strongly, retested previous highs, and is now consolidating before its next potential move.
If this pattern continues to repeat, the next leg could take Bitcoin toward the $140,000 target 🎯 — aligning perfectly with the upper bound of the long-term channel.
👉 The past doesn’t guarantee the future, but BTC’s structure suggests the market might just be writing the same story again.
💬 What’s your bias here? Are you bullish or waiting for a deeper pullback?
📚 Always follow your trading plan regarding entry, risk management, and trade management.
Good luck!
All Strategies Are Good; If Managed Properly!
~Richard Nasr

BTC - Are You Ready?Hello TradingView Family / Fellow Traders. This is Richard, also known as theSignalyst.
📈BTC has been overall bullish trading within the rising wedge pattern marked in red.
This week, BTC has been retesting the lower bound of the channel.
Moreover, the orange zone is a strong strong and previous all-time high.
🏹 Thus, the highlighted blue circle is a strong area to look for buy setups as it is the intersection of the lower red trendline and previous ATH.
📚 As per my trading style:
As #BTC is around the blue circle zone, I will be looking for trend-following bullish reversal setups (like a double bottom pattern, trendline break , and so on...)
📚 Always follow your trading plan regarding entry, risk management, and trade management.
Good luck!
All Strategies Are Good; If Managed Properly!
~Richard Nasr

BTCUSD - Last Daily Run Up BTCUSD I believe has one more left in the tank.
From there it will likely plateau and alts will explode. This idea is supported as BTCD is dropping heavily.
Still bullish but coming to the top.
3 Arrows up are three moves up in a row.
Daily timeframe
