Bitcoin Is Hiding Something BIG (Target Revealed)In Episode 17 of my Bitcoin daily analysis , we just hit a +2.3% gain from the last long trigger, and now BTC is pressing against a critical resistance. If this level breaks with volume, the next +2.7% move could be right around the corner.
In this video, I’ll break Bitcoin down across weekly, daily, and 4H timeframes to show you:
Why this resistance is so important 🔑
How I set my next upside target step by step
The role of volume, BTC dominance, and TOTAL2/TOTAL3 in confirming moves
Whether altcoins (like ETH and SOL) are about to outperform Bitcoin
❌ Don’t FOMO.
✅ Stick to risk management.
✅ Trade your plan, not your emotions.
If you found this analysis helpful, share it with your trading friends and let’s grow smarter together.
BTC-M

BTC/USDT 4hour chart update !! BTC/USDT
Downtrend Channel Broken
Bitcoin was moving inside a descending channel (highlighted).
The price has now broken above the channel, indicating a potential trend reversal from bearish to bullish.
Support Zone
The green area around $107,000 – $108,000 acted as strong demand/support.
BTC bounced sharply from this zone, confirming that buyers stepped in.
50 Red MA (short-term) → Recently crossed above price, but BTC reclaimed it, turning it into support.
200 Green MA (long-term) → Sitting around $114,000, which may act as the next resistance.
Trendline Support
An ascending trendline (black) is holding current price action.
As long as BTC respects this line, the short-term outlook remains bullish.
Resistance: $114,000 (200 MA zone) → first big hurdle.
Higher target: $118,000 – $120,000 if momentum continues.
Support: $110,000 (trendline) and $108,000 (demand zone).
📈 Outlook
Bullish bias as long as BTC holds above $110,000 support/trendline.
A break above $114,000 could trigger a push towards $118K – $120K.
If BTC loses $110K, risk of retesting $107K – $108K support zone.
DYOR | NFA

BTCUSD H1 | Pullback resistance triggering bearish reversalBitcoin (BTC/USD) is rising towards the sell entry of 112,278.38, which is a pullback resistance that aligns with the 61.8% Fibonacci retracement and could reverse from this level to the downside.
Stop loss is at 114,720/58, which is a pullback resistance that aligns with the 138.2% Fibonacci extension.
Take profit is at 109,371.71, which is a pullback support.
High Risk Investment Warning
Trading Forex/CFDs on margin carries a high level of risk and may not be suitable for all investors. Leverage can work against you.
Stratos Markets Limited (tradu.com ):
CFDs are complex instruments and come with a high risk of losing money rapidly due to leverage. 65% of retail investor accounts lose money when trading CFDs with this provider. You should consider whether you understand how CFDs work and whether you can afford to take the high risk of losing your money.
Stratos Europe Ltd (tradu.com ):
CFDs are complex instruments and come with a high risk of losing money rapidly due to leverage. 66% of retail investor accounts lose money when trading CFDs with this provider. You should consider whether you understand how CFDs work and whether you can afford to take the high risk of losing your money.
Stratos Global LLC (tradu.com ):
Losses can exceed deposits.
Please be advised that the information presented on TradingView is provided to Tradu (‘Company’, ‘we’) by a third-party provider (‘TFA Global Pte Ltd’). Please be reminded that you are solely responsible for the trading decisions on your account. There is a very high degree of risk involved in trading. Any information and/or content is intended entirely for research, educational and informational purposes only and does not constitute investment or consultation advice or investment strategy. The information is not tailored to the investment needs of any specific person and therefore does not involve a consideration of any of the investment objectives, financial situation or needs of any viewer that may receive it. Kindly also note that past performance is not a reliable indicator of future results. Actual results may differ materially from those anticipated in forward-looking or past performance statements. We assume no liability as to the accuracy or completeness of any of the information and/or content provided herein and the Company cannot be held responsible for any omission, mistake nor for any loss or damage including without limitation to any loss of profit which may arise from reliance on any information supplied by TFA Global Pte Ltd.
The speaker(s) is neither an employee, agent nor representative of Tradu and is therefore acting independently. The opinions given are their own, constitute general market commentary, and do not constitute the opinion or advice of Tradu or any form of personal or investment advice. Tradu neither endorses nor guarantees offerings of third-party speakers, nor is Tradu responsible for the content, veracity or opinions of third-party speakers, presenters or participants.

Bearish reversal?The Bitcoin (BTC/USD) is reacting off the pivot which is a pullback resistance and could drop to the 1st support.
Pivot: 112,817.18
1st Support: 104,329.52
1st Resistance: 117,395.83
Disclaimer:
The above opinions given constitute general market commentary, and do not constitute the opinion or advice of IC Markets or any form of personal or investment advice.
Any opinions, news, research, analyses, prices, other information, or links to third-party sites contained on this website are provided on an "as-is" basis, are intended only to be informative, is not an advice nor a recommendation, nor research, or a record of our trading prices, or an offer of, or solicitation for a transaction in any financial instrument and thus should not be treated as such. The information provided does not involve any specific investment objectives, financial situation and needs of any specific person who may receive it. Please be aware, that past performance is not a reliable indicator of future performance and/or results. Past Performance or Forward-looking scenarios based upon the reasonable beliefs of the third-party provider are not a guarantee of future performance. Actual results may differ materially from those anticipated in forward-looking or past performance statements. IC Markets makes no representation or warranty and assumes no liability as to the accuracy or completeness of the information provided, nor any loss arising from any investment based on a recommendation, forecast or any information supplied by any third-party.

XAUUSD - Daily | The breakout is REALSimple trading - Triangle pattern
Gold is back to making All-Time highs. Reaching as high as 3600. You can see the breakout was fast and instant. In less than 2 weeks, gold managed to move the price over 1500 pips.
The target of the triangle breakout is nearly reached. Roughly 3675.
Gold has already tested support that was previously a bullish daily FVG. With clean rejection, we see the price remaining bullish.

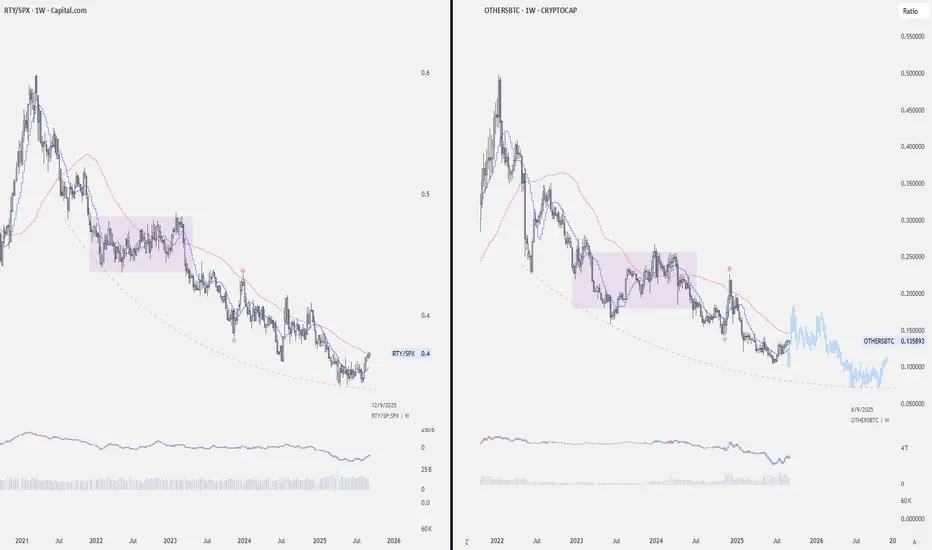
RTY/SPX vs OTHERS/BTCRTY (Russell 2000) - U.S. small-caps
SPX (S\&P 500) - U.S. large-caps
OTHERSBTC represents the ratio of the total market capitalization of all cryptocurrencies excluding the top 10 (commonly smaller-alt or “other” coins) relative to Bitcoin’s market cap.
Right now, RTY/SPX is retesting its yearly rVWAP with a pretty clean bottoming structure. If OTHERSBTC follows the same script, it could retest the 0.18–0.20 zone before one more leg down, and then set up for a move higher
Definitely worth keeping on watch.
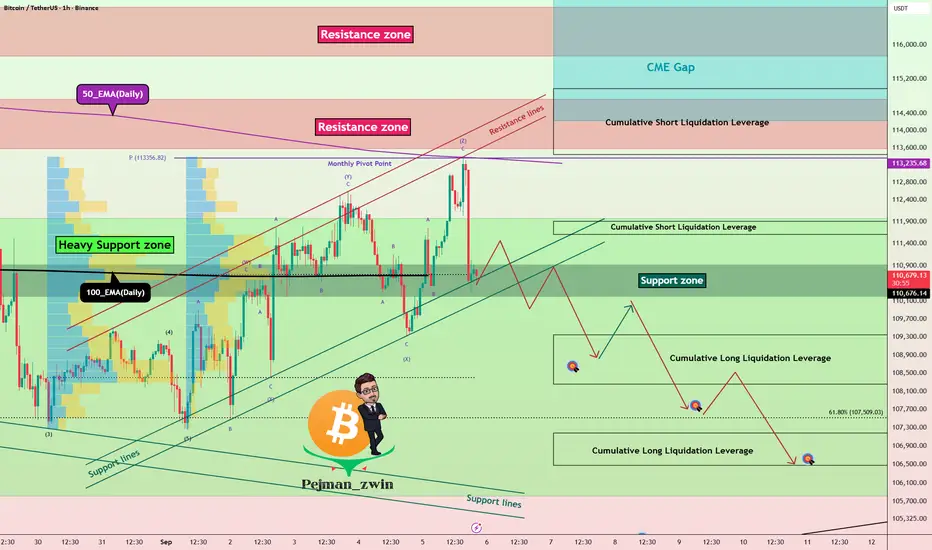
Bitcoin Roadmap – Breakdown Toward $107K or Bounce?Bitcoin ( BINANCE:BTCUSDT ) has been moving with high momentum this week , with the US indexes and Gold ( OANDA:XAUUSD ) bullish .
Bitcoin is currently trying to break the Support lines , Support zone($110,920-$110,200) and 100_EMA(Daily) .
In terms of Elliott Wave theory , it seems that the waves that Bitcoin has made this week have been in the form of a Triple Three Correction(WXYXZ) .
I expect Bitcoin to decline to at least $109,133(First Target) AFTER the Supports are broken.
Second Target: $107,740
Third Target: $106,660
Stop Loss(SL): $114,108(Worst)
Note: As I said at the beginning of this analysis, the financial markets have been a bit emotional and sudden with their movements this week, so always be prepared for any scenario and pay more attention to capital management.
Note: Generally, trading volume is low on Saturdays and Sundays. Perhaps it is a bit far-fetched to expect a break of the Heavy Support zone($111,980-$105,820) during the weekend. What do you think?
Cumulative Short Liquidation Leverage: $114,976-$113,440
Cumulative Short Liquidation Leverage: $111,907-$111,607
Cumulative Long Liquidation Leverage: $109,346-$108,259
Cumulative Long Liquidation Leverage: $107,181-$106,479
CME Gap: $117,235-$113,800
Please respect each other's ideas and express them politely if you agree or disagree.
Bitcoin Analysis (BTCUSDT), 1-hour time frame.
Be sure to follow the updated ideas.
Do not forget to put a Stop loss for your positions (For every position you want to open).
Please follow your strategy and updates; this is just my Idea, and I will gladly see your ideas in this post.
Please do not forget the ✅' like '✅ button 🙏😊 & Share it with your friends; thanks, and Trade safe.

BRIEFING Week #36 : Oil Prices Diverge from RealityHere's your weekly update ! Brought to you each weekend with years of track-record history..
Don't forget to hit the like/follow button if you feel like this post deserves it ;)
That's the best way to support me and help pushing this content to other users.
Kindly,
Phil

BTC Bounce Incoming! Buy the Dip Before It Soars!
🚨 **BTC Dip-Buy Alert! 💎🚀**
**Buy the dip, ride the bounce!**
**📊 Market Bias:**
* Short-term: 🟡 Mildly Bearish / Neutral (price < SMA20/50, 1H/4H mixed)
* Medium-to-long-term: 🟢 Bullish (price > SMA200; key support 101,640–106,900)
* Strategy: Controlled **mean-reversion long** from lower BB → mid/upper BB
**💵 Trade Setup (Enter at Open):**
* **Direction:** LONG
* **Entry Range:** 109,800 – 110,500 (Ref: 110,080)
* **Stop Loss:** 106,900 (hard stop, optional widen to 106,500)
**🏹 Take Profit / Tiered Exits:**
* **TP1 (30%):** 111,786 ⚡ (SMA20 / BB mid)
* **TP2 (50%):** 116,672 🟢 (BB upper / primary target)
* **TP3 (20%):** 120,000 🚀 (extension if momentum resumes)
**💡 Position Sizing Example:**
* Risk 1% of account → For \$100k: \~0.314 BTC
* Max Risk: 1–2% portfolio
* Leverage: 3–5x if using margin; avoid >10x
**📈 Confidence:** 59% ✅ (moderate, controlled risk)
**⚠️ Key Risks:**
* Daily close <106,900 or break under SMA200 (101,640) → bearish flip
* Macro shock, DXY surge, or equity sell-offs may override technicals
* Missing Open Interest data → possible crowding/liquidation risk
* Rapid funding spikes / large OI → potential short squeeze
**💎 Trade Rationale:**
* Price in corrective pullback inside long-term bull (above SMA200)
* MACD histogram improving 📊
* RSI leaves room for mean-reversion
* Favorable risk/reward from lower BB → BB upper (\~116.7k)
**⚡ Execution Notes:**
* Enter at market open
* Use tiered TPs
* Strict stop & position sizing
---
📊 **TRADE DETAILS**
🎯 Instrument: BTC
📈 Direction: LONG
💰 Entry Price: 110,080
🛑 Stop Loss: 106,900
📊 Size: 0.314 BTC
💪 Confidence: 59%
⏰ Entry Timing: market\_open
🕒 Signal Time: 2025-09-07

BTC 1H Analysis - Key Triggers Ahead | Day 35💀 Hey , how's it going ? Come over here — Satoshi got something for you !
⏰ We’re analyzing BTC on the 1-Hour timeframe .
👀 On the 1-hour timeframe for Bitcoin, we can see that after touching its resistance at $111,300, Bitcoin moved toward its short alarm zone and activated it. However, the market didn’t show much selling pressure or bearish momentum. Currently, Bitcoin is ranging with very low volume, but with the new week starting, stronger volume could enter the market.
⚙️ Key RSI levels for Bitcoin are at 70 and 50. If RSI crosses these thresholds, Bitcoin could start a strong move — most likely at the beginning of the new week.
🕯 The size and number of green candles have slightly increased, and we are now sitting right below the critical resistance at $111,300. It’s likely that this level will be broken in the coming week.
🖥 This week has plenty of economic news events, which means the market could see high volatility. Overall, it looks like a good week for trading.
📊 Looking at the 1-hour timeframe of Tether dominance (USDT.D), after a strong rally it recently got rejected from the 4.51% level. The market sentiment shifted toward long positions, and selling pressure didn’t sustain. If 4.45% in Tether dominance breaks down, significant USDT could flow into Bitcoin and altcoins.
🔔 The key alarm zones for Bitcoin are set at $110,500 for short positions and $111,300 for long positions. Breaking these zones in the upcoming week could give us solid trade opportunities. Keep in mind that the economic news scheduled this week can strongly influence the market.
❤️ Disclaimer : This analysis is purely based on my personal opinion and I only trade if the stated triggers are activated .

#Bitcoin Sunday Update#Bitcoin Sunday Update 📉
I’m still holding my short from the past 20 days. CRYPTOCAP:BTC is stuck near $111K, trading weak below the 50MA, and the structure remains bearish. If we get a CPI-driven spike into 115K–120K, I’ll look to add more short positions.
📌 Downside Targets:
105K → 100K → 95K → 90K

TradeCityPro | Bitcoin Daily Analysis #171👋 Welcome to TradersCity Pro!
Let’s move on to Bitcoin analysis. Yesterday, Bitcoin continued ranging. Let’s see what triggers the market gives us today.
⌛️ 1-hour timeframe
Yesterday, after Bitcoin’s volume dropped to the lowest possible level, the market made a downward move and faked around the 110473 zone, and now it’s back inside the box again.
📊 The top of the box is at the 111654 zone, and if it breaks, the price can move toward the 113233 zone.
✔️ I still believe volume is very important, and as long as no significant volume comes in, the market won’t move. Even if it does, like yesterday’s drop, the chance of it being fake is very low.
📉 For a short position, we can enter with the 110473 trigger, but in my opinion, considering the higher cycles, it’s still not logical to open shorts. However, if buying volume enters, we can enter a long position with the long triggers we have.
🔔 In market conditions like this, when the volume is so low, one thing that really helps avoid unnecessary stop-losses is to avoid opening positions for a while and miss the first leg of the next price move.
⚡️ In this case, it’s true that we miss one leg that could have given us a risk-to-reward opportunity, but on the other hand, it prevents us from getting stopped out inside the ranging box. It also keeps our mind free from open trades so we can open new positions in the next legs, which are more reliable and have a higher win rate.
❌ Disclaimer ❌
Trading futures is highly risky and dangerous. If you're not an expert, these triggers may not be suitable for you. You should first learn risk and capital management. You can also use the educational content from this channel.
Finally, these triggers reflect my personal opinions on price action, and the market may move completely against this analysis. So, do your own research before opening any position.

SUN/USDT ENTERING INTO IMPORTANT INCREASE BOXthere’s a good chance we could see SUN/USDT increase in the coming timeframes, as an important TA cross signals a potential new trend breakout. However, this will depend on the data
Reason of follow is the high chance of break.

Counter-Pattern BTC Idea. Sell @ 113.5KMorning folks,
So, our plan stands in progress, everything is fine, while market is moving with 3-Drive pattern to the upside. It's time to decide what to do next.
BTC will remain under pressure until the mid September, due to big Treasury borrowings. At the same time we see that it is forming reverse H&S pattern, which is potentially bullish. Our idea is to go against it with the most safe way and Sell at the neckline and K-resistance area of 113.5K level.
Because we think that this H&S has more chances to fail rather than to work properly. But, anyway, if even it will work as it should, the right arm deep should let us to move stops to breakeven. So, we think that this trade scenario cares not much risk

Bitcoin (BTCUSDT) –> Double Top Playing OutHello guys!
On the 4H chart, Bitcoin has completed a double top formation. After failing to break above the 122,000 zone twice, the price rolled over and eventually broke below the neckline support.
Currently, BTC is pulling back toward the broken neckline area (112,000–113,000). This level may now act as resistance, setting up a bearish retest before continuation lower.
Key Technical Points
Double Top: Confirmed by two failed attempts to push higher.
Broken Neckline: Now turned into resistance.
Target of the Pattern: Based on the structure, the projected move points toward 105,000–105,500, which also aligns with a strong demand zone.
Scenario
If price rejects at the neckline retest, we can expect a move down toward the 105K region . A sustained break below 105K could accelerate bearish momentum, while reclaiming 113K would invalidate the pattern.
📌 Bias: Bearish below 113K, looking for continuation toward 105K.

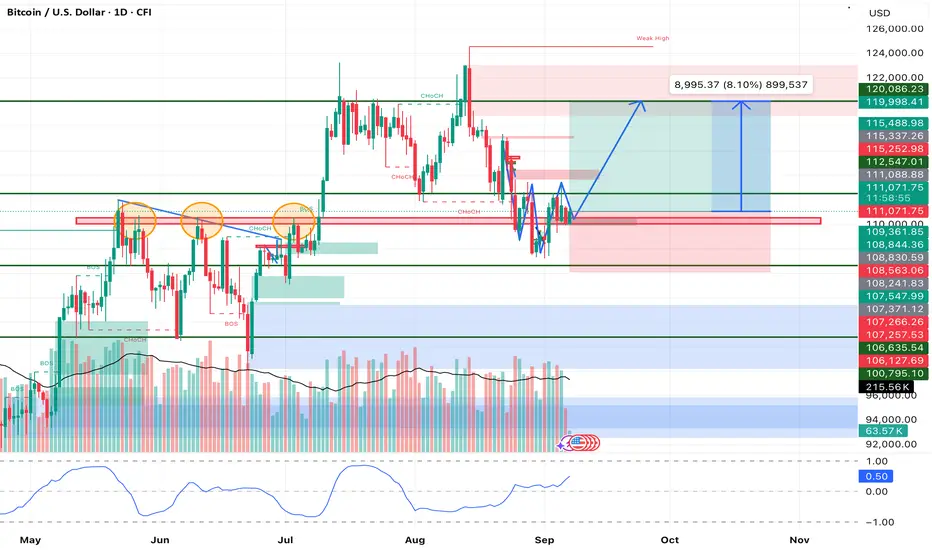
BTC/USD Long Setup – Defending $111K Support for a Push Upward⚡ Bitcoin bulls are stepping back in at a critical level!
After a sharp correction, BTC has successfully defended the $111K–$112K demand zone 🛡️, which has acted as a strong liquidity pocket in recent weeks. This reaction could be the base for a renewed bullish push targeting the liquidity resting above $120K 🎯.
Here’s the breakdown of my analysis 👇
📌 Market Structure
• Price swept liquidity below $111K before bouncing, creating a higher-low formation 🔑.
• Structure remains bullish as long as the $111K level holds.
• A clean break above $115.5K–$116K resistance ⚔️ will confirm continuation.
📌 Volume Profile
• Increasing buy volume 📊 indicates demand absorption after the correction.
• Smart money positioning suggests accumulation in this range.
📌 Key Levels
• Entry Zone: $111K–$112.5K 🟢
• Stop Loss: $106.6K ❌ (below the invalidation level)
• Target: $120,086 🎯 (8.1% upside move toward the weak high)
📌 Risk Management
• Risk/Reward ratio sits at ~1:1.8 ⚖️, balancing protection and upside potential.
• This setup invalidates ⛔ if BTC closes decisively below $111K support.
⸻
✅ Trade Idea Summary
• Bias: Long BTC/USD
• Setup: Higher-low confirmation at demand zone
• Target: $120K 🎯
• Stop: $106.6K ❌
• R/R: ~1:1.8 ⚖️
Conclusion:
Bitcoin’s rejection of $111K support shows that buyers are still in control 🐂. As long as this level is defended, the path of least resistance points upward 🚀. I expect BTC to test the $115.5K–$116K resistance, and if broken, momentum could carry price toward $120K+ liquidity.
BTC - Bullish continuation in the makingMarket Context
BTC has recently broken out of a long-standing descending trendline, marking a significant shift in sentiment. This breakout signals the end of the controlled downtrend and sets the stage for a possible bullish continuation. At the same time, the chart shows a clear sweep of sell-side liquidity at the lows, which often serves as the fuel for a reversal.
Trendline Breakout & Liquidity Sweep
The bullish breakout of the old upper trendline is an important technical event. Combined with the earlier sell-side liquidity sweep, this suggests that downside liquidity has been cleared and that the path of least resistance could now be higher. Such a combination often marks the start of a new leg in the trend.
Market Structure Shift Retest
Following the breakout, price has pushed higher and printed a market structure shift (MSS). The current retest of this MSS zone will be key — if it holds, it provides the ideal spot for bulls to reload positions. This retest acts as confirmation that the breakout is valid, not just a short-lived deviation.
Next Liquidity Grab & Upside Targets
Above the current range sits a clear buy-side liquidity pool. The next logical move would be a grab of that liquidity, which could extend into a more aggressive bullish expansion toward higher levels. The structure suggests a stair-step move higher: liquidity grab, retest, and then continuation toward 115k–117k zones.
Final Thoughts
The sell-side liquidity sweep, trendline breakout, and market structure shift all point to a bullish shift in momentum. The key lies in how price reacts to the retest — hold it, and the next liquidity levels are likely to be taken.
If this breakdown helped clarify the setup, a like is much appreciated — and let me know in the comments: are you playing the retest, or waiting for the liquidity grab above?

bitcoin 2017 vs. 2025Bitcoin Same rhythm, same feelings.
History is repeating itself, the trend is still strong.
CRYPTOCAP:BTC

BTC's Situation, A Comprehensive Analysis !!!As you can see, after breaking the bearish wedge, the price dropped sharply. The question is, how far will this price decline continue? In my opinion, the price could remain bearish until the PRZ (Potential Reversal Zone), which is around the 107500 level. After that, an increase in buying pressure could lead to a price rise to higher levels.

BITCOIN → Sale on positive news? What to expect? 100K or 130K?BINANCE:BTCUSDT.P unsuccessfully ended another attempt to break through the 112K-113K zone. The positive background (NFP) did not affect the price, and a bearish setup formed on D1...
D1 is forming a pin-bar relative to the strong resistance zone of 112K - 113K, positive news is quickly sold off, and the price, rebounding from the resistance of the trading range, closes near the bearish trigger of 110500. Bitcoin looks quite uncertain as it faces selling pressure in the 112K-113K zone. The price cannot consolidate above this area despite the previously broken correction resistance. There is logic in this maneuver... The market is betting on a more than 90% chance of interest rate cuts, and by that point, the price of Bitcoin may fall to the maximum permissible limits before further growth. Areas of interest may be 107K - 105K - 100K
Resistance levels: 111.9K, 113.3K, 117K
Support levels: 110.5K, 107.4K, 105.0K
A breakdown of the 110.5K support could trigger further sell-offs towards the support of the key trading range. Within the current downward cycle, the price may well test 105,000, which is a fairly strong liquidity zone. The fundamental background is positive, and the current sell-off may be manipulative movement before the emergence of a bullish driver...
Best regards, R. Linda!

get readyget ready says btc
have you seen crossovers - up and down
not the ema crossing another ema
or sma crossing another sma
i'm talking about ema crossing its own sma
i've never seen checking or using these type of crossover analysis
here you will see that ema 50 crossing down sma 50 ( dotted orange crossed down blue )
as similar ema 100 crossing down sma 100 ( dotted red crossing down red )
now the ema 50 about to cross down sma 100
can you see that?
here we used 50, 100, 200 & 365
check it out & try it out !!

We took short on BTC at 113k We took short on BTC at 113k
why we did it?
price is in dawnward structure
rejected from vwap several times with volume spike
