The Anatomy of a Bottom. Why the $60k Breakdown Isn't the EndGreetings, everyone.
Today, we are going to perform a deep dive into the most critical process in any market: the formation of a bottom. I want to share with you not just patterns, but the very psychology and mechanics of a reversal, a subject I have been studying and honing since 2019. For my trading style, where the goal is to find an entry with minimal stop-loss and maximum profit potential, understanding formation of the bottom and top.
Part 1: The Physics of the Market. Why Instant Reversals Don't Happen.
The first and most important rule that needs to be carved in granite is this: in an established market, especially for a multi-trillion dollar asset like Bitcoin, there is no such thing as a quick recovery after a prolonged decline.
The market is not a rubber ball. It is a massive mechanism that obeys the laws of inertia. Every phase—accumulation, growth, distribution—requires time. Big capital needs a wide price range and months to accumulate or distribute a position without creating anomalous movements. Liquidity in the crypto market is fragmented; it's spread across dozens of exchanges, and moving large funds onto a CEX is a risk in itself. All of this slows the process down.
Therefore, the market always moves according to the same pattern: Impulse -> Correction (Sideways) -> Impulse . We cannot skip the phase of a long, grueling sideways correction. And we are entering exactly such a phase right now.
Part 2: The $60k Breakdown. A Cold-Blooded Hunt and the "First Leg" of the Bottom.
Let's break down the recent drop. They will tell you fairy tales about an erroneous transfer on Bithumb. Let's leave those fairy tales to the storytellers who look for simple explanations.
In reality, what happened was a cold-blooded, calculated hunt for liquidity. The $64-66k zone was an obvious magnet.
The market always moves from one liquidity pool to another, and this was the largest one. Exchanges and the biggest manipulators earn from liquidations. Without any news, without any apparent reason, they came to the exact point where the maximum pain for long positions was concentrated, and they took their money. You saw the tears on Twitter. This is normal. This is market mechanics.
I stopped asking "why did this happen?" long ago. You can invent any explanation in hindsight. The fact is, someone was pushing buttons. I will not mince words: with this move, we have established the " first leg " of our future bottom. We have marked the first critical point from which the entire future formation will be built.
Part 3: The Architecture of a Bottom. What It Actually Looks Like.
A bottom is a complex structure. Here is the most common scenario I have observed over the years:
The "First Leg" Forms: A sharp drop occurs ( like the one we just had ), establishing the first significant low.
The Deceptive Recovery: A slow bounce begins. It gives the market false hope for a V-shaped recovery.
The Return and "Support" Illusion: The price slowly drifts back down to the level of the first low. This level starts to look like rock-solid support. Everyone sees it, everyone buys from it.
The Final Act: The Liquidation Sweep. Below this obvious support line, liquidity accumulates for weeks—the stop-losses of the buyers. When enough has gathered, a sharp, final move down occurs. It breaks the "support," collects all the stops, and only after this final capitulation does the true reversal begin.
We saw variations of this in 2024, in the
73k−49k range, where a series of lower lows transitioned into a long, grueling sideways market.
And we saw it in the great bear market of 2021-2022—a series of deadly downward impulses, interrupted by corrections that systematically killed off any hope.
In this post, I didn't say anything about the accumulation and distribution of Wyckoff.
But the last time I posted about it, I was told I didn't understand anything about it—okay.
Part 4: My Plan and a Warning to the "Gods of the Market".
I want to speak directly to those whose limit order was luckily filled at $60,000. If you think you've caught lightning in a bottle and become a god of this market, I want to warn you: the market brutally punishes such overconfident people.
One successful trade is not a system. We are in a global bear market, which is exacerbated by external factors. US indices and gold are at all-time highs. The geopolitical cards of Taiwan and the Middle East have not yet been fully played. The market dislikes instability, and in such times, capital flees from the highest-risk assets. And cryptocurrency is asset number one on that list.
My personal timing has not changed: I believe the complete formation of the bottom and my position accumulation phase will conclude by September 2026.
Since 2022, I have, and I don't say this lightly, identified the key tops and bottoms of this market with 90% accuracy
proof in the links:
This isn't magic. It's an approach based on an understanding of timing and market cycles. I have dropped hints about this system in my posts since 2017, but the full, structured methodology is something I share only in my Academy.
Welcome.
Best Regards, Your EXCAVO.
BTC-S

BITCOIN always leads stocks when Bear Cycles happen. This time??Bitcoin (BTCUSD) completed a more than -50% drop last week from its October 2025 All Time High (ATH) while stocks stayed close to their ATH. This chart shows that while BTC is obviously on a Bear Cycle, the S&P500 (SPX) illustrated by the blue trend-line, is still on Bull Cycle territory.
So why this huge divergence between BTC and stocks. Well looking at it historically, this is not uncommon. During the 2022 Bear Cycle, Bitcoin had to crash by more than -40% before the stock market started its own correction, while in 2018 Bitcoin again crashed by more than -50% before the SPX started a Bear Cycle.
This is very logical from a long-term investing standpoint as investors seek first to liquidate the massive profits on riskier assets like Bitcoin, add some remaining capital on stocks and then when the stock market shows signs of a long-term correction, withdraw their funds from there as well. This is usually when the USD takes off as they convert stocks to dollars and choose to weather out the storm primarily in cash (others might choose precious metals).
In any event, this analysis shows that since Bitcoin is already down by more than -50% from its historic High, we might be seeing a Bear Cycle starting on the S&P500 as well.
Do you agree with that? Feel free to let us know in the comments section below!
---
** Please LIKE 👍, FOLLOW ✅, SHARE 🙌 and COMMENT ✍ if you enjoy this idea! Also share your ideas and charts in the comments section below! This is best way to keep it relevant, support us, keep the content here free and allow the idea to reach as many people as possible. **
---
💸💸💸💸💸💸
👇 👇 👇 👇 👇 👇

SOLUSD (2H) chart pattern...SOLUSD (2H) chart pattern.
Market Structure
Strong overall downtrend (lower highs + lower lows).
Price is below the descending trendline.
Current price is consolidating inside a supply / resistance zone (red box).
Ichimoku cloud is above price → bearish pressure intact.
Bias = SELL continuation unless trendline is broken strongly.
🎯 Sell Targets (Primary Scenario) 🔴
Target 1 (TP1)
➡ 82.0 – 80.0
Recent demand
First liquidity pool
Target 2 (TP2)
➡ 75.5 – 74.0
Previous strong rejection area
Matches my marked TARGET POINT
Extended Target (If momentum is strong)
➡ 70.0 – 68.0
❌ Invalidation
A clean 2H close above 92.5–94.0
Break & hold above trendline + cloud = bearish idea fails
📌 Trade Plan Idea
Sell zone: 90.0 – 92.0
SL: Above 95.0
TPs: 82 → 75 → 70
Summary
✅ Trend intact
✅ Supply respected
⚠️ Wait for rejection candle for safest entry

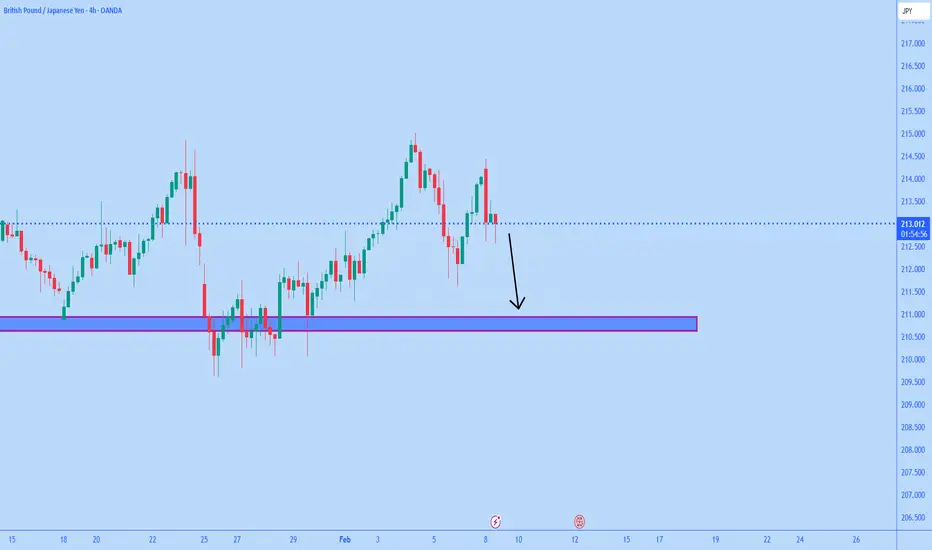
GBPJPY DroppingGBPJPY on the H4 timeframe is showing a clear corrective structure after a strong impulsive move, with price rejecting from a recent swing high and rolling over toward a well-defined demand and liquidity zone that previously acted as a strong institutional reaction area. The current market behavior reflects weakening bullish momentum, failed continuation highs, and increasing selling pressure, which supports a controlled pullback toward equilibrium before the next directional decision. Fundamentally, GBP remains exposed to slowing UK economic momentum, cautious Bank of England guidance, and sensitivity to inflation and labor data, while JPY continues to gain underlying strength from Bank of Japan policy normalization, tighter yield differentials, and persistent safe-haven demand during risk-off sentiment. With liquidity resting below current price, volatility expansion visible, and smart money positioning favoring a retracement, the technical structure and macro backdrop align for further downside into demand, where a high-probability reaction or deeper continuation will define the next profitable opportunity.
Bitcoin Cycle Déjà Vu? Phase 4 Has Arrived!Bitcoin doesn’t move randomly.
It repeats behavior; just at different prices.
When you zoom out and compare the previous cycle to the current one, the structure is almost identical.
Let’s break it down 👇
📈 Phase 1: Higher High
Both cycles started the same way.
A strong bullish expansion that convinced everyone the trend would last forever.
🐂 Momentum was strong. Sentiment was euphoric.
🔻 Phase 2: Structural Break
After the higher high, price failed to continue.
Support zones broke. Momentum shifted.
🧱 Phase 3: Weekly Low Reaction
In both cycles, Bitcoin found a major weekly low.
Buyers stepped in. Hope returned.
This is where most traders got confused... thinking the worst was over.
⏸️ Phase 4: Range
This is where we are now.
Price is no longer trending.
It’s digesting the prior move inside a wide range.
Volatility increases. Direction disappears.
Traders get chopped. Investors get tested.
This phase is not about speed, it’s about patience.
💡 Key Insight
Phase 4 is not bearish.
But it’s also not bullish.
It’s a transition phase... where weak hands exit, strong hands accumulate, and the next big move is quietly prepared.
The same movie.
Different year. Different price.
🤔 Question:
Do you think this range resolves the same way as the last cycle… or does Bitcoin surprise everyone this time?
⚠️ Disclaimer: This is not financial advice. Always do your own research and manage risk properly.
📚 Stick to your trading plan regarding entries, risk, and management.
Good luck! 🍀
All Strategies Are Good; If Managed Properly!
~Richard Nasr

SILVER (XAGUSD) – 1H CHART PATTERN)...SILVER (XAGUSD) – 1H CHART PATTERN).
Bias: Bullish
(Descending trendline breakout + higher lows)
Buy Zone:
🔹 80.00 – 78.70
Targets:
🎯 TP1: 84.00 – 85.00
🎯 TP2: 92.00 – 96.00
🎯 TP3 (Main Target): 118.00 – 120.00 🚀
Stop Loss:
❌ Below 76.50
Notes:
Strong rejection from demand zone
Trendline breakout confirmed
Price holding above Ichimoku cloud = bullish continuation
Book partial profit at TP1, move SL to breakeven

Bitcoin - good healfy Up trend - need long accumulationBitcoin - good healfy Up trend - need long accumulation
in this video i shared my local idea fro next weeks and algo global view

BITCOIN - From the DISTRIBUTION phase to the CONSOLIDATION phaseBINANCE:BTCUSDT.P tested 60K during the current cycle and formed a fairly significant pullback to 70K. However, it is too early to talk about a bullish trend; this is just a reaction to liquidation. The cycle continues...
At the moment, the decline is 52%, which is historically within acceptable limits and is a relatively average indicator.
Fundamentally, there is no support for the crypto market, and Friday's pullback was supported by the recovery of the US stock market.
Global and local trends are bearish, and local spikes in volume and bullish impulses are possible in the hunt for liquidity, which should be viewed conservatively.
The price has entered the key trading channel of 53K - 73K and is likely to stop within the current cycle and form another trading range, which may subsequently reinforce the reversal momentum. Key liquidity zones have not yet been tested: 59650 - 53330.
Resistance levels: 71,900, 73,800, 82,200
Support levels: 65,000, 59,650, 53,330
How can we tell that the market is ready to reverse? Technically, the reversal phase does not come immediately after distribution, the cycle of which is still ongoing. The market must enter a consolidation phase with the gradual formation of sequentially rising lows/highs. The breakdown of local structures + the market holding above key resistance levels will hint at a positive market sentiment.
Thus, we are waiting for the formation of an intermediate bottom and a change in the market phase from distributive to consolidation...
Best regards, R. Linda!

TradeCityPro | Bitcoin Daily Analysis #262Welcome to TradeCity Pro!
Let’s move on to Bitcoin analysis. After the recent sharp drop, the market is now going through an upward corrective move.
1-Hour Timeframe
After Bitcoin’s bearish move down to the 62,824 support, it entered a corrective phase and has so far retraced up to 71,670.
During this correction, volume has decreased, which confirms the strength of the bearish trend. Now, as a new bearish leg appears to be starting, selling volume is increasing again, further supporting the continuation of the downtrend.
At the moment, the short trigger we have on Bitcoin is 67,735. This trigger remains valid as long as price does not stabilize above 71,670, and we can open a short position on a clean break of this level.
The main short trigger is still the break of 62,824. That said, in my view, if price continues lower, it will likely react to another low and form a new structure before moving further down—but for now, 62,824 remains our key trigger.
For long positions, we have a very risky trigger at the break of 71,670. This setup is only worth considering if buying volume starts to increase, and even then, it should be taken with minimal risk.
The main long trigger will only be confirmed after a trend change on higher timeframes, such as the 4-hour and daily charts.
❌ Disclaimer ❌
Trading futures is highly risky and dangerous. If you're not an expert, these triggers may not be suitable for you. You should first learn risk and capital management. You can also use the educational content from this channel.
Finally, these triggers reflect my personal opinions on price action, and the market may move completely against this analysis. So, do your own research before opening any position.

GBPUSD –2CHART PATTERN)...GBPUSD –2CHART PATTERN).
Bias: Bullish retracement / reversal 📈
(Fall completed → higher lows forming + trendline pressure)
Buy Zone:
🔹 1.3560 – 1.3520
Targets:
🎯 TP1: 1.3620 – 1.3650
🎯 TP2: 1.3720 – 1.3750
🎯 TP3 (Main Target): 1.3880 – 1.3950 🚀
Stop Loss:
❌ Below 1.3470
Notes:
Strong bounce from demand zone
Corrective move toward descending trendline
Partial profit at TP1 recommended, trail SL after TP1

Bitcoin: Bullish Reversal Setup 80K From Here.Bitcoin 4 hour setting up for a long swing trade. Broader structure is bearish and this is now a confirmed broad Wave 2 (I talked about this possibility for months). This means while price is attempting to retrace, the bigger picture now favors a test of the 59K low, and potentially a test of the lower 50Ks. This is what CHART structure says BUT this can CHANGE VERY QUICKLY based on how the fundamental outlook unfolds over the coming weeks, months.
Short term, a bullish retrace is developing and profit objectives around 73K, 80K are within reason. The more aggressive way to justify risk is WAITING for a retrace into the order block or "demand" zone based on the 4 hour time frame. IF the higher low confirms, risk is relatively low (can be defined by the 60K whole number area) while first reward objective is 70 to 73K region.
The more conservative route is to WAIT for liquidity breaches or price break outs at the "lower high" levels on the chart (break out strategy). 80K, 84K and 90K areas are all bullish confirmations that if compromised, increase the likelihood of a retest of the 95K to 100K area. Again to drive this kind of momentum, there has to be a fundamental catalyst or series of catalysts to help propel such a move. So what can this look like?
We need more weak employment numbers to change the FED's position from no likely rate cut, to pricing a rate cut at next meeting, this would be a good start. NFP was moved to this Wednesday because of backlog at Bureau of Labor Statistics (what's going on here!?). Another area to watch is 10 Year note Yield which has been moving the wrong way. One factor that is aligned is the Manufacturing PMI which servers as a proxy of global liquidity. This number produced a positive print, but not enough to change the short term perception.
Also keep an eye on the the new Fed Chairman nominee Warsh. He is perceived as "bad" for Bitcoin because of his philosophy of shrinking Fed balance sheet which is a negative for global liquidity which Bitcoin and alts depend on. In my opinion he is a trojan horse. Why would he be nominated if he is going to be even more defiant than Powell?
In summary: Short term bullish reversal likely but confirmation required. Keep bullish expectations limited until broader structure changes. Currently in a broad Wave 2 which means bigger picture may be somewhat bearish to range bound for months and/or years. This may unfold like a multiyear Gold consolidation. Keep an eye on broader price structures as they develop in light of oncoming catalysts.
Thank you for considering my analysis and perspective.

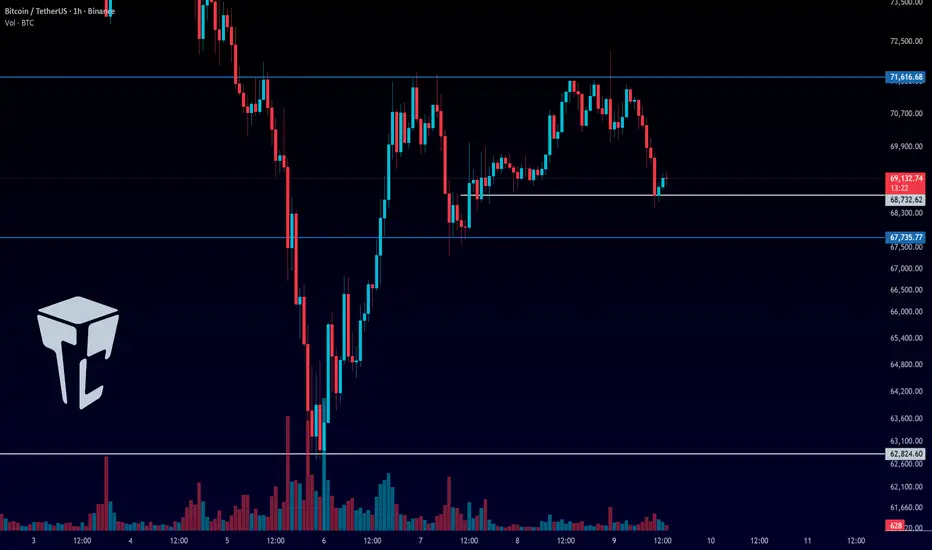
TradeCityPro | Bitcoin Daily Analysis #263👋 Welcome to TradeCity Pro!
Let’s move on to Bitcoin analysis. Today, the market may continue its bearish move.
⌛️ 1-Hour Timeframe
On this timeframe, after getting rejected from the 71,616 high, Bitcoin is moving down toward its support at 67,735.
🔍 At the moment, price has reacted around 68,732, and it could now enter a ranging phase. In that case, we can look to open a short position on a break of 68,732.
📊 Otherwise, we can wait and look for a short entry on the break of 67,735.
✨ For long positions, our trigger remains the break of 71,616. If buying volume starts to increase, we can enter a long position once this level is broken.
⚡️ A break above 71,616 would give us the first bullish signal, and after that, forming higher highs and higher lows above this area would confirm a trend reversal to the upside.
✔️ However, if the short trigger at 67,735 gets activated, price could move toward 62,824. A break below 62,824 would then signal the start of the next bearish leg.
❌ Disclaimer ❌
Trading futures is highly risky and dangerous. If you're not an expert, these triggers may not be suitable for you. You should first learn risk and capital management. You can also use the educational content from this channel.
Finally, these triggers reflect my personal opinions on price action, and the market may move completely against this analysis. So, do your own research before opening any position.
Bitcoin’s Unfilled CME Gap: A Price MagnetBitcoin currently has a CME gap between $79,600 and $83,730, which remains unfilled.
From a historical and statistical perspective, CME gaps have a strong tendency to be filled over time, making them important reference zones for both swing traders and long-term market participants.
At the moment, price has moved significantly away from this range, which reduces the probability of a gap fill in the short term and makes any immediate retracement less likely without a clear catalyst. Strong momentum and trending conditions can delay gap fills for extended periods.
However, this does not invalidate the gap. Instead, it should be viewed as a high-probability magnet zone that may come into play during future corrections, deeper pullbacks, or broader market structure shifts.
As long as this CME gap remains open, it represents a key area of interest for liquidity, potential support/resistance reactions, and higher-timeframe mean reversion. Traders should keep this zone marked on their charts and be patient, as sooner or later the market tends to revisit and fill these inefficiencies.
Risk management and confirmation from price action are essential when approaching this area.
If you have a coin or altcoin you want analyzed, first hit the like button and then comment its name so I can review it for you.
This is not a trade setup, as it has no precise stop-loss, stop, or target. I do not publish my trade setups here.

Bitcoin weekly—Relief rally (inverted correction) vs bear marketBitcoin just ended a major correction, a classic ABC. It was 53.56% strong (-53.56% from top to bottom).
The last weekly session produced the highest volume on the sell side since March 2024. The last bullish move started August 2024. This volume signal reveals that lower prices are likely in the latter part of 2026. It also reveals that any bullish action that starts now should be short-lived, short-term, and should end in a lower high.
The correction bottom reached $60,000 on a wick. Multiple support levels were pierced. The weekly session close happened at $70,330.
Bitcoin closed below the 0.5 Fib. retracement level in relation to the long-term market cycle, which sits at $70,839, but above the 0.618 level ($57,772). The fact that the 0.618 Fib. retracement level missed completely calls for some sort of relief rally, short-term bullish action.
This opens up two targets mainly right away, without going through too many calculus: 1) The previous high around $98,000 and 2) the 0.382 Fib. retracement level in relation to the current correction, which sits at $85,288. The latter is an easy, high probability target. This is the minimum price Bitcoin will challenge in the coming weeks.
We can speculate about other developments; the wave's size, shape and duration, but this is all irrelevant at this point. The most basic fact that can be extracted from this chart is that Bitcoin is going up as a market reaction to the strong down-move, an inverted correction.
This up-wave is bound to happen regardless of past cycles, ETFs, the news, astrology, moon landing, etc. The chart calls for a relief rally and this is what we will get. The rest is just hocus pocus and much speculative opining.
The most important development on this chart is the most recent move. Its duration was 119 days based on the weekly candles. The inverted correction's duration will happen in relation to this move because the market is reacting to it. The market is reacting to the fact that Bitcoin hit $60,000. To the fact that it pierced several strong long-term support levels but failed to close below them. The market will exploit this and push prices higher.
The inverted correction can last a maximum of 60 days, which is around half the time the duration of the main move.
39% of 119 days gives us 46 days. We are starting to form a picture as to the duration of the relief rally and I think this is enough for today.
While the inverted correction takes place on Bitcoin, the altcoins market will blow up.
Thank you for reading, your continued support is highly appreciated.
If you enjoyed the content, make sure to comment.
Namaste.

EURUSD – 1H CHART PATTERN )...EURUSD – 1H CHART PATTERN ).
Bias: Bullish 📈
(Descending trendline breakout + demand zone hold)
Buy Zone:
🔹 1.1820 – 1.1800
Targets:
🎯 TP1: 1.1865 – 1.1880
🎯 TP2: 1.1950 – 1.1970
🎯 TP3 (Main Target): 1.2050 – 1.2100 🚀
Stop Loss:
❌ Below 1.1760
Confirmation Notes:
Strong breakout above trendline
Price holding above demand + Ichimoku cloud support
Bullish structure (higher lows)
📌 Tip:
Book partial at TP1, move SL to breakeven, let runners aim for TP2 & TP3.Bias: Bullish 📈
(Descending trendline breakout + demand zone hold)
Buy Zone:
🔹 1.1820 – 1.1800
Targets:
🎯 TP1: 1.1865 – 1.1880
🎯 TP2: 1.1950 – 1.1970
🎯 TP3 (Main Target): 1.2050 – 1.2100 🚀
Stop Loss:
❌ Below 1.1760
Confirmation Notes:
Strong breakout above trendline
Price holding above demand + Ichimoku cloud support
Bullish structure (higher lows)
📌 Tip:
Book partial at TP1, move SL to breakeven, let runners aim for TP2 & TP3.

BTCUSD – (1H chart)...BTCUSD – (1H chart).
Bias: Bullish (trendline breakout + consolidation above support)
Buy Zone:
🔹 70,200 – 69,800
Targets:
🎯 TP1: 71,500
🎯 TP2: 73,000
🎯 TP3 (Main Target): 75,000 – 75,500
Invalidation / SL:
❌ Below 69,200 (daily close)
Notes:
Price has broken the descending trendline and is holding above the demand zone.
A clean hold above 70K increases probability toward 75K.
Partial profits recommended at TP1 & TP2, trail stop after TP1.

Bitcoin - Is Bitcoin's Downtrend Over?!Bitcoin is below the EMA50 and EMA200 on the four-hour timeframe and is in its medium-term descending channel. Bitcoin's upward correction towards the specified supply zones will provide us with its next selling opportunities.
If the decline continues towards the demand zone, we can buy Bitcoin with appropriate risk-reward. It should be noted that there is a possibility of heavy fluctuations and shadows due to the movement of whales in the market and compliance with capital management in the cryptocurrency market will be more important. If the downward trend continues, we can buy within the demand limit.
Market sentiment across the cryptocurrency space has fallen to its lowest level since the collapse of FTX, a period when Bitcoin’s sharp decline triggered widespread forced deleveraging and heavy selling pressure throughout the market.
The Crypto Fear & Greed Index dropped to 9 on Friday, placing it firmly in the “extreme fear” zone—levels historically observed only during periods of severe market confidence breakdown.
By the end of the trading week, spot Bitcoin ETFs recorded another negative performance, similar to the previous two weeks. However, despite the deeper market decline, total outflows reached $689 million, noticeably lower than the $1.49 billion and $1.33 billion outflows seen in the two prior weeks.
Bitcoin’s sharp سقوط to around $60,000—roughly a 30% drop within a single week—has fueled widespread speculation among traders and analysts. Many believe the decline was not driven solely by general risk-off sentiment but was likely connected to the forced liquidation of a large non-crypto entity.
According to these scenarios, the recent heavy selling may have originated from a **major institution—possibly based in Asia—**that was compelled to exit positions rapidly due to financial pressure. Social media discussions have ranged from multi-billion-dollar Bitcoin sales by a government or exchange to chain reactions across leveraged trades, carry trades, and options positions tied to BlackRock’s spot Bitcoin ETF (IBIT).
This سقوط marked Bitcoin’s worst single-day performance since the 2022 FTX collapse. “Flood,” a well-known crypto trader, described the selling as “violent, forced, and indiscriminate,” noting that pressure of this magnitude has rarely been seen in recent years.
At the same time, the steep price decline has reignited concerns about Bitcoin’s long-term security. Some industry participants argue that falling prices and reduced liquidity may be the only forces capable of pushing the market toward serious efforts to harden Bitcoin against quantum-computing threats, particularly as sentiment reaches post-FTX lows.
Arthur Hayes, co-founder of BitMEX, attributed the sudden drop in Bitcoin’s price to bank hedging activity linked to BlackRock’s spot ETF (IBIT). He noted that institutions such as Morgan Stanley have issued structured productstied to the ETF’s performance.
Hayes explained that these instruments effectively represent bank bets on Bitcoin’s price, and when BTC moves rapidly, banks must buy or sell immediately to manage risk—behavior that can amplify volatility and produce sharp price swings.
He emphasized that he will closely monitor these ETF-linked financial products going forward, as they may provide signals of Bitcoin’s next major market moves.
Meanwhile, Strategy reported significantly higher losses in its fourth-quarter earnings, with unrealized digital-asset losses reaching $17.4 billion and a net loss of $12.4 billion.
As of February 1, 2026, the company holds 713,502 BTC, acquired at a total cost of $54.26 billion and an average price of $76,052 per Bitcoin.
During 2025, Strategy raised $25.3 billion in funding while building a $2.25 billion cash reserve, which the company states is sufficient to cover approximately 2.5 years of dividend payments and interest expenses.

Bitcoin Dips Below Key $70,000 LevelBitcoin Dips Below Key $70,000 Level
Bitcoin (BTC-USD) has slipped below the critical $70,000 threshold, down 2.41% amid broader crypto volatility and market rotations. This dip follows a wild ride, potentially signaling the end of a bear phase based on Sharpe Ratio metrics, but questions linger on sustained recovery.
Key facts: Trading near $68,500, BTC faces support at $65,000 with resistance at $72,000. The move correlates with tech sell-offs and AI capex shifts, where energy demands indirectly pressure crypto mining costs. Ethereum (ETH) shows similar weakness, down in tandem.
Implications: This could present buying opportunities 💡 for long-term holders, especially with interconnections to AI (e.g., data center energy) and commodities (gold as a hedge). However, risks from regulatory scrutiny and market sentiment tied to upcoming US jobs/CPI data warrant caution ⚠️. Altcoins may follow, amplifying volatility.
Links to bigger pictures: Bitcoin's movements often preview tech trends; watch for rebounds if Dow sustains above 50,000. Consider staking strategies for yields above 4% in stable protocols.

Unlocking Altseason: Chart Signals You Can't IgnoreAltseason without myths: what actually shows up on charts before alts go crazy
Everyone loves to say “altseason is coming” the same way kids say “summer is coming” in March. Feels good, zero responsibility.
But altseason isn’t magic. It’s just money rotating. And that rotation leaves fingerprints on the charts way before your favorite microcap does +500%.
Let me walk you through the main conditions I usually want to see before I start taking alt setups seriously – not memes, not hopium, just price.
1. King Bitcoin does his move first
Healthy altseasons rarely start from flat Bitcoin.
Typical pattern:
- First, a strong impulsive move up on BTC
- After that move, BTC stops trending and starts chopping in a range
- Volatility cools down, candles get smaller, volume drops
TL;DR: Big boys rode BTC, locked in chunky profits, and now their fresh capital is looking for higher beta plays. That’s when alts start feeling “lighter”.
If BTC is nuking or making fresh parabolic highs every day, alts usually just get dragged around like bags on a train.
2. BTC dominance stops climbing and starts bleeding
Open BTC.D (Bitcoin dominance) and zoom out.
Before most big alt runs, I usually see:
- A clear uptrend in dominance while BTC is running
- Then a topping structure: double top, lower high, or a fake breakout above the previous high
- And then – the key part – a confirmed breakdown with lower lows
That’s literally money leaving BTC relative to alts.
No need to overcomplicate:
Rising dominance – market respects Bitcoin.
Falling dominance – market starts gambling on the side quests.
3. ETH vs BTC wakes up
ETHBTC is my canary in the coal mine.
If ETH can’t even beat BTC, why should I expect your random GameFi coin to do it?
Before many altseasons I’ve watched:
- ETHBTC prints a base or higher low
- Breaks local resistance
- Starts grinding up, even if slowly
ETH often leads the rotation. When this pair wakes up, liquidity is starting to accept “more risk”.
4. Total alt market cap breaks structure
Open TOTAL2 or TOTAL3 – that’s your x-ray of altcoins as a whole.
What I like to see:
- A clear downtrend turning into a sideways accumulation range
- Higher lows forming under a big horizontal resistance
- Breakout of that resistance with expanding volume
That’s not your random lucky pump – that’s the whole sector getting repriced.
5. Volume rotation: BTC quiet, alts noisy
Check the volume bars:
- BTC: volume fades while it ranges
- Major alts: volume spikes on green days, pullbacks on lower volume
That’s exactly what “rotation” looks like. Money doesn’t appear from nowhere – it walks from chart to chart.
Maybe I’m wrong, but I think “altseason” is mostly a marketing word influencers use when they ran out of Bitcoin content. On charts it’s just a sequence:
BTC pumps → BTC chills → dominance tops → ETHBTC turns → alt market cap breaks out → volume rotates.
Last nuance: don’t try to guess the exact start like it’s New Year’s midnight. Focus on conditions, not dates. When several of these signals line up, I start hunting alt setups. When they disappear, I stop dreaming about 50x and go back to trading what the market actually gives.
In the end, altseason is just greed with a chart pattern. Learn to spot the pattern – and the greed will find you on its own.

Bitcoin has generated buy signals (30M)📊 Bitcoin Technical Analysis | Bullish Setup | Buy Opportunity
A short-term trendline has been broken, which clearly shows that sellers are no longer able to keep buyers below this key resistance. This breakout indicates increasing bullish momentum and a potential trend reversal in the short term.
In addition, a major and critical supply zone has been completely cleared. This area previously acted as strong resistance, but price has now managed to break through it with strength, confirming buyer dominance in the market.
The upper supply zone above the current price has already been tested multiple times and is mostly consumed. As a result, there are very few remaining sell orders in this region, which increases the probability of further upward movement.
📈 Trading Strategy – Buy/Long Setup
We are now waiting for a healthy pullback toward the highlighted entry zones on the chart. These levels offer high-probability entry opportunities for buy/long positions.
For better risk management, it is recommended to enter using a DCA (Dollar Cost Averaging) strategy at the marked levels. This helps reduce risk and improve average entry price.
🎯 Targets & Risk Management
All target levels are clearly marked on the chart.
At the first target (TP1), consider securing partial profits. After that, move your stop-loss to breakeven to protect your capital and trade with reduced risk.
If the price reaches the stop-loss, this setup and analysis will be invalidated, and the bullish scenario will no longer be valid.
⚠️ Reminder
Always follow proper risk management and never risk more than you can afford to lose. Market conditions can change rapidly, so make sure to manage your positions responsibly.

BTC/USDT — Exhausted Sell-Off: Consolidation or Slow Grind Lower✔️ The week closed with a red candle and a long lower wick, but it does not qualify as a reversal pattern.
🟢 RSI is extremely oversold on higher timeframes.
🟢 Buyer reaction is visible at the support block.
Price spent ~250 days in the 55–70k range — it’s reasonable to expect at least a pause or consolidation here.
🟢 US employment is weakening — a potential signal for rate cuts ahead.
🟠 The structure resembles May 2022, as if only half of the downside move has played out.
This scenario is now widely discussed on social media, which reduces the odds of a direct repeat.
🟠 Extreme fear, with the index dropping to 5.
🔴 The market is highly exhausted, but hasn’t reached full apathy yet.
🔴 Both institutional and retail investors continue selling crypto ETFs.
🔴 Negative cumulative delta: –$1.62B.
🔴 The risk of entering a prolonged bear cycle is increasing.
🧠 The sell-off unfolded faster than expected, but the rebound failed to produce a reversal.
Base case: slow grind lower for 1–3 weeks, with a reversal near the lows — possibly with a sweep, possibly without.
The key is that a reversal eventually forms.

BTCUSD: Successful Defense of 65k Demand Zone – Bullish RecoveryMarket Outlook: Bitcoin is showing strong structural resilience on the 15-minute timeframe after finding significant buying interest at the 64,911 – 65,000 demand zone.
Technical Breakdown:
Accumulation Confirmation: The price has formed a solid base following a recent corrective phase, with a clear "V-shaped" recovery emerging from the lows.
Trend Shift: We are observing the start of a new bullish cycle, marked by the reclamation of local resistance levels and a strong impulsive candle higher.
Projected Trajectory: The analysis anticipates a continuation toward the primary liquidity targets, as highlighted by the large bullish momentum arrow.
Key Objective: The main goal for this move is the major overhead supply cluster near 78,000.

Lighter (LGT) Swing Trade Setup – Approaching Key SupportLighter (LIT) is currently pulling back and heading toward a critical support zone between $1.50 and $1.54. This area has historically acted as a demand region, and price action is now slowing — signaling a potential bounce setup. If support holds, this could be a solid swing opportunity.
🟢 Trade Plan
Entry Zone: $1.50 – $1.54
Take Profit Targets:
• TP1: $1.68
• TP2: $1.80
Stop Loss: $1.50 (hard stop — close below invalidates setup)
