Bitcoin TA and ALT coin TAHi guys,
I hope you enjoyed the video! Its going to be a very existing next 3 months!
Btc-short

BITCOIN GIGA PLAN for 2025-2026Last time, I have fulfilled the dream of every trader: I entered at 15k and sold everything at 121500.
(if you don't believe, check my latest idea posted by Jan 10, 2023)
I notice that a lot of people completely misunderstand, and draw utter nonsense on the charts, and call it cycles.
Well, here's the Bitcoin cycle graph, the only one you need.
Sell your BTC bags NOW.
Buy at 38k BTC. or by 26 october 2026 by any price.
it depends on which of these happens first.
I will continue to use BTC cycles as long as it works, it gives phenomenal accuracy, as long as you use your brain.
I often hear people say about extended cycle (again lol?).
They waiting for banana zone.
We haven't seen euphoria phaze.
what can I say to such people?
Dream in one hand, and shit in the other, and then check which one is fills first xD
Don't be one of them, and don't listen to this bullshit.

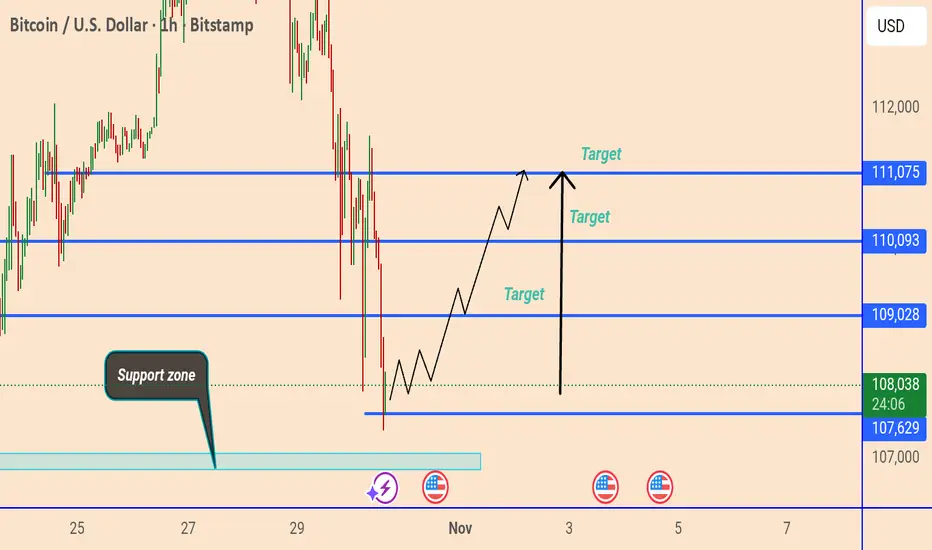
Bitcoin Price Analysis: Potential Rebound from Key Support Zone This chart shows the BTC/USD (1-hour) price action with key support and resistance levels. Bitcoin is currently trading near $107,904, slightly above a highlighted support zone around $107,629–$107,000. The analysis suggests a potential bullish reversal from this support, with projected upside targets at $109,028, $110,093, and $111,075.
Bitcoin Forms Head and Shoulders — Correction 107,500 in PlayHello traders! I’d like to share my view on the current market structure for Bitcoin. After a prolonged period of bullish momentum and multiple impulsive rallies, the market has entered a corrective phase. The price action has formed a clear Head and Shoulders pattern beneath the major resistance zone near 121,700, signaling growing selling pressure. Currently, BTC is trading within a short-term descending structure, staying below both the resistance line and the Seller Zone. The recent rejection from the right shoulder area confirms that sellers remain in control, and the market is now moving toward the Buyer Zone, located around 107,500.In my opinion, this movement represents a continuation of the ongoing correction rather than a full trend reversal. I expect the price to decline into the Buyer Zone, completing the right shoulder and reaching the TP1 target near 107,500. If the market finds strong support in this demand area and forms a confirmed reversal structure, it could mark the end of the corrective phase and initiate the next major bullish leg. A successful bounce from this level would open the way for a potential rally back toward the 114,000–115,000 resistance range.This setup provides a clear trading plan — I remain bearish in the short term, looking for a potential bullish reversal from the lower boundary of the structure. Please share this idea with your friends and click Boost 🚀

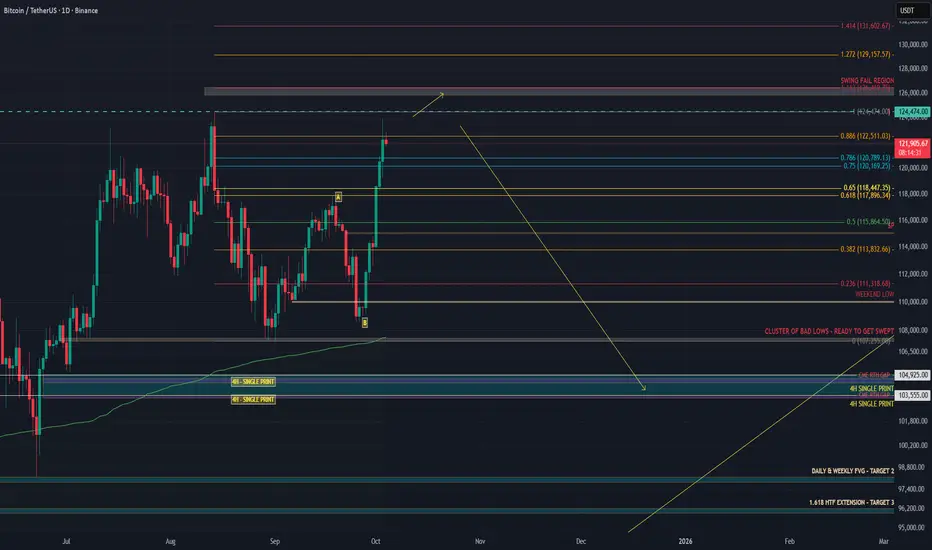
BITCOIN’S FINAL TRAP – THE SENTIMENT SWITCH IS COMING FASTIn my last BTC post I said a dump was likely based on data, and that thesis still stands. If anything, it’s even stronger now. .
On 13 August, CME made a high at 123,590.
That high was weak, no excess, flat TPO top, unfinished auction.
Binance topped at 124,474, Coinbase at 124,522.
CME opened with a gap down, leaving that poor high unrepaired with unfinished business and clean liquidity sitting above.
From 26 September, BTC started grinding up.
I expected a run of the 18 September high and a reversal around 118–119K, but price extended the move to the 1.618 extension. See my last analysis.
Structure was weak, spot CVD flat, futures CVD ripping, open interest climbing.
That shows perps were driving it, not real spot demand.
This week CME finally cleaned it up.
CME ripped through 125,025, taking out the August high at 123,590.
That level matched the old highs on Binance and Coinbase almost perfectly.
CME swept the old poor high left behind by spot and perps, completing the auction.
This is typical CME behavior, it hunts untested reference points during RTH and often reverses right after.
Flow data confirms the setup:
Spot CVD down means real buyers not following.
Stablecoin CVD pushing up means overleveraged longs chasing.
Coin-margined CVD rolling means profit taking or hedge flow.
Open interest flat at the top means trapped longs with no squeeze left.
The move looks like a leveraged markup driven by perps, cleaned up by CME liquidity, and now hanging on air.
CME repaired the August inefficiency, swept the prior spot high, and left another weak high with no excess, a textbook sign of distribution.
There’s still a chance we see one more SFP around 126K before momentum flips, but unless spot demand picks up aggressively, that should be the final liquidity grab.
My targets are 104K and 99K if 104K fails to hold, with potential for an even deeper drop beyond that level.
#BTCUSDT Let Bitcoin make a new ATH#BTC
The price is moving in a descending channel on the 1-hour frame and is expected to break and continue upward.
We have a trend to stabilize above the 100 moving average once again.
We have a downtrend on the RSI indicator that supports the upward move with a breakout.
We have a major support area in green that pushed the price higher at 121,500.
Entry price: 122,200.
First target: 122,800.
Second target: 123,400.
Third target: 124,200.
To manage risk, don't forget stop loss and capital management.
When you reach the first target, save some profits and then change your stop order to an entry order.
For inquiries, please comment.
Thank you.

Bearish Gartley Potential on BTCTarget is around ~120,800 for the 0.786 retrace.
- 4hr RSI showing extreme levels
- Currently meets all criteria for a Bearish Gartley pattern


Bitcoin can rebound from resistance level and start to declineHello traders, I want share with you my opinion about Bitcoin. Recently, the price broke above a local resistance and quickly approached the key resistance level at 110000, which also aligns with the upper boundary of the seller zone (110000 - 110700 points). This area has already proven its strength multiple times, causing sharp rejections in the past. Moreover, the price has tested it again recently and failed to break through. In addition, we can see a triangle structure, which fits the logic of a pennant pattern after a bullish wave. However, the latest move upward has already lost momentum near the apex, and the price is now trading just under the upper edge of this formation. That makes this zone technically overloaded and vulnerable to a downside reversal. Based on this, I expect Bitcoin to test the resistance level one more time and then roll back down toward TP 1 at 106000 points, a zone near previous liquidity accumulation and a local consolidation range. If selling pressure increases, the price might aim for the buyer zone (103800 - 103100). Given the current rejection at resistance, the structure of the triangle, and the reaction inside the seller zone, I remain bearish and expect further decline toward the support. Please share this idea with your friends and click Boost 🚀
Disclaimer: As part of ThinkMarkets’ Influencer Program, I am sponsored to share and publish their charts in my analysis.

bitcoin btc shortshort entry :107.300 , STOP LOSS: 108.400 , PROFIT TARGET 101.000
RR 1:5 BINANCE:BTCUSDT.P

BTC Educational Idea by 1PercentFundedBTC Update : These are the possible scenarios for BTC based on 2021
Scenario A. BTC rejects 108/109k (Purple Arrow) & retest 98k (High Probability)
Scenario B. BTC retest 110/111k (Black Arrow) & creates a double top before dumping to 88/98k
Our team will be building shorts at 108k onwards & will add if 111k is given. 117.5k invalidation.

Bitcoin can drop from wedge to 100K pointsHello traders, I want share with you my opinion about Bitcoin. After consolidating for an extended period within a triangle pattern, the price eventually broke out with strong bullish momentum. The move was supported by a solid rebound from the buyer zone and a clean breakout above the 92800 - 94200 support area. This breakout initiated a steep climb, forming a new upward wedge structure, defined by narrowing trend lines and rising local highs. Currently, the price is trading near the resistance boundary of the wedge, around the 104000 - 105000 zone. This zone has already triggered one rejection and is showing signs of weakening bullish strength. Given the rising wedge geometry and the fading impulse strength, the risk of a correction is increasing. The current structure typically leads to a pullback, especially after such a steep rise. I expect that BTC may rise to the resistance line of the wedge and then drop below the support line, thereby exiting from this pattern. That's why I set my TP 1 at the 100K points. Please share this idea with your friends and click Boost 🚀

my idea about btc in secound half of 2025Dear followers,
I’ve analyzed BTC’s recent price movements and on-chain indicators, and I’d like to share my outlook for the second half of 2025. Based on my technical and macroeconomic assessment, I anticipate a significant correction before a strong rebound later in the year.
Key Highlights:
Sell Zone: I expect BTC to reach around $108,000 during a bullish run, where I recommend taking profits and initiating a short position.
Correction Phase: Following the peak, I foresee a correction bringing BTC down to approximately $69,000. This presents a deep buy opportunity for those looking to accumulate at lower levels.
Target for Rebound: Post-correction, I project a strong rally towards $140,000, driven by renewed institutional interest and market fundamentals.
Trading Strategy:
Consider selling or reducing holdings near the $108K level.
Be prepared to accumulate during the dip around $69K.
Aim for the $140K target on the rebound, aligned with overall bullish momentum.
Please note that all trading involves risk, and it's essential to manage your positions carefully. Stay tuned for updates, and always do your own research before making trading decisions.
Let me know your thoughts or if you'd like a deeper analysis!

BTC Shortwe in 4h sibi + week -breaker
we are have 4h - braker
Price need rebalance zone its
-week bisi
-day bisi
-4h bisi
Below we are have month bisi
Lets see week bisi can be true support and move price to new Higher High or this make inversion
Now I look short for 91060

Bitcoin can make small move up and then drop to support levelHello traders, I want share with you my opinion about Bitcoin. Earlier, price was moving inside a range, where the price repeatedly bounced between the upper boundary and the buyer zone. After multiple failed attempts to break higher, the price finally broke out and started an upward movement, forming a strong bullish impulse. This upward momentum led BTC into the support area, where it consolidated briefly before continuing to rise. From there, the price began to form an upward wedge, respecting both the support line and the resistance line of the structure. Recently, BTC tested the upper boundary of the wedge and rolled down, confirming the resistance. Now, the price is trading closer to the upper half of the wedge but shows signs of weakness near the resistance line. Based on this setup, we might see that the price can one more short-term attempt to grow, followed by a rejection from the upper boundary and a move downward toward the 86500 support level. If the price fails to hold this level, the next stop could be the support line of the wedge. Please share this idea with your friends and click Boost 🚀

BTC: Overbought & Losing Momentum – Drop to Support Incoming?Almost a perfect gap fill in the 85000-86500 zone, followed by a strong reaction off the level. RSI is in overbought territory.
Expecting a quick drop to support levels at 80174 / 78947 / 76449
Short entry point: 84300
TP: 80174 / 78947 / 76449
Stay tuned for more setups, follow me so you don’t miss them. Also, check out my X profile, big things coming soon!

41K is Coming?Will the 200-week simple moving average waiting around 41K meet us or will we continue to rise with a reaction from the fib levels? My personal opinion is that the bull never started. We just made a new high. Now it's time for a new low.

BTC Short Crawling my way back, feels good to trade again. I am trying again. Small amounts at play and small moves but its about finding your way.

BTCUSDT Fresh Short Setup: Targeting Key Support Zones with SMC Description:
This trade setup presents a Bitcoin short opportunity on the 4H timeframe using the Smart Money Concepts (SMC) framework. After a significant reaction from the supply zone, Bitcoin's price structure aligns with bearish confluences, signaling potential downside. Additionally, external events, such as the recent announcement of China's AI application "DeepSeek," may have amplified market volatility, further supporting the setup.
Trade Setup:
Entry:
Between 103,300 and 104,500
Take-Profit Levels (TP):
101,897
99,825
97,565
95,208
Stop Loss (SL):
Above 105,975
Analysis and Confluences:
Market Structure:
Bitcoin remains in a bearish trend on the 4H timeframe, with consistent lower highs and lower lows.
Supply Zone:
The price is entering the 103.3k–104.5k supply zone, a key resistance area where sellers are expected to dominate.
Fibonacci Confluence:
This zone overlaps with the 0.618–0.786 Fibonacci retracement levels, a high-probability reversal area.
Liquidity Sweeps:
Liquidity above previous highs has been swept, leaving the path clear for potential downside.
Bearish Targets:
The targets align with previous demand zones and liquidity pools at 101,897, 99,825, 97,565, and 95,208.
Trade Plan:
Confirmation: Wait for bearish price action signals or smaller timeframe BOS (Break of Structure) within the supply zone before entering.
Risk Management: Adjust position size to keep risk within acceptable levels. After reaching TP1, move your stop loss to breakeven and secure partial profits.
Final Note: While bearish bias dominates, unexpected macroeconomic events can cause reversals, so use tight risk management.

The Trump DumpCaution to the sensitive bulls, you're not going to like this one...
I know we all like hopium and up-only charts, but this isn't it. Those only exist in fairytales. This is trading and we have to stay grounded if you plan to actually profit outside of the HODL philosophy.
The truth is that elections don't matter, new events doesn't matter. At least not how the majority thinks they do. These events merely mark points in time, they can be catalysts or pivots. But those time points don't care about your philosophy on the actual event.
Let the emotion and philosophy in and you'll lose, guaranteed. Close those out and look only at the charts, using those events to understand important time points to pay attention to and you might see that this one is going to be critical.
On a macro picture, this market structure has been clear, simply a series of expansions and ranges (I know, obvious, this is how all price moves). But recently we had a strong expansion beyond the all-time high, which might seem bullish at first glance but is going to be a liquidity trap in hindsight.
On a more local view, we have our range forming after this larger expansion and that range has already generated a fakeout higher and come back into the range, with the next breakout of the range to be to the downside. I do not trade blind FVGs or other ICT stuff, but there will be a lot of hindsight analysis from people claiming that this daily FVG was obvious.
Combine this with the important time events that has everyone so bullish, like elections or whatever, and you have the perfect recipe to wreck almost everyone.
From here, I am looking for AT LEAST a 30% drop . Targets may get lower as data comes in, but keeping it conservative until more high timeframe candles come in.
You may disagree with the post, but at least it has a clear bias.

VIRTUAL - 4:1 RR Short SetupThis trade setup presents a low-risk opportunity with a 1% risk for a potential 4% reward, providing an attractive risk-to-reward ratio of 4:1. The analysis is based on an ABC correction pattern, with entries laddered between the 0.618 and 0.718 Fibonacci retracement levels, SL above the high. The take-profit target is strategically placed at a well-defined confluence support zone.

A rising Wedge Formation In the 4H - Short for Short Period.So even though Bitcoin is in the middle of a huge upward move markets always gave us the opportunity to make money in the middle of every strong trending moves. For now we got a rising wedge formation with a heavy pull back based on the news from the FED and the zone which is acting as a magnet support level got more confluence points including the strong demand zone, the horizontal support line of the 2 formed triangles and the 1.27 extension fib level on the higher timeframe. All this points and some other additional insights are included in this short video and enjoy watching it. Please do consider to do your own research before making any type of investments in any type of markets and I urge you to notice that this is not a financial advice at all rather a personal view point.
Nathnael B.

BTC Short Trade Setup 101,000 Looks like a good level to short as its a good supply zone.
94,000 seems to be a good target
BINANCE:BTCUSDT
#crypto
