GBPUSD: Market Pullback Before the Next Upside Expansion1. MARKET CONTEXT
- GBPUSD has just completed a mild corrective pullback after a strong bullish leg, reflecting a healthy market reaction following the latest UK GDP release.
- The GDP data came in stable and slightly better than expected, not spectacular but strong enough to ease recession fears.
This creates a constructive environment for GBP not explosive, but certainly not bearish.
2. MACRO DRIVERS
✓ UK GDP Stability Supports GBP
Yesterday’s GDP print showed steady growth, reinforcing the view that the UK economy is gradually improving.
→ This reduces downside pressure on GBP in the short term.
✓ BOE Expected to Hold Rates Higher for Longer
With services inflation still sticky, the market is pricing in that the BOE will delay any rate cuts.
→ This acts as a tailwind for GBP during pullbacks.
✓ USD Softening as Markets Price Early Fed Cuts in 2025
Not aggressively bearish, but the USD is losing momentum as traders anticipate a shift toward Fed easing.
→ This opens the door for GBPUSD to resume its upside.
3. TECHNICAL STRUCTURE
On the GBPUSD 1H chart, price is forming a clean corrective pullback into the 1.3375 – 1.3380 support zone.
Key technical signals:
- Price is building a Higher Low after the pullback → bullish continuation structure
- Long lower wicks → declining sell pressure
- The 1.3375 support has been retested multiple times → strong demand
- The ascending trendline remains intact → uptrend not broken
→ The structure currently shows accumulation before upward breakout.
4. TRADE IDEA / PRICE EXPECTATION
As long as price holds above 1.3375, the bullish continuation setup remains valid.
Upside targets (matching your chart):
TP1: 1.34156
TP2: 1.34379
TP3: 1.34716
Expected behavior:
✔ Minor pullback
✔ Sideways accumulation
✔ Bullish leg toward TP1 → TP2 → TP3
5. MARKET SENTIMENT & OUTLOOK
With supportive GDP data, BOE’s higher-for-longer stance, mild USD weakness, and a clean bullish structure on the chart:
→ Short-term Trend: Sideways → Support → Bullish Continuation
→ Directional Bias: Upside toward all 3 targets
BTC-TRADE

BTC CAN TURN MONDAY IN A GREEN DAY..📊 Market Update
On the lower time frame, BTC is still in a downtrend. However, there is a possibility of a green day if BTC targets the first level at 113.8K, with a 1-hour time frame confirmation.
The main confirmation for BTC will be at 115.4K. A move from 113.8K could provide an opportunity to consider new day trades.

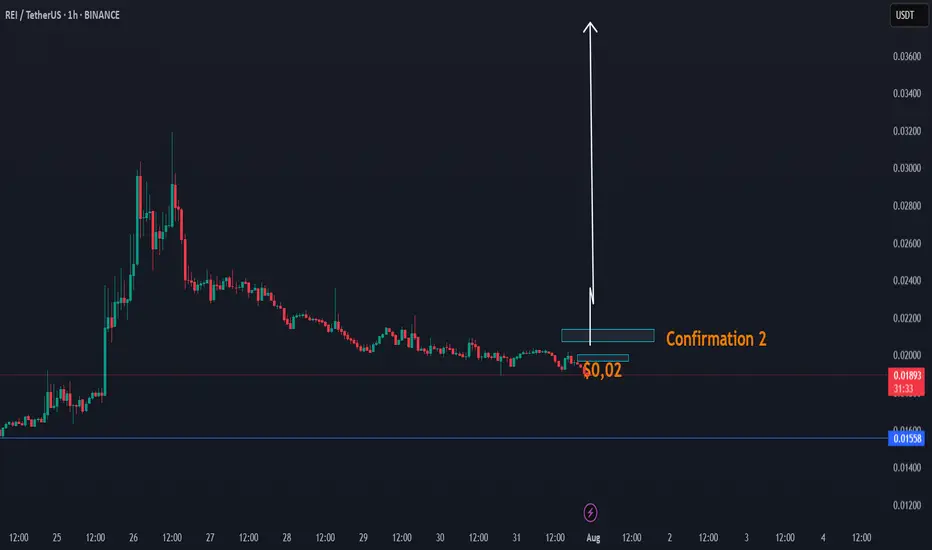
DAY UPDATE REI/USDT THE INCREASE CANDLE OF UP $0,03 - $0,05REI is an interesting coin since the update of Q4
We have seen that this coin was able to increase to $0,031 and until here $0,018 zone, a return to where we are now. There is a high chance that this coin can recover next 24H if this coin is able to confirm the confirmation $0,02 - $0,021
This coin, as before, was targeted at $ 0.02 and had low volume. We expect that if it comes back to $ 0.02, it will be confirmation of the volume, which can take the trend with a candle to up $0,03
REI CONFIRMATIONS ZONE
Higher time frame
When you look normally at this coin, then this coin is in a trend line of breakdown. This can change with the next confirmations. The question is, are we going to see again $0,02 the next 24h? If yes high chance of a break.
We also have a cycle update 2025, check it here, expecting $0,90
BTC 67500 CAN CHANGE THE TREND TO BELOW 60k -VERY IMPORTANTThanks for reading this update.
IF btc can gain below 67500 in the coming time frames with confirmations, then is BTC able to show a huge recovery trend which could bring BTC below 60K, to 56K Target.
Even the ETF hype trend can go over as the AI, and it can become a normal trend as we don't have a hype trend for APPLE of other stocks at this moment.
If we check depending on data the volume ranges on the market, then we see an overflow volume, which could get a recovery so there will be a new chance for new smart money.
Below 67500 with confirmation is an important trend for BTC where it could return to 56K .
The following will be on trend - IS BTC going to 67500 the important strong red zone of the trend.
We use the same way as we expected the trend below 42K to 48K and ATH.
www.tradingview.com
The buy whales and position holders should do their best to hold the levels, otherwise, we are going to see in high chance of a new return to blow 60K.


Bitcoin Buy the Flags NFA This is what ill be doing. Not to say that i have not also been buying these lower/smaller/more shallow dips as well and especially with mining stocks flipping them intraday.
But in the bigger picture this is more of what you should be looking to swing trade.
I'll be buying more aggressively as we touch into these marked areas.

trading plan for BTC reaction only . I do not preset ! trading the range / trading probability's .
Macro environment divine , check S&P 500; DXY .
we are in a range before a big move up or down ... prepare yourself !

Pump and Dump :)) W2 Short trade ! we finish 5 Waves from the low , i prefer this scenario with a lot of levels above !
give me a LIKE :))

BTCUSDT - Watch out for a pullbackGreetings.
As you might saw in my previous BTC analysis, I was expecting the price to start a bigger pullback sooner rather than later.
We have some good signs that the bulls started to lose their groove and the first sign was the movement that it did as you can see in the ending structure on the chart (green channel).
Right now we have a trendline breakout on 15 minutes and I am expecting the price to continue to drop until it reaches one of the two demand areas that I highlighted in my analysis. After this correction is over I am expecting the bulls to come back in play, but keep in mind that even if my analysis is in 15 minutes, I am expecting a 4H correction so the price could go way beyond my levels and hit 17k.
NFA
Stay safe and trade safe.

BTC/USDT - Pullback expectedGreetings!
After the latest rally, BTC entered a supply zone that made the bulls slow down a bit.
I am expecting the latest orderblock to push the price into a pullback that can reach the 17k psychological level at least, which coincides with a demand area, before resuming this small uptrend.
Entry: 17403.9
SL: 17502
TP1: 17000
TP2: 16700
RR: 1:6
Don't risk more than 1% of your account balance!
Cheers.
Trade with care and DYOR.
Disclaimer: This is not a trading signal or financial advice. It is only a potential trade that I'm looking at. I encourage you to always do your own diligence and not jump in blindly.

BTCUSDT Binance Spot Trade Update Fib level is shown in the chart trade according to the levels best for your to exist from the market on 1st target level if you want to a risk wait for 2nd level to hit after 2nd level pack your bag from the market and wait for another opportunity to grab
Have a Great Day and Trade

BTC SHORT TRADE !!!!BTC IS IN DESCENDING TRIANGLE SINCE 14 NOV,
and btc is indicating to go down now
once btc break this descending triangle we will see a dump in market again.

BNX: THE TOP WHALE BREAKOUT THAT CAN HAPPEN ANY MOMENTBNX: the Top coin where soon more whales will see the effect of it.
This coin can get soon the expected trend as long as this DCA whale trend going.
BNX has a higher plan, this depends on the DCA whale holders, and even with the breakdown of markets, this coin can show an unexpectedly high increase change.
Waiting for the real golden breakout that can happen at any time.
Read also about why it can increase and binance support.
Also, if BTC breakdown, as you can see depending on this history chart BNX stays increasing
This is not trading advice and a view from the side of traders.

$GALAPossible to go down to bounce area to retest previous BOS level , then go up to mid level (yellow doted line)

TRB is ready for a shorti will short TRB USDT above 21$
75% and 25% will be closed on two take profit lines.
in case it goes wrong,i will update for a stop loss

BITCOIN / WARNING / SWING / LAST DUMP / 10K ? Hello.
Bitcoin is in perfect position to dump 40-50% more.
There is no any reasons the price to go up, and to not continue down.
No optimistic charts.
Scenario 2 is bull run to start now and to confirm 17 500 as a bottom. But i don`t actually trust to this scenario 2.

btcusdt i think bitcoin price is so high
fall scenario is probably possible
if btc going into 12000 its not expensive
what do you think?

Btc trade take booked profiti have taken a trade today based on indicator and a bit of chart analysis

Bitcoin Trend Analytics May June 13th - What's Next?As we mentioned last Friday, BTC finally broke down the triangle and the downward channel, shorts take hold.
The newly released CPI of 8.6%, which is higher than expected, strengthened the expectation of adding interest rates. The market will be running under pressure.
The next key support is $22309.06

BUY FOR SPOTI think BTC will have a relative bullish correction before finding a strong bearish cycle!
Good luck!
From SARA LE - Founder MC CAPITAL

💂🏻CryptoSoldier💂🏻: BUY #BTC📈 Spot Trade: BUY BTC
⚠️ SL: - In Image
🏅 TP: - In Image
⏳ Time aprox: 7~10 dias
💂🏻If you agree this Trade hit the like button.
💂🏻Si estas de acuerdo deja tu like.
❤️Follow for more info
👍Hit the like button

LONG IDEA to 50k Hello again!
After our very successful short positions from 48k to 38k, i can see lot of long possibilities in the markets. Id like to be bullish on 37.9k on Bitcoin. Maybe scale long all the way of the bearish manipulation wick what occurs before we are moving bullish.
We need to look where are market movers setting their Buy positions.
As told before us30 was at resistance levels. Now we are in more of a support level which could turn crypto market bullish also. If you are more familiar with altcoin's market, there are a lot of opportunities for longing.
Maybe we will get some positive news from Putin that he will not pursue Ukraine war anymore so that would be hugely bullish news which could turn everything bullish and optimistic.
Also Fear and Greed indicator turned today 23/100 in Extreme fear, probably tomorrow we will see 16-20/100 depending on the daily close. These kind of levels were last seen at 22.01.22 before massive 250% bullish move.
I think this run will be more of a bulltrap to 50k to turn everyone bullish then maybe drop to 31k in the summer. We'll see more in coming weeks.
Lets get the bag !

BTC/USDT DIVERGENCE AND FALLING WEDGEBy Completing The Falling Wedge Lattern We expect the price to cross over 40k and 41k Retraces
Beside the Chart pattern Confirmation for Increasing The Market Cap of BTC
We have a divergence In Relative Strength Index Indicator which is a sign For Breaking out 40k Retracement.
This is not Financial Advice
