TradeCityPro | Bitcoin Daily Analysis #269👋 Welcome to TradeCity Pro!
Let’s take another look at Bitcoin. Compared to yesterday, the market hasn’t moved to any major new area, but let’s check the chart again to re-identify potential opportunities.
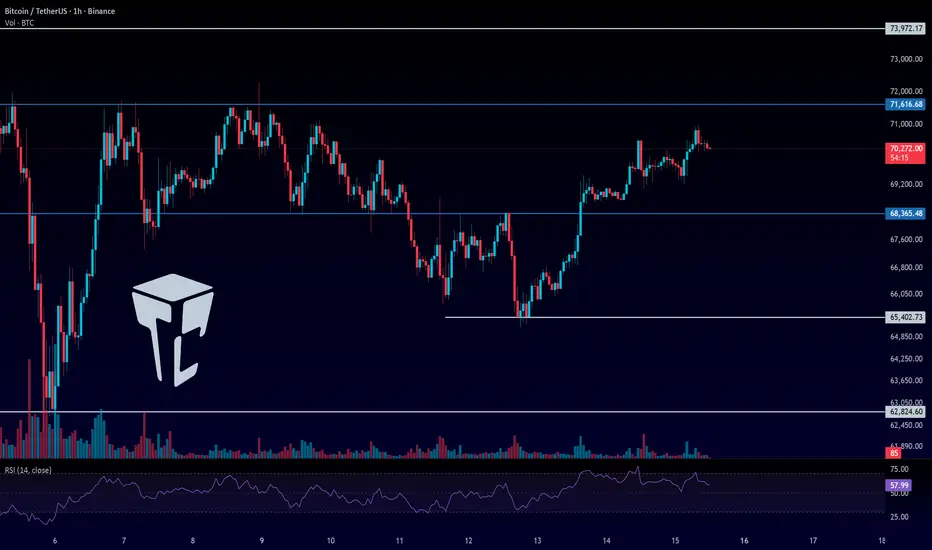
⌛️ 1-Hour Timeframe
Yesterday was Saturday and market volume was very low. Because of that, Bitcoin didn’t show much volatility. Also, since Bitcoin dominance dropped a bit yesterday, some altcoins managed to make attractive upward moves.
📊 But on Bitcoin itself, as I mentioned, there wasn’t any significant movement and price mostly stayed in a range throughout the day.
✔️ Our long trigger is still the 71,616 area. I’m not paying attention to the RSI divergence that has formed, because just like we saw in the previous analysis, RSI is currently giving false signals and isn’t reliable right now.
🔽 For short positions, my preference is for the market to first form a lower high and lower low below 68,436, and then look for short setups.
🔔 However, if price reacts to this 68,436 area and tests it one or two times, we can also open a short position on the break of that level.
The main short triggers remain 65,402 and 62,824.
❌ Disclaimer ❌
Trading futures is highly risky and dangerous. If you're not an expert, these triggers may not be suitable for you. You should first learn risk and capital management. You can also use the educational content from this channel.
Finally, these triggers reflect my personal opinions on price action, and the market may move completely against this analysis. So, do your own research before opening any position.
BTC
BTC Analysis Whats Going On Right Now__FOLLOW FOR MORE UPDATES.NOT A FINANCIAL ADVICE.
NARRATIVE
BTC Just Raid The Major Weekly Liquidity (Support Level). If We Look Here For Shorts, Thats
Hell Of The Madness . Why I'm Telling You Not To Sell Here Because When A Support Broke
Institutions Closes Their Net Shorts And Starts To Go Counter Party To the Major Inducement (Traders They Are Selling The Breakout).
ANALYSIS
+Support That I Mark With Orange Rectangle Is Influential To Offer Through OLD Weekly SSLQ (Weekly Support That Is Ripped). Or The +BISI (Buy Side Imbalance Sell Side Ineffeciency) Is Marked With Burgundy Color Is Utilized For Pyramid Purpose . When We Offer Through Old Weekly SSLQ, I Marked Resistance In Orange This Is Influential To Re-raid The Old Weekly Liquidity, Want To See This Resistance Treated As Support (+Mitigation Block).
REMEMBER
Every Gap I Marked Can Be Reclaimable, You Can Use Again When Reclaimed If Ripped. Or Remember When Price Failed A Specific Price Gap You Can Place A Mitigation Limit Order Right At 50% Of That Gap.
:) Have A Nice Day *FOLLOW FOR MORE*

The Fibonacci Trading Strategy: A Professional GuideMaster the Fibonacci trading strategy. Learn how to use retracements, extensions, fans, and arcs to identify critical support, resistance, and reversal levels in Forex, stocks, and commodities.
In the fast-paced world of financial markets, precision is the difference between a profitable trade and a missed opportunity. The Fibonacci trading strategy is one of the most widely respected tools for identifying critical price levels where markets are likely to reverse or continue their trend.
Used extensively by institutional and retail traders alike in Forex, stocks, and commodities, this method leverages mathematical ratios to decode market chaos.
This comprehensive guide will cover the fundamentals of the Fibonacci sequence, how to apply its various tools (Retracements, Extensions, Fans, and Arcs), and practical techniques to enhance your trading precision.
Key Takeaways
Precision Analysis: Fibonacci tools help identify high-probability levels for support, resistance, and trend continuation.
Versatility: Effective across all major asset classes, including Forex, crypto, stocks, and commodities.
Confluence is Key: The strategy is most powerful when combined with other technical indicators like RSI, Moving Averages, and candlestick patterns.
What Is the Fibonacci Sequence?
The foundation of this strategy lies in a mathematical sequence discovered centuries ago. The Fibonacci sequence is a series of numbers starting with 0 and 1, where each subsequent number is the sum of the two preceding ones:
0, 1, 1, 2, 3, 5, 8, 13, 21, 34, 55, 89…
While this pattern appears frequently in nature and architecture, in financial trading, it serves a specific purpose. By dividing numbers in the sequence by one another, traders derive specific ratios—most notably 23.6%, 38.2%, 50%, 61.8%, and 78.6%.
These ratios are not arbitrary; they represent psychological barriers in the market. Traders use them to predict how far a price might "retrace" (pull back) before resuming its trend, or how far it might "extend" after a breakout.
Fibonacci Retracements: The Core Tool
Fibonacci Retracements are the bread and butter of this strategy. They are horizontal lines that indicate where a potential reversal or pause might occur during a trend.
How It Works
To draw a retracement, a trader identifies a major move:
In an Uptrend: Draw from the Swing Low (lowest point) to the Swing High (highest point).
In a Downtrend: Draw from the Swing High down to the Swing Low.
The resulting horizontal lines act as potential Support (in an uptrend) or Resistance (in a downtrend).
Critical Retracement Levels
23.6%: Indicates a shallow pullback. If price respects this level, it signals a very strong trend with high momentum.
38.2%: A moderate retracement level often seen in healthy, sustainable trends.
50%: While not a true Fibonacci ratio, this psychological midpoint is universally observed by major institutions.
61.8% (The Golden Ratio): The most critical level. This is often where deep corrections end and the primary trend resumes.
78.6%: The "last stand" level. A reversal here usually precedes a massive move, but a break beyond this often invalidates the trend.
Fibonacci Extensions: Projecting Targets
While retracements help you find entries, Fibonacci Extensions help you find exits. They project potential price targets beyond the current range, helping traders decide where to take profits.
How It Works
Extensions require three points: the Swing Low, the Swing High, and the end of the Retracement. The projected levels show where the price might encounter resistance as it breaks into new highs (or support as it breaks into new lows).
Key Extension Levels
161.8%: The primary target for breakouts and initial profit-taking.
261.8%: A secondary target often reached during high-momentum trends.
423.6%: A rare extension level seen only in exceptionally strong parabolic moves.
Advanced Tools: Fans and Arcs
For traders looking to visualize dynamic support and resistance over time, Fibonacci Fans and Arcs offer a different perspective.
Fibonacci Fans
Unlike horizontal retracement lines, Fibonacci Fans are diagonal. They are drawn from a major high or low and radiate outward.
Usage: These diagonal lines act as dynamic trendlines. In an uptrend, price will often bounce off the 38.2% or 50% fan lines as it climbs. A break below the 61.8% fan line often signals a trend reversal.
Fibonacci Arcs
Fibonacci Arcs introduce the element of time. They appear as curved lines radiating from the trend's origin.
Usage: These arcs highlight support and resistance based on both price levels and time duration. The curvature helps traders anticipate not just where price will turn, but when it might interact with a key level.
Enhancing Accuracy: Combining Indicators
A common mistake novices make is trading Fibonacci levels in isolation. To increase your win rate, you should look for confluence—where multiple signals align.
Best Indicator Pairings
Moving Averages: If a 50% Fibonacci retracement aligns perfectly with a 200-day Moving Average, that support level becomes significantly stronger.
RSI (Relative Strength Index): If price hits the 61.8% Golden Ratio while the RSI is in "Oversold" territory, the probability of a reversal skyrockets.
Candlestick Patterns: Look for specific price action triggers, such as a Hammer or Engulfing Candle, occurring exactly on a Fibonacci line.
Volume: A spike in trading volume as price approaches a Fibonacci level confirms that institutional traders are stepping in.
Pros and Cons of the Strategy
Pros:
Universally Recognized: Because so many traders watch these levels, they often become self-fulfilling prophecies.
Adaptable: Works in both trending and ranging markets.
Visual Clarity: Simplifies complex market structure into actionable zones.
Cons:
Subjectivity: Choosing the exact "Swing High" and "Swing Low" can vary from trader to trader.
Not a Crystal Ball: Fibonacci levels are potential zones of interest, not guaranteed turning points. They require confirmation.
Practical Tips for Success
To trade Fibonacci levels like a professional, follow these guidelines:
Wait for Confirmation: Never place a "blind" limit order at a Fibonacci line. Wait for price to react (bounce or reject) first.
Use Confluences: The best trades happen when a Fibonacci level overlaps with previous market structure (e.g., old resistance becoming support).
Risk Management: Always place your stop-loss just beyond the next Fibonacci level. For example, if entering at the 61.8%, your stop should be below the 78.6%.
Start Simple: Master the standard Retracements and Extensions before complicating your charts with Fans or Arcs.
Conclusion
The Fibonacci trading strategy is a powerful method for bringing structure to an unstructured market. It does not predict the future, but it provides a high-probability roadmap of where price is likely to go.
By combining the mathematical precision of Fibonacci ratios with disciplined risk management and secondary indicators, traders can significantly improve their entries, exits, and overall market timing.

BTC.D Analysis: Key Levels for the Start of "Altseason"Bitcoin dominance (BTC.D) continues to show significant strength.
Until key resistance levels are cleared, a meaningful capital rotation into altcoins and a full-scale “altseason” remains unlikely.
Key Resistance Levels to Watch:
61.37% — The immediate and most critical barrier.
63.70% — A major historical and psychological level.
64.50% — The final resistance that could define the peak of this dominance cycle.
What does this mean for the market?
As long as BTC.D maintains this upward structure, pressure on altcoins will persist. Any short-term pullbacks in dominance might offer altcoins temporary relief, but they should not be mistaken for a true trend reversal.
Current Market Outlook:
The recent volatility and market "dumps" are part of a healthy reset. They serve a vital purpose:
Flushing out leverage: Excess speculative positions are being wiped out, forcing out "weak hands."
Healthy Redistribution: Capital is being moved and re-accumulated, building a solid foundation for the next major leg up.
Conclusion:
The market is currently in a "stress-test" phase. Until BTC.D reaches and reacts to the levels mentioned above, Bitcoin remains the clear priority. A breakout toward 64.50% could mark a potential "blow-off top" for dominance—finally setting the stage for the long-awaited and powerful altseason.
I appreciate your feedback — feel free to share your thoughts in the comments!
Disclaimer: This is strictly my personal analysis and opinion. Always make your own decisions and take full responsibility for your trades. I do not use leverage, and you will not find direct long/short signals here.
If you find my market insights helpful, please hit the rocket 🚀 and follow! It helps me understand how many of you value this analysis.
Wishing everyone the best! 🤝

1D: Longer BTC Update w thoughts Bitcoin has now decisively broken below the prior consolidation structure and is in the process of establishing a new range after losing the 72.9k support level.
On the daily chart, price sliced through the rising trendline support that had been building since the prior swing lows. The breakdown accelerated once 72,918 failed, triggering a cascade toward the mid to low 60k region. The sharp wick into the low 60s suggests some reactive demand, but structurally this is still a breakdown environment rather than confirmed accumulation.
At the moment, BTC is attempting to stabilize around 68k to 69k. However, this area is not a well established high time frame support. It is more of a minor reaction zone formed by the recent bounce. The market is effectively trying to define whether this becomes the lower boundary of a new range, or simply a pause before continuation lower.
Key levels to monitor:
• 72,900 to 73,000: Former support, now first major resistance. Any relief rally that fails below this zone keeps the market in a clear lower high structure.
• 92,600: Prior range high. This is now a distant macro resistance and only relevant if strong bullish momentum returns.
• 60,000 to 62,000: First meaningful liquidity pocket from the recent capitulation wick.
• 52,800: More established high time frame support and a stronger historical demand zone. If price loses the 60k region decisively, this becomes the next magnet.
From a market structure perspective, BTC has printed a lower high and now a lower low on the daily timeframe. Until 72.9k is reclaimed on strong volume, rallies are technically corrective.
Bearish scenario:
Failure to reclaim 72.9k followed by compression below 68k would likely open a move back into the 60k liquidity zone. If that level fails to hold with conviction, a deeper retrace into the 52k to 55k region becomes structurally probable. That zone represents a more established support base and could serve as a stronger candidate for range formation.
Bullish scenario:
If BTC reclaims 72.9k quickly and consolidates above it, this breakdown could evolve into a bear trap. Sustained acceptance above that level would shift short term momentum and open a move toward 80k. Volume expansion and improving daily RSI structure would be needed to confirm this shift.
Momentum context:
Given the velocity of the breakdown, RSI is likely resetting from prior elevated levels. Often after impulsive selloffs, price either forms a sideways accumulation range or experiences a secondary flush into a more established support zone before a durable base forms.
Psychology wise, markets often seek a level where both buyers and sellers agree on value. The current zone lacks prior high time frame structure, which increases the probability of further probing lower to find stronger demand.
Conclusion:
BTC is in transition. The market is attempting to define a new equilibrium after losing range support. Unless 72.9k is reclaimed, risk remains skewed toward a deeper move into a more established support region before a sustainable range forms.

Bitcoin - good healfy Up trend - need long accumulationBitcoin - good healfy Up trend - need long accumulation
in this video i shared my local idea fro next weeks and algo global view

XRPUSDT – 1H timeframe...XRPUSDT – 1H timeframe.
🔍 Structure
Strong bullish impulse → then sharp rejection from ~1.60
Broke below short-term structure
Pullback failing under minor resistance (~1.48–1.50)
Trendline already broken
Price slipping toward lower cloud
Short-term bias: Bearish correction
📉 Sell Targets (Primary Scenario)
Current price around 1.45
🎯 TP1: 1.40
(previous support / liquidity)
🎯 TP2: 1.36
(strong horizontal demand – matches my marked zone)
🎯 TP3: 1.34
(major support / base of previous rally)
📈 Bullish Invalidation
If price reclaims and closes above:
1.50 – 1.52 (structure + cloud)
Then upside targets become:
1.55
1.60
📌 My View
Looks like a liquidity dump toward 1.36 area before any strong bounce.

BTC following 4 year halving cycle.Firstly we will dip to 43K which will be the bottom for current bear market. So and next target will be 215k ATH after 2028 halving. what do you think?

ETH Price Slice.Capital Sector — Market Psychology 1960.22 BPC 4© Bolzen | The Architect | BPC Framework
Bolzen Market Institute
🏷 ETH — Price Slice. Capital Sector.
Publication date on TradingView: 15.02.2026
🏷 1960.22 — at the time of publication, the price had not been reached.
🏷 BPC — The Bolzen Price Covenant — Strength Index: 4
The energy block reflects the intentions of capital. The direction of capital flow is determined dynamically. The key mechanism of liquidations lies in the tendency of price to gravitate toward areas where real participants of the system are concentrated — regardless of whether they are in longs or shorts.
Such zones represent areas of asymmetric advantage: when the price approaches them, some participants are forced to close positions at a loss, others lock in profits, and a third group (institutional players) uses this flow to enter in the direction of the next concentration zone.
Institutional players generate energy blocks through miners. Subsequently, these energy blocks form the range of capital movement across various timeframes for exchange speculators. However, the ultimate goal in ensuring liquidity is to reach the energy block mark.
The results are presented in the dashboard for the international arena. It is necessary to manually determine, without third-party software, the direction of the impact node and the concentration of real system participants. This is achieved through high cognitive and intellectual effort — without templates and solely through pure chart analysis.
Three-dimensional analytics is intellectual property. The methodology is closed and does not require evaluation from the standpoint of the old world. We offer the ability to think but do not provide trading recommendations and are not educators.
We thank you and regard TradingView as an impartial platform for demonstrating the transition into a new analytical reality.
Entry Point and Market Psychology
Quantum structure of obligations and capital movement in price formation within energy blocks.
🏷 Vertical chart — Energy Grid Dashboard.
🏷 Static tape No. 1: The price is published according to the production order of the energy block.
🏷 The energy block price is already ordered — not by time but by the priority of block execution. It is important not to confuse: block priorities dynamically reorganize in response to hidden energetic impulses, while the execution order of prices fixes their manifestation in the market. Each price in the dynamic tape is linked to energy production measurement indicators, unavailable to the general public. Those who see the structure before its manifestation do not follow the price — they anticipate it.
EΞ2Φ8Ψ45Θ·ζ⁻¹·106Λ732·Ω²
📎 Screenshot:
🏷 When trading from levels, use liquidation zones from BPC 10 and higher.
🏷 Bolzen Liquidity Map — ETH (numerical equivalent of the map):
Updated versions of the Bolzen Liquidity Map — ETH are in restricted access.
The permanent Energy Grid Dashboard for ETH and BTC is publicly available and intended for international institutional review.
Dear international community,
I thank the TradingView moderation for their neutrality and support of analytical work on a global scale, as well as everyone who follows my research. This platform serves as a space to demonstrate the contribution to analytical development.
Attention and time are your key resources. ATH — is emotion; timeframes — are your best allies. Thank you.
— The Architect
BPC — The Bolzen Price Covenant

GBPJPY next MoveGBPJPY on the 4H timeframe has delivered a clean bearish market structure shift after failing to hold above the prior demand zone, with strong impulsive selling breaking support and confirming sellers in control. The sharp rejection from the upper range followed by continuation candles signals distribution and bearish momentum, while the current consolidation below broken support suggests a classic pullback before potential continuation lower, keeping downside liquidity and previous lows in focus. Fundamentally as of 15 Feb 2026, the pair is pressured by risk-off sentiment, steady Japanese yen demand as a safe haven, and ongoing uncertainty around UK economic growth, inflation trajectory, and Bank of England policy expectations, while yen strength is supported by shifting yield dynamics and cautious global outlook. As long as price remains below the broken support zone, bearish continuation setups, pullback sells, and trend-following strategies remain favored, aligning technical breakdown with macro-driven momentum for high-probability downside opportunities.

WTI Crude Oil Accumulating at Demand Zone
On the 1-hour timeframe, price recently experienced a sharp bearish drop and tapped into a strong demand zone around **62.00–62.40**. After the selloff, the market shifted into a tight consolidation range, showing reduced volatility and seller exhaustion — a typical accumulation behavior.
The Ichimoku cloud above price is flattening, indicating momentum loss in the downtrend. Meanwhile, structure suggests buyers are defending the demand area, forming a base. If price holds this zone, a bullish reaction toward the marked **64.00 target point** becomes likely, aligning with previous structure resistance.
Overall bias: **short-term bullish correction from demand support**.

Bitcoin Sunday Analysis $BTC is trading inside the range,Bitcoin Sunday Analysis
CRYPTOCAP:BTC is trading inside the range, as mentioned in the last update. For any recovery, price must break and hold above 72k. If that happens, a move toward 80k–85k becomes possible. Below 100k, the market structure already confirms a bear market, so this price action is expected. The active accumulation range between 54k and 72k is now in play. Trading the range makes sense here, buying near the lows and selling near the highs. This is range trading, not long term accumulation.
Key levels remain clear. The buy zone is 54k–60k, which represents the local bottom of the range, not the macro bottom. The sell zone is 72k–85k. If price reaches the weekly 99 EMA near 85k, I may add additional short positions and will update if that setup develops. It is important to understand that 54k–60k is only a local bottom. The true bear market bottom is expected lower, around 45k–50k, where major long term positions will be built.
Regarding strategy, I am holding a short position that was opened near 97k, with the average entry around 104k. I closed 50% of the short at 72k and opened a long at that level, but BTC failed to hold and dropped toward 60k, where I added more to the long, bringing the average long entry to around 67k. After the recovery, I closed 50% of the long position. I am currently holding the remaining short and may add more shorts in the 80k–85k region. On the long side, I will look to add more exposure again in the 60k–54k zone.

XRP H4 Buy | Consolidation 1.3764 → POC 1.5800 | Risk ManagedXRP is currently moving in a consolidation phase on the H4 timeframe, and demand is forming around the 1.3777 level. This area provides a potential buy setup.
Entry Zone: Around 1.37764 (Demand area)
Stop Loss: Below the consolidation range
Target 1: POC line at 1.5800
If an H4 candle closes strongly above the POC level (1.5800), the next target will be the buy-side liquidity (BSL) zone.
The market is still ranging, so patience and proper risk management are essential.
Disclaimer:
This analysis is for educational purposes only and does not constitute financial advice. Trading involves risk, and you should always use proper risk management. Past performance does not guarantee future results.

Bitcoin Faces Key Inflection at 0.618 Fibonacci Bitcoin price action on the intraday timeframe has staged a rebound after putting in a local low near the value area low of the current trading range. This bounce reflects a technical reaction from support rather than a clear shift in trend, as price has now rotated higher into a key Fibonacci region. BTC is currently trading just below the 0.618 Fibonacci retracement, slightly front-running this level as momentum begins to stall.
This area represents a major inflection point. In the short term, holding around the 0.618 Fibonacci could allow for a final push higher into high-timeframe resistance near the $72,000 level. Such a move would likely act as a liquidity-driven spike rather than a sustained breakout, especially given the broader context of the market.
Importantly, the current rally has occurred on declining volume. The lack of strong bullish participation suggests the move higher may be corrective in nature rather than the start of a new impulsive leg. In bearish or corrective environments, low-volume rallies into resistance often precede continuation to the downside.
From a technical and price action perspective, Bitcoin remains vulnerable at current levels. Unless the rally is backed by a clear expansion in volume and acceptance above resistance, the probability favors a rejection and a continuation of the broader downtrend after any short-term upside attempt.

BTCUSDT (Bitcoin): Buy setupBTCUSDT (Bitcoin): Buy setup. I expect a short term bullish move before another huge bearish move.
Cheers

Changing markets —Bitcoin is headed towards a new all-time highAll the growth from late 2024 and 2025 has been deleted. Bitcoin performed a full correction and is now back trading within a consolidation range that was active for 245 days in 2024, 8 months.
This means back to zero. A correction cannot correct more than 100%, not on Bitcoin.
Bitcoin opened 2025 at $93,456 then peaked at $126,219, a total of 35% growth. Meager for Bitcoin. The bull market was in 2024. 2025 closed red. 2026 is starting red. Bitcoin has never closed more than one year red.
So far Bitcoin has four red years in its history: 2014, 2018, 2022 and 2025.
2026 is still very young. Market conditions changed. The year is young and started red, it is set to close green.
It is possible that Bitcoin will produce a new all-time high in 2026. Do you agree?
Maybe the all-time high shows up in 2027, that's ok. My point is that the bear market is over.
Remember, "bear markets will become shorter while bull markets will become longer." The Cryptocurrency market will continue to grow and evolve.
Bitcoin cannot behave in the same way when it is worth 2 trillion as when it was worth 200 billion, this doesn't make sense at all.
It is the first time Bitcoin produces a triple-top and it will also be the first time that a correction is really short.
A 50% correction is already a massive event. You want more? Remember, Bitcoin is hotter than hot bread. It is the most sought out investment in the whole world. Nobody will let it crash a second time, there is just too much demand; we are going up.
Get on board the bullish train; some altcoins have been rising for months.
Many altcoins are set to hit a new all-time high, will Bitcoin be left behind? Bitcoin cannot be left behind, what one does, the rest follows.
Namaste.

How to interpret the current movement
Hello, fellow traders!
Follow us to get the latest information quickly.
Have a great day.
-------------------------------------
The key points to watch are the HA-Low indicator and the DOM (-60) indicator.
If the HA-Low and DOM (-60) indicators provide support, then that's a good time to buy.
Accordingly, the key question is whether the price can rise after finding support in the 68687.84 ~ 70580.26 range.
-
The StochRSI 20, 50, and 80 indicators are displayed on the chart because they provide useful information for detailed trading.
The StochRSI indicator can also be viewed as an indicator that reverts to its mean based on the 50 level.
Therefore, we need to carefully monitor the trend when the StochRSI crosses the 50 level.
While the StochRSI indicator is typically interpreted based on when it enters or exits overbought or oversold levels, this provides useful information when interpreting auxiliary indicators.
Currently, the order is StochRSI 20 > StochRSI 80 > StochRSI 50.
In other words, to break out of the low zone (oversold zone), the StochRSI must rise above the 20 level. Therefore, ultimately, we can see that the StochRSI must rise above the 20 level (75719.90).
However, the StochRSI 80 level is formed at 71453.53, indicating that a short-term peak has been formed.
This suggests that the current trend is likely a rebound from a downtrend.
Even if the StochRSI rises above the 80 level, if it fails to rise above the 20 level, it is highly likely that the price will eventually decline.
However, if the price remains above the StochRSI 50 level, the upward movement may trigger a change in the positions of the StochRSI 20 and StochRSI 80 indicators, potentially signaling a continued uptrend. Therefore, it's important to monitor whether the price can remain above the StochRSI 50 level (70130.00).
-
To break above a key point or range and continue the uptrend, the StochRSI, BSSC, and OBV indicators must show upward trends.
If possible,
1. The StochRSI indicator should not enter the overbought zone.
2. The BSSC indicator should remain above the 0 level.
3. The OBV indicator should remain above the High Line.
When the above conditions are met, the uptrend is likely to continue.
The current behavior of these auxiliary indicators indicates that the conditions for a sustained uptrend are not yet met.
Therefore, when support is found near the 68,687.84 ~ 70,580.26 range, we should examine whether the above conditions are met.
-
Summary of the above:
1. Support range: 68,687.84 ~ 70,580.26
2. Beginning of a full-blown short-term uptrend: 75,719.90
3. Volatility range: 71,453.53 ~ 75,719.90
Therefore, if support is found at the support range and the trend reverses while moving sideways in the volatility range, we can interpret this as indicating a potential continuation of the uptrend.
Since indicators change position over time, their interpretation may vary depending on the position at the time of the change.
-
Thank you for reading to the end.
I wish you successful trading.
--------------------------------------------------

ETH — Price Slice. Capital Sector. 1651.59 BPC 13© Bolzen | The Architect | BPC Framework
Bolzen Market Institute
🏷 ETH — Price Slice. Capital Sector.
Publication date on TradingView: 17.02.2026
🏷 1651.59 — at the time of publication, the price had not been reached.
🏷 BPC — The Bolzen Price Covenant — Strength Index: 13
The energy block reflects the intentions of capital. The direction of capital flow is determined dynamically. The key mechanism of liquidations lies in the tendency of price to gravitate toward areas where real participants of the system are concentrated — regardless of whether they are in longs or shorts.
Such zones represent areas of asymmetric advantage: when the price approaches them, some participants are forced to close positions at a loss, others lock in profits, and a third group (institutional players) uses this flow to enter in the direction of the next concentration zone.
Institutional players generate energy blocks through miners. Subsequently, these energy blocks form the range of capital movement across various timeframes for exchange speculators. However, the ultimate goal in ensuring liquidity is to reach the energy block mark.
The results are presented in the dashboard for the international arena. It is necessary to manually determine, without third-party software, the direction of the impact node and the concentration of real system participants. This is achieved through high cognitive and intellectual effort — without templates and solely through pure chart analysis.
Three-dimensional analytics is intellectual property. The methodology is closed and does not require evaluation from the standpoint of the old world. We offer the ability to think but do not provide trading recommendations and are not educators.
We thank you and regard TradingView as an impartial platform for demonstrating the transition into a new analytical reality.
Entry Point and Market Psychology
Quantum structure of obligations and capital movement in price formation within energy blocks.
🏷 Vertical chart — Energy Grid Dashboard.
🏷 Static tape No. 1: The price is published according to the production order of the energy block.
🏷 The energy block price is already ordered — not by time but by the priority of block execution. It is important not to confuse: block priorities dynamically reorganize in response to hidden energetic impulses, while the execution order of prices fixes their manifestation in the market. Each price in the dynamic tape is linked to energy production measurement indicators, unavailable to the general public. Those who see the structure before its manifestation do not follow the price — they anticipate it.
EΞ2Φ8Ψ45Θ·ζ⁻¹·106Λ732·Ω²
📎 Screenshot:
🏷 When trading from levels, use liquidation zones from BPC 10 and higher.
🏷 Bolzen Liquidity Map — ETH (numerical equivalent of the map):
Updated versions of the Bolzen Liquidity Map — ETH are in restricted access.
The permanent Energy Grid Dashboard for ETH and BTC is publicly available and intended for international institutional review.
Dear international community,
I thank the TradingView moderation for their neutrality and support of analytical work on a global scale, as well as everyone who follows my research. This platform serves as a space to demonstrate the contribution to analytical development.
Attention and time are your key resources. ATH — is emotion; timeframes — are your best allies. Thank you.
— The Architect
BPC — The Bolzen Price Covenant

ETH — Price Slice. Capital Sector. 1653.90 BPC 12© Bolzen | The Architect | BPC Framework
Bolzen Market Institute
🏷 ETH — Price Slice. Capital Sector.
Publication date on TradingView: 17.02.2026
🏷 1653.90 — at the time of publication, the price had not been reached.
🏷 BPC — The Bolzen Price Covenant — Strength Index: 12
The energy block reflects the intentions of capital. The direction of capital flow is determined dynamically. The key mechanism of liquidations lies in the tendency of price to gravitate toward areas where real participants of the system are concentrated — regardless of whether they are in longs or shorts.
Such zones represent areas of asymmetric advantage: when the price approaches them, some participants are forced to close positions at a loss, others lock in profits, and a third group (institutional players) uses this flow to enter in the direction of the next concentration zone.
Institutional players generate energy blocks through miners. Subsequently, these energy blocks form the range of capital movement across various timeframes for exchange speculators. However, the ultimate goal in ensuring liquidity is to reach the energy block mark.
The results are presented in the dashboard for the international arena. It is necessary to manually determine, without third-party software, the direction of the impact node and the concentration of real system participants. This is achieved through high cognitive and intellectual effort — without templates and solely through pure chart analysis.
Three-dimensional analytics is intellectual property. The methodology is closed and does not require evaluation from the standpoint of the old world. We offer the ability to think but do not provide trading recommendations and are not educators.
We thank you and regard TradingView as an impartial platform for demonstrating the transition into a new analytical reality.
Entry Point and Market Psychology
Quantum structure of obligations and capital movement in price formation within energy blocks.
🏷 Vertical chart — Energy Grid Dashboard.
🏷 Static tape No. 1: The price is published according to the production order of the energy block.
🏷 The energy block price is already ordered — not by time but by the priority of block execution. It is important not to confuse: block priorities dynamically reorganize in response to hidden energetic impulses, while the execution order of prices fixes their manifestation in the market. Each price in the dynamic tape is linked to energy production measurement indicators, unavailable to the general public. Those who see the structure before its manifestation do not follow the price — they anticipate it.
EΞ2Φ8Ψ45Θ·ζ⁻¹·106Λ732·Ω²
📎 Screenshot:
🏷 When trading from levels, use liquidation zones from BPC 10 and higher.
🏷 Bolzen Liquidity Map — ETH (numerical equivalent of the map):
Updated versions of the Bolzen Liquidity Map — ETH are in restricted access.
The permanent Energy Grid Dashboard for ETH and BTC is publicly available and intended for international institutional review.
Dear international community,
I thank the TradingView moderation for their neutrality and support of analytical work on a global scale, as well as everyone who follows my research. This platform serves as a space to demonstrate the contribution to analytical development.
Attention and time are your key resources. ATH — is emotion; timeframes — are your best allies. Thank you.
— The Architect
BPC — The Bolzen Price Covenant

BTC / LONG / 16.02.26Entry reasons:
4-hour liquidity sweep within the daily bullish imbalance
Inversion 1-hour bearish imbalance
30% retracement of the bearish impulse
Additional confluences:
Liquidity sweep below support followed by a fast reclaim → sellers couldn’t hold lower prices.
Price reclaimed a key level and is holding above it → bullish acceptance.
Signs of absorption on the dump (order book depth/bids step in) → sell pressure gets absorbed.
Liquidations spike + open interest drops (Velo) → deleveraging move, often followed by a bounce / squeeze.
CVD doesn’t confirm the sell-off (stabilization/divergence) while price recovers → sellers are getting exhausted.
Heatmap shows a clear demand zone as the base, with liquidity magnets above → upside pull.
cvd
cluster
heatmap
order book
liquidations

Bitcoin first short-term support above $58kBitcoin is holding the first short-term support (above $58k major support) pretty well. This could be signaling the attempts at 58k are over.
We'll know more when it hits the first resistance here just over $74k. If that breaks then it's likely we're starting the uptrend back up to $117k. If this $67k support breaks then look for 58k to double bottom. Usually you'd expect resistance above to hit a few times to verify we're going back down though.
Good luck!

BTC/USDT — Weak Bounce Structure: Continuation Risk Remains✔️ The week closed with a red candle.
Positive: small body with a long lower wick.
Negative: still not a confirmed reversal setup.
🟢 Price paused its decline at the support block — buyer reaction is visible.
🟢 RSI is extremely oversold on higher timeframes.
🟠 Structural shifts driven by AI are reshaping global markets, increasing overall volatility.
🟠 Extreme fear persists.
🔴 Each rebound peak is lower than the previous one — a potential continuation pattern is forming.
🔴 Both institutional and retail flows continue selling crypto ETFs.
🔴 Negative cumulative delta: –$1.22B.
🧠 There is visible FOMO from those who missed BTC at 60k.
Given that, I expect either a reversal higher in the 62–65k zone,
or a breakdown below 60k, followed by consolidation and possibly a squeeze before reversal.
A clean re-entry at 60k may not be offered again.

GBPCHF to climb?GBPCHF waiting for confirmations from Price Action to go in LONG. At least for a scalp or Day Trade until we see a MTR.
