Bitsounis / BTC1! - When does the trend change?Good evening everyone so far as we mentioned it has made a good reaction but let's take a closer look at how the price can move and when the climate can change.
📌The basic plan at the moment
The basic plan at the moment based on the trend is bears.
The goal is the OPEN GAP at the $80,000 levels but also at the high resistance that exists and the price to move sideways downwards with the next possible entey at $55500.
😅The positive scenario but unfortunate based on the trend does not have enough chances, is to go back to the $80,000 levels which is the gap to make a retest at fib lvl and break $88,000 in a long time frame.
As you will see in the image above the CPR of the month.
Bitcoin Futures

bitcoin expands to 751kgood morning,
a small retracement over the last few days has sent 95% of the market into total panic mode.
these are the times to be buying, when others are terrified beyond belief, running for cover.
---
i predict btc is going to enter into a multi-month- parabola once the previous all the high is properly tested. we don't particularly have to tap the previous all time highs, just gotta hold my green box to confirm expansion.
---
often times, extreme fear + miner capitulation create major bottoms, and this time is no different. while retail panic sells their entire bag and exits crypto, there are large entities purchasing everything. don't take my word for it, just see the data yourself 👇
---
gold was in a similar situation not too long ago, i'm sure you remember it yourself. the same kind of feeling you are experiencing today relative to the crypto cycle (structurally speaking). historically, gold runs first, while crypto lags behind it by many months. in all the previous occurrences where gold ran first, crypto ended up outperforming ten fold after.
---
my prediction here is very contrarian during these times, and it could be difficult to believe that this is exactly how it's going to play out, so i'm going to add a few more pieces of evidence to back up my theory.
---
in previous cycles, btc did not top until the business cycle topped 👇
---
in previous cycles, when dxy broke beneath 97, it triggered end of cycle crypto expansions. we are currently testing the last of supply at 97 before the next leg down 👇
---
i believe this final phase will cause btc dominance to drop rapidly as money aggressively rotates into emerging tech in the alt coin ecosystem. we refer to this occurence as "alt season". not all alt coins will perform equally. focus on emerging tech above all else and don't get shaken out. this is the final test of conviction, and only the strongest hands will make it through this.
---
🎯 = 751k

the chart doesn’t care about your fear.( repost, original post on my old account: @notoriousbids )
---
this is not your average joe count.
i’m not telling you that btc is going to 185k.
the chart is.
out here, we close our eyes, take a breath to clear the mind, and when our eyes open, we look at what is in front of us without bias.
the chart in front of me looks very constructive. from the lows at $15,460, btc appears to have advanced in a clear three wave move. wave three just printed an extension, which is common in crypto. if you look closely, the sub-waves of wave one and wave four show no overlap. sub-wave one itself extended, giving wave three a contracting appearance, but this was not a contraction. this was a manipulated pause, designed to re accumulate supply during wave four.
while you sell and flip bearish, there are entities out there with capital that dwarfs the entire market cap of your bitcoin, quietly absorbing every coin you are willing to give up at these discounted levels.
---
wave fours are notorious for producing fear, uncertainty, and doubt. however, we have something on our side that neutralizes that noise completely. it is called the law of alternation.
in elliott wave theory, the law of alternation states that if wave two is flat, wave four will be sharp (and vice versa). that is exactly what played out. wave two in 2023 was flat and corrective by nature, which opened the door for the sharp wave four we have been experiencing in the modern day.
---
during this sharp wave four, a significant hidden bullish divergence formed between the wave two low and the wave four low, as shown on the chart. this hidden bullish divergence exists across multiple timeframes and on several oscillators, even on the monthly scale. that alone suggests that my 185k upside target may actually be conservative.
don’t ask me how high i think this can go.
the answer will sound unreasonable to anyone still anchored to fear.
---
🎯 = 185k

Long term BTC viewThis view is for the next +1Y or less, where I could see a BTC long term bottom get hit before another major run.
Plus is looking like a classic H&S where the clean invalidation of all this thesis will be the break above ORANGE LINE (101020$) with momentum.

can bitcoin drop to 38k?gm,
this post is a contrarian idea.
---
what if the top was in?
what if the 4 year cycle is just that,
a 4 year cycle.
what if the business cycle doesn't re-accelerate until a year from now?
---
well,
let me tell you what would happen (based on my research).
btc would see a bleed out. it won't be fast, it'll be slow and controlled.
underwhelming deadcat bounces into trapped sellers who just want to exit at breakeven
followed by waterfalls, on repeat.
we continue this type of price action until we hit a value area for long term holders,
which currently sits below 40k.
---
tough to predict exactly how low this could go,
so i'll simply say:
🎯 = sub 40k

bitcoin explodes to 750kgood evening,
before i share my idea -
i'd like to share a disclaimer:
what i'm about to say will undoubtedly trigger you.
---
the way metals are rallying all of a sudden,
re-sparks my original bull case from many years ago.
the bull case essentially is pretty simple.
the macro bull trend is not finished yet,
and btc is in the final 5th wave of the 5 wave impulse.
the estimated upside target sits at 753k,
but it could in theory go significantly higher.
---
the last time gold and silver had comparably strong rallies was in 2020.
shortly after, btc explosively ran like 10x, followed by one of the most insane altseasons ever.
it might feel hard to imagine right now,
but i wouldn’t be surprised if something similar plays out next year.
funny how all the signs are there,
yet most people are still in complete disbelief.
---
note: there is also a chance that wave 5 is in.
so if we fail to spark this rally which i portray,
it would imply that the grand cycle top could be in.
it is important to entertain both scenarios,
but it's equally important to keep a very open mind during these times.
---
the cycle has thus far has felt very far from regular, so we must treat it differently than we would previous cycles. the main reason for these changes is because of who the new market participants are (institutions) - they're not playing on a 4 year timeline, they're playing in decades.
---
🎯 = 753k

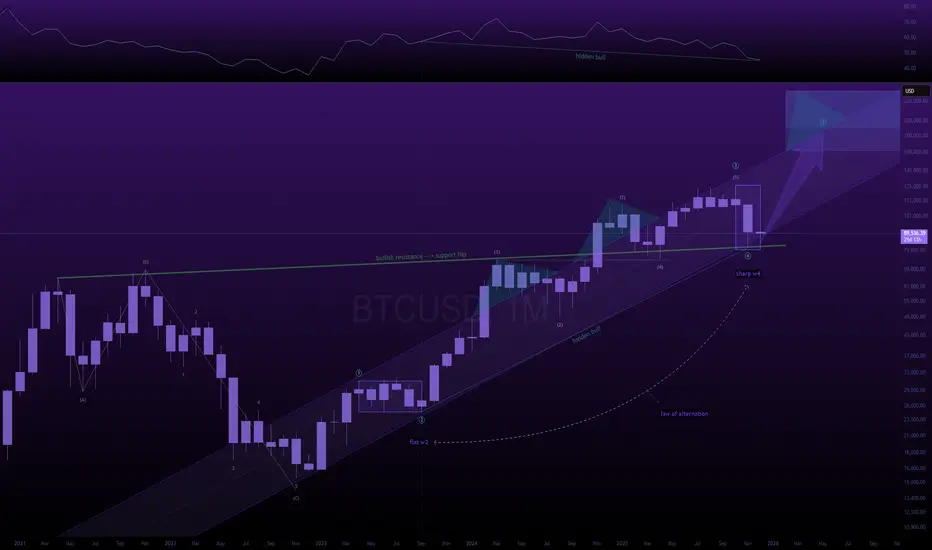
here's how bitcoin reaches 185k part 2.good morning,
in my last btc post i promised you my macro btc analysis if the post reached 5 likes,
so here you are.
---
the count is extremely simple;
from the 2022 bear market lows, btc has come up quite impulsively.
i label the entire leg from september 2023 -> october 2025 as a wave (3).
if you look closely, none of the waves overlap in this leg.
sure it might have an unconventional look, but it's not invalid by any technical standards.
---
if i'm correct with my analysis, wave (5) should see an equal appreciation as the length of wave (1) - could become slightly longer, too. usually in cases such as this, you can measure the distance of wave (1) and project it out from the bottom of wave (4);
> look for 100.00% - 123.60% - 161.80% extensions.
this puts the average upside target between 161k - 248k
---
we have had a sustained reading of extreme fear almost all month.
btc is at the bottom of the bullish pitchfork.
most people have given up hope. (bullish contrarian signal)
business cycle has yet to top.
fed man stopped quantitative tightening and has hinted at a balance sheet expansion.
aggressive rate cuts.
monthly hidden bullish divergence present between wave (2) and wave (4) pivot lows.
we are flipping previous cycle highs into support (horizontal support).
bitcoin capitulation metric has hit an all time high this cycle (each one has marked a major low).
---
all of this leads me to believe that we are not finished with the current bull trend.
---
🎯 = 185k
BTC CME GAP (4H)Bitcoin has a CME gap in the $89,805 – $89,425 range
These gaps are usually filled before the price makes its next move.
Let’s see what happens.
For risk management, please don't forget stop loss and capital management
Comment if you have any questions
Thank You

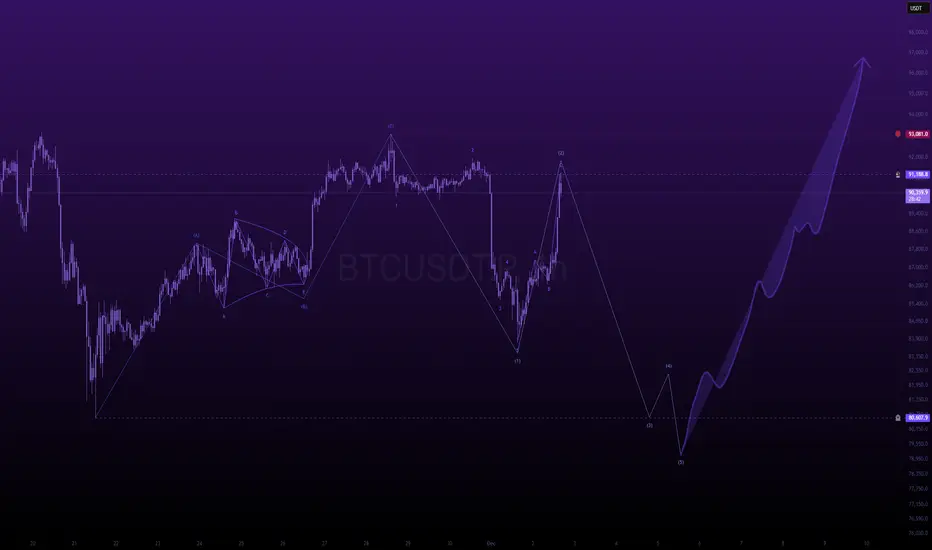
max pain in sight for the bullsgm,
i've been entertaining a few ideas on btc, and this one comes to mind today.
the possibility of 1 more leg down, to take the rest of the longs that fomoed into the rally this week, and the few who managed to survive the drop from ath by averaging down mindlessly.
---
the way we bounced is very reminiscent of a wave 4.
btc is teethering on the edge of a negative funding rate (our favorite contrarian indicator)
by creating one more low, we will for certain print a massive, multi-week negative funding reading, and that's when a proper buy could take place.
---
i have personally decided to fade the rally, and have de-risked quite substantially from the positions i managed to pick up near the lows.
---
in my opinion, the path of maximum pain is a sweep of that notorious 75k level that everyone keeps talking about.
---
---
🎯 - 75k

you're not bullish enough, but neither am i.next 48 hours are key.
i believe btc raids 80k with force to stop out everyone who fomo'd into the move over the last 2 weeks in this current range.
typical wyckoff accumulation behavior.
create a range, make it look like we're going to breakout, and then sweep the lows, taking everyones position before the real breakout.
---
fakeout
then
breakout.
---
some elliott wave terminologies,
from nov 21st low btc came up in a bearish 3 wave move peaking last friday.
from there it came down in a clean impulsive wave to the downside.
yesterday we were skeptical about it and entertained multiple scenarios,
but after some further thought, i conclude my statement by saying
it does indeed look impulsive, and there is a 95% chance we sweep 80k before attempting to bombrush 185k.
---
🎯 = 80k into end of week.
btc taps 185kgm,
i'm projecting an upside target of 185k for btc. this upside target should in theory be the top of our current bull cycle, the final fifth wave of the impulse which begun back in 2022.
for us to reach 185k, we must remain above last weeks low.
we also have to sweep the all time highs, to invalidate any bear scenarios which are around.
---
sentiment is quite bleak,
many people have given up
many people think we are in a bear market.
my personal upside target sits at 185k, and i'm very bullish on crypto until then.
----
ps. if this post gets 5 likes, i will share my detailed macro bull case for btc.

185kthis is the last post i will ever make on this account. after today, i will be discontinuing the usage of this account in perpetuity. it will remain a relic of sorts.
---
gm,
many of you remember me as eloquent trades, or elo. i come today with one final post for you before i disappear onto the dark side of the moon.
---
i predict the bitcoin rally is not yet finished,
i believe we have one final leg up to go
my upside target sits at $185k this cycle.
---
once 185k has been attained, i predict a crash like we've never seen before, one that defies logic, one that takes everything away, from anyone associated with this market.
---
ps. this is not financial advice, this is merely a theory-craft, the final one on this account.
farewell
🌙

Bitcoin Holds 90k (For Now), 70k A Real PossibilityMy bearish bitcoin target outlined in the middle of October came to fruition this week. I update my levels and technical reasoning as to how it could still head for 70k after a potential bounce.
Matt Simpson, Market Analyst at City Index

Bitcoin Bounce Underway, But Bears May Not Be Done YetMy initial 100k downside target has been reached. While we’re seeing the almost obligatory bounce from a key level, Bitcoin could still head towards 90k. I take a fresh look at Bitcoin futures and their correlation with Wall Street.
Matt Simpson, Market Analyst at City Index

Bitcoin – Technical Outlook
🔹 Key Zone: 101,500 – 104,500
At the moment, price is trading within this key zone where strong buying and selling activity is taking place — a critical area that will likely determine the next major move.
🟢 Bullish Scenario (Uptrend)
If price breaks above and holds above 104,500, this would confirm a continuation of bullish momentum.
In that case, price is expected to move higher toward 120,040, with further potential extension toward 125,567.
📈 This zone is an important confirmation area that could signal the beginning of a new bullish leg.
🔴 Bearish Scenario (Downtrend)
However, if price drops below and stabilizes under 101,500, this would indicate a potential bearish reversal.
In that case, the price may move downward toward the support zone at 97,700 – 93,400.
Breaking below this area would confirm further bearish extension toward 88,080.
📊 Summary:
Currently, Bitcoin is trading inside the key zone (101,500–104,500).
A breakout above or below this range will likely define the next strong market direction — whether a bullish continuation or a deeper bearish correction.

Why I'm Suspicious Of This Bitcoin BounceThe rebound in bitcoin I warned about last week has come to fruition. Yet despite its recovery above the 200-day EMA, I remain bearish on the higher timeframes. Looking at bitcoin futures, I explain why I think bears are lurking above and may be happy to fade into rallies towards 120k.
Matt Simpson, Market Analyst at City Index and Forex.com

Bitcoin Needs To Roll Over Soon To Avoid Short-Covering RallyWhile I believe Bitcoin still has further downside potential in the coming weeks, there’s also scope for a near-term bounce based on how futures traders are currently positioned.
Matt Simpson, Market Analyst at City Index and Forex.com.

Bitcoin Bulls Eye Bounce, Though Bears Could Be Lurking AboveUsing correlations with Wall Street indices, I outline why I think Bitcoin could be in for a bounce - though its rally could be limited before new lows are seen.
Matt Simpson, Market Analyst at City Index and Forex.com

$BTC Sunday Report Bitcoin touched 116.6K CRYPTOCAP:BTC Sunday Report
Bitcoin touched 116.6K right where we expected, and I’m still holding my short position with eyes on lower targets. If price pushes into the 120–125K zone, I’ll add more there.
We already saw a dump from 116K to 107K three weeks ago, and now BTC has returned to the 116K zone, but this hasn’t changed the overall picture. Market makers continue to push altcoins higher to trap liquidity before the real move down.
⚠️ The FOMC meeting a key event, with the policy statement scheduled for Sep 17 at 18:00 UTC, followed by a press conference at 18:30 UTC. Regardless of whether the Fed cuts rates or not, I expect the market to remain bearish as liquidity is still being engineered for a larger downside play.
Added more at 116.6K (average entry now around 115.5K)
Will add again if we revisit 120–125K
Targets stay the same at 105K → 100K → 95K → 90K

Statistical Research. BitcoinToday we will touch upon such type of analysis as seasonal patterns in Bitcoin
Bitcoin seasonality is cyclical patterns in its price dynamics, repeating in certain calendar periods (months, weeks, days). These patterns are formed under the influence of many factors:
1. Halving
Historically, Bitcoin's four-year cycles tied to halvings (halvings of the mining reward) have been a key driver of price highs. Bullish rallies peaked approximately 1060 days after the previous cycle bottom.
At the same time, changes have already begun to occur in these statistics:
According to some Research notes that the impact of halvings on the Bitcoin price has significantly decreased:
- Bitcoin is increasingly responsive to global macroeconomic factors such as inflationary pressure, geopolitical tensions, and monetary policy (especially the US Federal Reserve). This pushes purely internal factors, such as halving, into the background
- Characterizes Bitcoin as a transition from a "speculative reflexive asset" to a more established "reactionary store of value"
2. Macroeconomic events (changes in interest rates, inflation)
It is necessary to remember that Bitcoin is not a defensive asset, as some call it, but belongs to the category of risk-on assets.
Therefore, it, like risk assets, is affected by inflation and interest rates, primarily in the US.
Since the price of risky assets is very strongly influenced by the Fed's policy, very strong fluctuations will occur not even on the fact of changing interest rates from the Central Bank, but on the outgoing macroeconomic indicators, which, in the opinion of market participants, the Central Bank (the Fed, the ECB, etc.) will look at.
3. Institutional activity.
The creation of Bitcoin ETFs is beginning to have a strong impact on the BTC spot market. For example, by the third quarter of 2025, American Bitcoin ETFs attracted $118 billion inflows. BlackRock's IBIT alone manages assets worth $50 billion
Corporations have begun to buy cryptocurrency: MicroStrategy and Tesla.
4. News related exclusively to the cryptocurrency market and transactions with them. For example, network updates.
Now we move on to statistical models:
The strongest months in Bitcoin: March, October
Weak months: August and September
This does not mean that every code the market will grow in March and October, and fall in August. This note can help in combination with other types of analysis.
Best days for Long:
February 1, February 14, March 26, September 22, October 29, November 29
Best days for Short:
February 13, April 17, June 18, July 5, August 2, October 2
Also note that these are average statistics. At the very least, it is necessary to know them.
5. Flow of funds within the cryptocurrency market:
Bitcoin, as the main cryptocurrency, dominates at the beginning of the bull market, then capital moves to altcoins
What we have now:
Analytical companies draws attention to the ongoing outflows from spot BTC ETFs
Also according to these studies, the peak may already be reached in this cycle
We also pointed out in another post about the S&P500 that statistically we are entering a weak period.

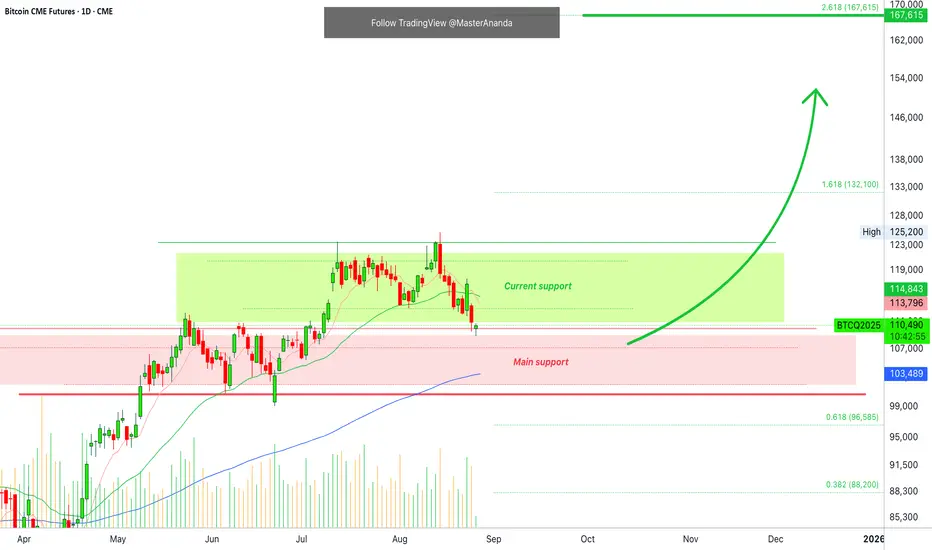
Bitcoin 8X LONG Chart Setup · 330% Profits PotentialWe have two support zones neatly depicted on the chart; green and red. Red is the main support zone, the range between $100,000 and $110,000, while green is the bullish zone support zone between $110,000 and $120,000.
BTC1! is trading within the bullish zone, above $110,000 after a strong monthly higher low, vs 22-June. Volume is standard for a continuation of the broader long-term bullish move. That is, even with short-term swings and price fluctuations Bitcoin is set to continue growing.
Because I believe firmly that Bitcoin will continue to grow, here I am showing you some numbers with mid-term goals.
The final target on this signal I believe is not the last target for the current run, but there is strong resistance at this level so we can always go out to comeback in, or adapt to your own liking since we are all adults.
I give you a great entry with great prices and timing, you take care of the rest. The market is here to bless us with growth, profits and success.
Full trade-numbers below:
______
LONG BTCUSDT 8X (PP: 330%)
ENTRY: $100,000 - $111,000 (STOP: $98,200)
TARGETS: $122,000, $137,000, $155,600
______
Thank you for reading.
Your support is highly appreciated.
Namaste.
Bitcoin Goes Bullish · Altcoins Market Resumes GrowingBitcoin and the altcoins market is about to perform one of those surprise moves that it really loves, a huge major advance; we are going up.
How are you feeling in this wonderful new week my friend?
I am happy to have your attention. Please, continue reading below and let me know in the comments what you think about this analysis.
The markets are open, people are trading, buying and selling while prices are rising. Bitcoin is no longer going down and the retrace was very small. The total drop so far amounts to less than 10%, but it is wise to consider that the current range is not $110,000 to $120,000 but $100,000 to $120,000. It is a wide range.
The new all-time high is not a major new level but instead a double-top compared to mid-July. Seeing how a double-top made no impression on the bears, seeing how the market continues super strong, we can easily predict that the bull market is not over and Bitcoin will continue to grow. What about Litecoin?
Chainlink is no longer trading at bottom prices but it has plenty of room available for growth. It is not at the bottom but certainly not a new all-time high either. The same for Cardano. Will it stop growing and enter a bear market when it was already doing so great? No, it will continue growing long-term.
Hedera also grew nicely and a small portion of the market is in the same boat. The bigger part though is still trading near support but not for long. August is the last chance to get those still behind while prices are still low. The fact that many projects are ahead, high up, confirms where the market is headed.
If you think a few years back, everything was down including Bitcoin.
If you think last year, everything was down but Bitcoin.
If you see how the market is doing now, many projects are very strong and growing. This reveals what is coming to the rest of the market.
First one, then two, then six, then twenty and then everything grows.
Bitcoin is about to make a surprise move... The entire market is set to grow.
Namaste.

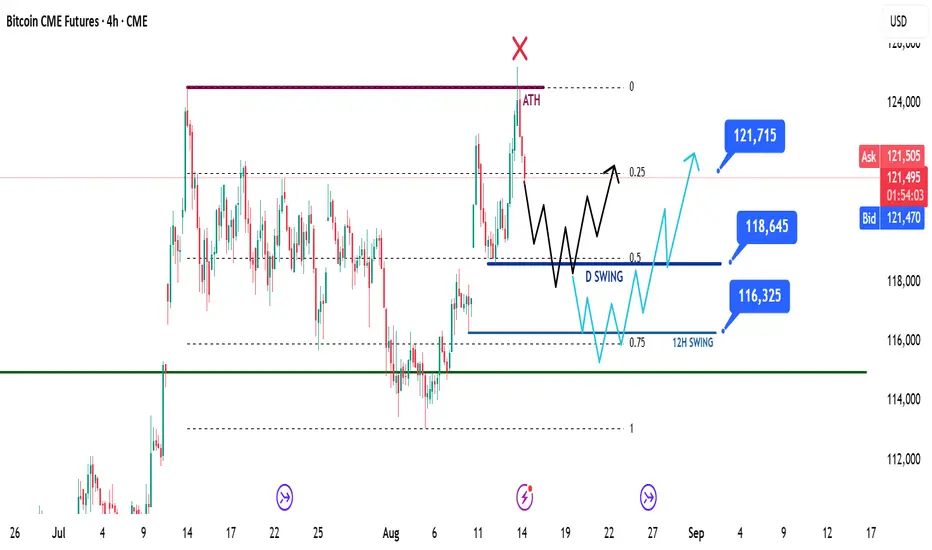
BTC Daily Recap & Game Plan 14.08.2025BTC Daily Recap & Game Plan 14.08.2025
📊 Market Sentiment
Overall sentiment remains bullish, supported by expectations of a 0.25% rate cut in the upcoming FOMC meeting. A weakening USD and increasing global risk appetite are providing favorable conditions for further upside in crypto assets.
📈 Technical Analysis
Price ran to all-time highs and faced rejection there.
The close below the all-time high level indicates that price may now seek opposite-side liquidity (buyers).
Historically, Bitcoin often consolidates within a range after running all-time highs, collecting more liquidity before continuing upward.
📌 Game Plan
I expect two possible scenarios:
1️⃣ Run the daily swing low and hit the equilibrium of the range at $118,645, then bounce and move up towards $121,750.
2️⃣ Run the 12H swing low and hit the 0.75 level of the max discount range at $116,325, then bounce and move up.
🎯 Setup Trigger
I will be watching for a 4H break of structure when either scenario occurs.
📋 Trade Management
Stop-loss: Below the 4H swing low that confirms the break of structure.
Target: TP1 at $121,750 and possible new highs. Targets will be updated depending on structure.
💬 Like, follow, and comment if you find this setup valuable!
Disclaimer: This is not financial advice. The content is for informational and educational purposes only and reflects personal opinions.