Head and shoulder forming on the 5minusally the head shoulders confirms the trend to turn to the downside after hitting its top of the rally
Btcbearish

BTC minimacroview!! Are bulls in Control?!Two possible setups:
It looks simple, doesn't it?
Tomorrow is Weekly Closure. if we see another rejection the short setup is valid in case a doji is printed which means we might need to wait 1 more week, otherwise be a bull with big balls!
Not a trading advice just our thoughts!
Cheers
MM67 TRADER TEAM

Read This Before Calling Me a Perma-Bear! Not Convinced; I think the stock to flow model is great, but let's look at real data before we continue to put our faith in it. For example - Gold has a similar concept, in regards to bitcoin and other cryptocurrencies. Yet, when we adjust price with inflation, there is still extremely long periods like 1981-2006 where price didn't budge. And, if we look back even further at the time of the gold rush, gold did 1,000x its initial price in less than 20 years. What we are seeing now in bitcoin is the hype train coming to an end. Now, that doesnt mean that I don't think that bitcoin will be worthless, but I think it's safe to say that what we have seen since it started was the "Digital Gold Rush". If we expect bitcoin to every 4 years 100x-500x itself, we would be setting our expectations way too high, because we are assuming that the first 10 years are what will be the same cycle until earth itself is no more. Bitcoin can succeed! But!!!! We need to look at the idea of stock to flow, and understand that price still will not be identical to how it is every cycle, for reasons such as recessions/depressions - mass unemployment - wars - mass debt, and many more reasons.

This Is Where The Real Bearish Action BeginsTrend line following our 10.5k run is perfectly in tune with us now. We had a 109% bull run! Lovely! Now... This is where things will begin flipping. Loaded my short just under 7600 from yesterday and still holding on to her. Might be holding this one long term. More side trades for short term scalps. Hope this gave some new prespectives. Happy Trading!

Topped Out???Just a pattern that I noticed looks pretty similar. Not a sure thing, but its something to think about.

$BTC getting confusing #LetsLearntogether Hi everyone!
This is not a financial advise to buy or sell bitcoin its is my personal trade and i am sharing this for my record and for educational purposes
i am not a professional trader, i am also learning
in this chart btcusd is forming rising wedge pattern according to this pattern we are bearish
MA 50 and 200 had crossover which is bullish
so i am expecting the price to touch 61-65 fib level which is also resistance of 200 daily moving average
so its confusing i am not in any trade until rising wedge breaks down or we touch 61 fib level so here is my opinion
thanks i would love your comments and opinions so that we can learn together.
also follow me on twitter
#letsLearnTogether

Bitcoin is still bearish! (And no im not crazy)
Bitcoin's bearish flag is still running and soon bitcoin is going to follow other markets due to world's panic caused by corona virus.
Correlations shows that Bitcoin had a day off from the market crash and soon will be corrected.
I'M NOT TELLING YOU TO BUY,SELL,OR EVEN HOLD YOUR POSITION IN ANY WAY

Bitcoin in Short with 5 Proofwhy Bitcoin it'll dumping again?
1 : Btc have bearish engulfing on Weekly
2 : We've now Bearish flag and when break it down the stick of flag touch old bottom
3 : Bitcoin Had correction And touch massive Resistance 5800 equal 0.5 fibonacci and bounced.
4 : Btc Trading now under 200 Ema weekly and we aren't brouck it 200 Ema since 2013
5 : The world in crisis Economic by Coronavirus
my evidence for everyone trading in Btc don't forget Stop loss under 4700.
i hope to support us by follow and like.

BTCUSD - Why it could drop the next 6-12 monthsThere was heavy resistance on the monthly Ichimoku Cloud as the base and conversion line were at the same spot.
Being rejected, there is a high probability, that the price drops and the cross of the two lines is being confirmed, a bearish signal.
Furthermore we have the cloud, which is extremely narrow and therefore easy to break-through.
The lagging span (green lagging line) on the left crossed the priced, which is typically a bearish sign. Falling through price with force would be more significant, but still a good signal.
Not on the chart:
- We closed below the 10 SMA and 21 EMA.
- The weekly doesn't look good. We need to see how it closes tonight. Closing below 8750-8800 would be really bearish.
- The Total2 chart for Altcoins got heavily rejected in the monthly chart with a gravestone doji. I expect at least another 30 Billion to leave the market.
That being said, with or without halving I believe Bitcoin is going to have a hard year, confluencing with the current situation in the world and the struggling markets.
Happy trading!

BTC USDt, ready for the next Bearish?After the last two attempts to break through the 9500 USDt wall, it seems that the price may return to much lower levels. The low volumes are moving towards lower and lower positions (from 9500 to 9300, to 9100 USD) and it is therefore probable that a "panic selling" can be expected in the short term. If this condition had occurred, the price chart could perform a new test of the supports around 8600/8500 USDt. (-9% for a short position).

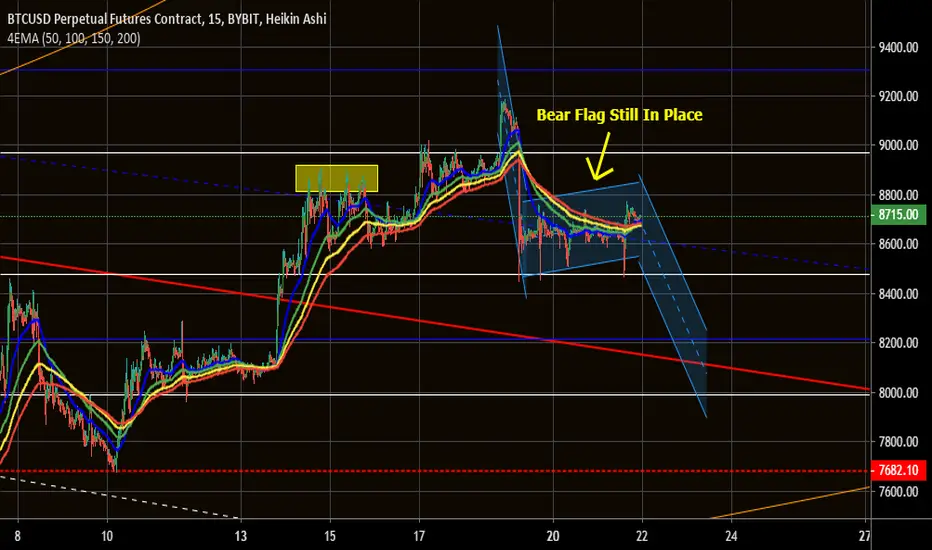
Still Have A Bear Flag... Don't ForgetBear flag hasn't gone anywhere. 8.7k level has barely been holding. Looks like more downside to me.
18 Months left for bull run. Patience is the KeyI dont think we bottomed at 3K. maybe we will have another lower high with halvening fomo however longterm we are going down below 3K.

Short at 7800! If it even gets there...We are approaching a MAJOR resistance cluster. Get ready to short!

My Bearish Scenario. If we're to mimic the 2014-15 bear market.If we're to mimic the previous cycle - this fractal matches it. Publishing this to watch it play out.
It ultimately leads us into a drawn out wyckoff accumulation pattern below trend resistance while holding the 4k range as support to create the trading range.
Scary! Possible. Never neglect all possibilities. It'l burn ya if ya do!!
With the US economy pumping, and a high chance of Trump being re-elected, could make for some serious accumulation while the $SPX flies to 4k or higher.

BEARISH MARKET ALMOST DONE ?Bitcoin has entered the Reload Zone (green square) yesterday , and as we all know , it broke the trendline a few weeks ago. We can see on this chart that bitcoin has bounced of the trendline. We can expect a retracement on the 0.382 or in reload zone of the last wave (red square).
We could have a Shark Setup if it goes back in the reload zone (red one) .

$BTC : THE BEARISH MARKET KEEP GOINGWe expect BTC to reach the reload zone OR retest the previous V-bottom.
Bitcoin has done a counter trend rally so institutionnals can short . We can ecpect it to go to the reload zone (green zone) and we'll see what happen next.
DO NOT SHORT AT THE MOMENT, THIS IS A NO TRADE ZONE FOR ME.

BTCEUR, Possible bounce at 7,5k EUR in the next 4 days.Still within the bear flag.
Possible bounce at 7,5k Euro in the next 4 days.
3 cycles with regular divergences on the same periods.
Now enter into the 4°cycle.

BTC possible 30% decline from here?BTC Upper wick formed on the daily. The past 2 months, once a long upper wick is presented, it showed us the top has been reached and a reversal is pending. I would expect a huge sell-off from there. Notice after both upper wicks, there was a 30% drop. It's very likely we may see the same results once again.

BTCUSD - BITCOIN IN DANGER SHORT AND MID TERMBitcoin is creating a H&S and a descending triangle at the same time. Dangerous territory. Market dynamic is bearish.
The TD SETUP AND COUNTDOWN in the 3D chart show us, that there should be bearish continuation at least till somewhen between the 13th and 19th of September (time difficult to predict).
Happy trading!

Average number of days between death crossesWent ahead and did the analysis, again BTC has never been in a bull market and had two death crosses this close to one another.

Bitcoin has made a U-Turn for this cycle: Bear PowerBitcoin is making lower low and lower high giving bearish signal for long but today Bitcoin has broken its major trend line support started early this year formed from 3K to 13K..
From my previous analysis, we can see Bitcoin is giving signal only for sell. Recently we had seen few pullback to $10,300 but price has been rejected and its acting as strong ‘Resistance’.
Now in downtrend It will find next support at $8900, 7800, 7100. We will analyze again,when it reaches near next support based on how it reacts with it.
Until than create short position make profit at each drop .. Please like my idea and follow my idea for live alerts.
Target: $8900, 7800 and 7100
SL: $10,300 or 9,800 (depend on loss you can bear)
Now god save cryto coins.. It will sky rocket to bottom... Bear are in Control..

BTC Dominance : Bull VS Bear Run. Who's stronger ?Speclation about BINANCE:BTCUSDT is always confusing for a new comer to understand what is going on in the market ? To be frank, thats make this amazing cryptocurrency a pain in the @ss for traders. You cant predict whats gonna happen next.
From my analysis, I believe there are two possibillities, Bull Run and Bear run
>> BEAR RUN
If the Price breaks down the line then On 1h Chart,
BTC is likely to print Gartley pattern.
Most likely breakout level is around 10890 - 10750 (1.618) , If this level is not tested then it must lie between 10300-10460.
>> BULL RUN
BTC is haeding towards third wave so if bull run is stronger to destroy gartley pattern then it will going up as it is going.

CryptoSniper - Vol 1 - BITCOINWelcome to my weekly TOP DOWN ANALYSIS. Quick review of what im seen this week in the crypto markets.
If you like my content give this analysis a like! You help me a lot and its free.
"Always trade what you see, not what you think its going to happen"
Namaste.
