BTC/USDT – 4H Chart UpdateBTC/USDT – 4H Chart Update
Bitcoin is trading inside a rising wedge / ascending structure and has just made a strong bullish push from the lower trendline.
Price holding above short-term MAs
Higher lows structure intact
Bullish momentum is building near the resistance
Current Price: ~92.5K
Immediate Resistance: 94.5K – 95K
Major Resistance: 96.8K
Support Zone: 89K – 90K
Trendline Support: ~88K
Above 90K: Bullish continuation possible
Break & hold above 95K: Momentum could accelerate toward 96.8K+
Rejection near resistance: Expect a healthy pullback to trendline support
A 4H close below 88K would weaken the bullish structure.
Bullish while above key support
Trade with discipline & proper risk management
Btcbnb

BNBUSDT – 4H Chart Update. BNBUSDT – 4H Chart Update.
Price is moving inside a descending channel, but holding the rising demand zone.
Short-term MA curling up; price trying to reclaim the 100 MA.
Support: 820 – 800 (major demand)
Immediate Support: 840 – 830
Resistance: 880 – 900 (trendline zone)
Breakout Zone: 920 – 1,000+
Higher low formed from demand + compression = potential base building.
A clean 4H close above 880–900 can open room for upside expansion.
⚠️ Wait for confirmation, avoid chasing.
DYOR | NFA

BTCUSDT – 4H | Chart Update. BTCUSDT – 4H | Chart Update.
BTC is compressing inside a symmetrical triangle (lower highs + higher lows). This is a classic volatility squeeze before expansion.
Strong buyer reaction seen multiple times near 85.8k – 84.6k (green circles)
Rising trendline support is still respected.
93.5k – 94k remains a heavy rejection area
Price needs a clean breakout to unlock upside
Price is trying to reclaim short-term MA
Sustained hold above trendline + MA = bullish confirmation
Above 89–90k → breakout attempt toward 93k+
Below 85.8k → deeper pullback toward 82.2k
This is a decision zone. Structure favors upside only after confirmation.
Small update • Big move loading
DYOR | NFA

BTCUSDT –Chart Analysis (4H)BTCUSDT –Chart Analysis (4H)
BTC is coiling inside a tightening range — lower highs vs higher lows. This type of compression usually leads to a sharp directional move.
Price is respecting the rising base around 85k
Every dip into the green zones shows buyer absorption
Sellers are active below 89k, keeping pressure from above
Support: 85,800 – 84,600
Major Support: 82,200
Resistance: 88,800 – 89,500
Supply Zone: 93,500 – 94,000
When price holds support during Extreme Fear, it often means weak hands are exiting while stronger players accumulate quietly.
DYOR | NFA

BTC/USDT – 4H Chart Update. BTC/USDT – 4H Chart Update.
Price swept liquidity near 84.5K and bounced → classic fake breakdown.
Still moving inside a descending channel.
84.5K = key support (holding keeps bounce valid).
82.2K = invalidation level if support fails.
Resistance: 88K → 92K–94K supply zone.
Neutral to slightly bullish as long as 84.5K holds.
Reclaim above 88K = upside continuation possible.
Below 84.5K = deeper pullback risk.
Not financial advice. Manage risk.

BTC/USDT 4HOUR CHART UPDATE !!BTCUSDT is consolidating within an ascending channel after a sharp bounce from lower levels, and the price is currently retracing towards mid-channel support around 88,000–87,000 USDT.
The lower boundary of the channel and horizontal levels at 88,000, 87,013, and 84,584 act as step-down support; as long as candles remain above around 84,500, this will remain a healthy corrective pullback in the short-term uptrend.
Below that, key higher-timeframe supports near 80,550, and 76,200 are the next demand zones where a deeper flush could still maintain the larger bullish structure.
The price drops towards the lower channel area, finds support, and then rotates higher for another leg up, with the green zone around 94,000–95,000 being the first major resistance on the way back towards the large grey supply above 100,000.
DYOR | NFA

BTC/USDT 1DAY CHART UPDATE !!BTC/USDT Chart Analysis
The price has broken above a key resistance area (~$104,000–$105,000) and is now retesting it as support.
The 50-day (red) and 200-day (green) moving averages slope upward, indicating bullish momentum.
Price activity consolidates just above the key resistance-to-support area, indicating accumulation ahead of a potential breakout.
If the price sustains above $104,000, we could see continuation towards $120,000–$125,000.
A break below $104,000 could see the price retest lower support areas near $100,000 or even $97,000–$98,000.
Conclusion:
Bullish bias above $104,000.
If support fails, a bearish move is possible, but momentum is in the bulls’ favor right now.
Stay tuned for updates and key levels to watch!
Thanks for your support!
DYOR. NFA

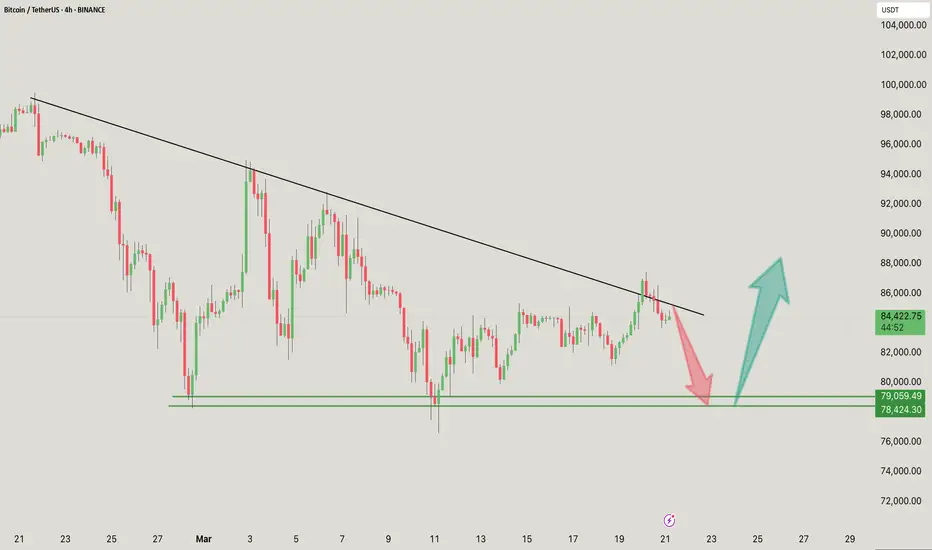
BTC/USDT 4-hour chart update. The Bitcoin (BTC/USDT) 4-hour chart suggests a key decision point near descending trendline resistance.
BTC is testing a key descending trendline, which has acted as resistance multiple times.
Rejection from this level could lead to a retracement towards the $79,000 – $78,400 support area (red arrow).
If BTC breaks above the trendline with strong volume, it could signal a bullish continuation towards $88,000+ (green arrow).
Immediate Resistance: $85,000
Key Support Area: $79,000 – $78,400
Breakout Target: $88,000+
If you found this analysis helpful, hit the Like button and share your thoughts or questions in the comments below. Your feedback matters!
Thanks for your support!
DYOR. NFA
BTC/USDT chart analysis !
BTC is retesting the breakout point near the descending trendline (around $98,000-$100,000).
If buyers step in, this retest could act as a launchpad for a potential bounce.
The green zone ($92,000-$96,000) remains a crucial area of demand, offering strong support in case of a deeper retracement.
The 50-day SMA (red line) is moving upwards, currently around $98,000. It acts as a dynamic support level.
BTC is slightly above the 21-day SMA (black line), which suggests short-term support.
Despite the pullback, the overall structure suggests a bullish continuation.
The orange projection shows a potential consolidation followed by a move towards higher targets near $112,000-$116,000.
If you found this analysis helpful, hit the Like button and share your thoughts or questions in the comments below. Your feedback matters!
Thanks for your support!
DYOR. NFA

BTC/USDT Analysis:Bitcoin (BTC/USDT) Analysis:
The green box marks a crucial support level between $90,000 and $92,500.
Historically, this area has acted as a strong demand zone where buyers have stepped in to increase prices.
The price has broken below the mid-boundary of the ascending channel and is currently trading near the lower boundary.
A retest of the green box is possible if the bearish momentum persists.
The green moving average (possibly 200 EMA or similar) is slightly above the current price. This suggests that the price is losing upward momentum and the moving average could act as resistance on any bounce.
The red arrow on the chart indicates a possible move downwards towards the green support zone.
DYOR, NFA
@Peter_CSAdmin

BTC/USDT 4-hour chart analysis. BTC/USDT trades within an ascending parallel channel, respecting the upper and lower trendlines.
Current price: $99,789.68, retracing back towards a crucial support area.
The highlighted green area is around $98,000-$100,000, which acts as the channel’s demand zone and mid-range level.
200 MA (green line): Located near $97,830, providing dynamic support.
Immediate resistance near the upper channel trendline (~$110,000).
Psychological resistance at $105,000, a crucial round-number level.
If BTC maintains the $98,000-$100,000 support area, it is set to bounce towards:
Short-term target: $105,000.
Mid-term target: $110,000, aligned with the upper channel boundary.
If BTC breaks below $98,000, further declines to test $95,000 (lower trend line) are possible.
A breakdown below the channel will invalidate the bullish trend.
Disclaimer: This analysis is for informational purposes only and does not constitute financial advice. Always conduct your research and consult a financial advisor before making investment decisions.
For updates on other coins or personalized insights, feel free to reach out via DM.
@Peter_CSAdmin

BTC/USDT Weekly Chart Analysis. BTC/USDT Weekly Chart Analysis.
A classic bullish reversal pattern has played out successfully.
The structures of the left, head, and right shoulder are perfectly aligned, confirming the breakout above the neckline.
BTC has broken its previous all-time high resistance, pushing above the $100,000 level with strong momentum.
The current sharp rally suggests overextension; a pullback could occur.
Trendlines and Resistance Areas:
BTC has crossed a long-term upward trendline and broken above the resistance area (highlighted in beige).
The breakout signals a shift in price discovery with a possible consolidation or retest.
The 21 EMA (black line) remains well below the current price, confirming bullish strength.
If the momentum sustains, BTC could rise to $120,000-$130,000 in the coming weeks.
The previous resistance area ($80,000-$85,000) could be retested.
This would allow for consolidation before the next leg up.
Disclaimer: This analysis is for informational purposes only and does not constitute financial advice. Always conduct your research and consult a financial advisor before making investment decisions.
For updates on other coins or personalized insights, feel free to reach out via DM.
@Peter_CSAdmin

BTC/USDT 4H Chart AnalysisBitcoin remains within an ascending channel, respecting both the upper and lower trendlines.
The price is currently hovering near the channel's midline, indicating indecision.
Support: $94,500 (ascending trendline and psychological level).
Resistance: $96,800 (recent local high).
The 21 MA (yellow line) provides dynamic support, but the price action shows some weakness in holding above it.
Declining volumes indicate low conviction in recent price activity.
Momentum appears to be neutral, awaiting a catalyst for direction.
A breakout above $96,800 could push BTC towards $100,000.
A breakdown below $94,500 could lead to a retest of $92,000 (lower trendline).
Disclaimer: This analysis is for informational purposes and is not financial advice. Always stay updated with market movements and adjust your trading strategies as needed.
You can DM us for information on any other coin.
@Peter_CSAdmin

BNB/USDT CHART ANALIYSIS !!The BNB/USDT daily chart indicates a potential bullish breakout scenario, as the price consolidates within a symmetrical triangle.
The price is approaching the top of the triangle, indicating a potential breakout soon.
The current support zone lies around $600, which is aligned with the lower trendline of the triangle.
The immediate resistance lies at $645, which is near the upper boundary of the triangle.
A breakout above $645 could target the higher levels of $700-$750.
BNB is trading above the cloud, which indicates bullish momentum.
The cloud acts as a dynamic support around $580-$600.
Strong support exists at $600, reinforced by the horizontal zone and the lower triangle boundary.
A breakdown below $580 could invalidate the bullish setup, with potential support lying at $540.
An upward breakout could see BNB target $780 and beyond.
A downward move could revisit the $540-$550 range.
Watch out for a confirmed breakout above $645 for a long position.
Watch out for a breakout below $580, which could turn the momentum bearish.
Disclaimer: This analysis is for informational purposes and is not financial advice. Always stay updated with market movements and adjust your trading strategies as needed.
You can DM us for information on any other coin.
@Peter_CSAdmin

BTC/USD Golden Cross OverviewThis chart shows a potential "golden cross" pattern, which occurs when a short-term moving average (typically the 50-day) crosses above a long-term moving average (like the 200-day). In this chart, Bitcoin's price is hovering near $68,102, while the red and green lines (likely representing the 50-day- and 200-day moving averages) converge.
The current consolidation within the channel suggests that Bitcoin could be gearing up for a bullish breakout. If the price successfully breaks out of the upper channel resistance, it might accelerate toward the next key level near $72,000.
Around $48,803 and the lower channel boundary
Near $72,000, aligned with the upper trendline
If the golden cross confirms and holds, this may signal strong upward momentum for BTCUSD into the following months.
Disclaimer: This analysis is for informational purposes and is not financial advice. Always stay updated with market movements and adjust your trading strategies as needed.
You can DM us for information on any other coin.
@Peter_CSAdmin

Bitcoin Analysis Update!!Bitcoin continues to trade within a broad ascending triangle pattern, with its recent price action showing signs of strength as it approaches a crucial resistance area.
Bitcoin's moves within this pattern indicate increasing volatility, with higher highs and lows.
The price is currently testing a key supply zone acting as resistance. A breakout above this level could indicate strong bullish momentum.
For long entries, look for a confirmed breakout above the horizontal supply zone, targeting higher levels in the resistance zone.
A stop-loss can be placed below the support of the ascending triangle to protect against false breakouts.
Bitcoin's ability to maintain momentum and break key resistance levels will be key to confirming the next major move. Keep an eye on this setup and adjust strategies based on price's reaction to these levels.
Disclaimer: This analysis is for informational purposes and is not financial advice. Always stay updated with market movements and adjust your trading strategies as needed.
You can DM us for information on any other coin.
@Peter_CSAdmin

BTC/USDT Analysis UpdateBitcoin has formed an ascending triangle pattern, and the price is currently testing a key horizontal supply zone. This level has historically acted as a resistance area, making it a crucial point to watch for a breakout.
The triangle's upward trendline shows steady buying pressure, with the price making higher lows.
Bitcoin is trying to break through this significant resistance area, which could trigger a bullish rally if A confirmed breakout above this zone, with strong volume, would suggest a continuation of the bullish trend, targeting higher resistance levels.
Consider entering a long position if there is a confirmed breakout above the supply zone with a retest showing support.
To minimize risk, a stop-loss can be placed just below the ascending triangle's lower boundary.
Look for profit targets around the next significant resistance levels.
Keep a close eye on the price action and volume to confirm the breakout, as this could set the tone for Bitcoin's next major move.
Disclaimer: This analysis is for informational purposes and is not financial advice. Always stay updated with market movements and adjust your trading strategies as needed.
You can DM us for information on any other coin.
@Peter_CSAdmin

BTC/USDT Analysis Update!Bitcoin is currently consolidating within an ascending triangle pattern, indicating potential bullish momentum. The price action suggests an attempt to break a crucial horizontal supply zone, which could act as a crucial hurdle for further gains.
The formation of an ascending triangle is typically a bullish continuation pattern, indicating the possibility of an upside breakout.
Bitcoin is testing a crucial supply zone, where sellers have been active previously. A decisive breakout above this zone would confirm the bullish trend.
Consider a long position on a confirmed breakout above the supply zone with strong volumes.
A stop-loss can be placed just below the lower boundary of the ascending triangle to manage risk.
Look for potential profit targets around the next resistance levels or key psychological levels. This setup needs to be monitored closely as market volatility could increase in the coming days.
Disclaimer: This analysis is for informational purposes and is not financial advice. Always stay updated with market movements and adjust your trading strategies as needed.
You can DM us for information on any other coin.
@Peter_CSAdmin

The BTC/USDT 1-day chart shows the following key technical pointBitcoin is currently trading within a descending channel, which indicates a continuation of the bearish trend unless there is a breakout.
There is a crucial resistance area around the $66,000 to $70,000 range. BTC may struggle to break above this level without strong bullish momentum.
The chart shows a lower trendline acting as support, which is currently located around the $50,000 level. If BTC breaks below this level, it could lead to a more significant decline.
The purple line on the chart represents a moving average that has acted as both support and resistance in the past. BTC is currently trading below this moving average, indicating a bearish sentiment.
Disclaimer: This analysis is for informational purposes and is not financial advice. Always stay updated with market movements and adjust your trading strategies as needed.
You can DM us for information on any other altcoin.
@Peter_CSAdmin

BTC/USDT 50MA CHART ANALIYSIS !The BTC/USDT 1-day chart shows a crucial confluence area, with the 50-day moving average (5OMA) acting as support. Here is a detailed analysis: The resistance area is a strong horizontal resistance area marked in red between $66,000 and $72,000. This area has historically been a supply zone where sellers emerge.
Bitcoin is currently holding above the 50-day moving average (red line). This level is important because traders often use it as a key dynamic support or resistance point.
The chart has a green arrow pointing to a potential upside move. If Bitcoin can maintain support above the 50-day moving average and break the descending resistance (white trendline), it could challenge the $66,000-$68,000 area. Failing to sustain above the 50-day moving average could push the price towards the lower green trendline, around the $55,000-$58,000 area, which acts as a broad support zone.
Bitcoin is in a crucial range, with bullish potential if it breaks above the descending trendline and crosses the $66,000-$72,000 resistance zone. However, a breakdown below the 50-day moving average could trigger further declines.
Disclaimer: This analysis is for informational purposes and is not financial advice. Always stay updated with market movements and adjust your trading strategies as needed.
You can DM us for information on any other altcoin.
@Peter_CSAdmin

BTC/USDT 4HOUR CHART UPDATE !!Latest BTC/USDT Long Update:
Bitcoin is showing strength by rebounding from a crucial support trendline, which suggests the presence of strong buyer activity in this area.
This support level has held well recently and continues to act as a solid base for further price action.
Ahead lies a horizontal supply zone acting as a key resistance level.
A breakout above this zone would provide strong bullish confirmation and signal a possible uptrend continuation.
Traders are carefully monitoring this supply zone for any signs of a breakout.
A clear move above this resistance could change market sentiment, potentially leading to a more sustained rally.
The Bitcoin price action trendline is indicating a bullish trendline with strong support. Traders are looking for a breakout above the supply zone, which would confirm the start of a strong bullish rally. However, if Bitcoin fails to break out, it could lead to further consolidation near this resistance area.
Let me know if you want further information or analysis!
Disclaimer: This analysis is for informational purposes and is not financial advice. Always stay updated with market movements and adjust your trading strategies as needed.
You can DM us for information on any other altcoin.
@Peter_CSAdmin

BITCOIN chart update !!1D timeframe: The daily chart shows a broad downward trendline forming resistance around $64,000. There is also a projection going downwards to the $51,000-$52,000 support area, which aligns with the green trendline on the chart. This suggests that after this resistance, Bitcoin could experience a more significant correction towards lower support levels.
These are possible scenarios based on existing technical patterns. Markets can behave differently depending on macroeconomic factors and other events, so it is important to stay updated.
Disclaimer: This analysis is for informational purposes and not financial advice. Always stay updated with market movements and adjust your trading strategies as needed.

BTC/USDT 1hour chart update !!The Bitcoin (BTC/USDT) chart shows price movement within an ascending channel, with the price currently facing resistance near the $64,000 level, as marked by the blue area. The following key details can be observed: Channel Pattern: The price is moving in an upward sloping channel, indicating bullish momentum. However, the price has recently touched the upper boundary and is now facing a pullback.
The blue area around $63,900 to $64,000 is acting as a strong resistance level. The price has touched this area several times but has failed to break it.
An arrow indicates a possible bearish move, suggesting that the price may retrace towards the lower trendline of the channel, around $61,000-$62,000. This would be a common behavior of price consolidation before retesting or breaking the resistance.
A green curve shows a projected bullish reversal near $60,000, which aligns with the lower trendline support. This could provide a buying opportunity if the price tests this level. Summary: BTC is at a crucial point, facing strong resistance at $64,000. Rejection here could lead to a return towards the $60,000-$62,000 range. A bounce off the support could resume the bullish trend, but a break below would signal potential further declines.
If you want more details or have specific questions about further updates, feel free to ask
Disclaimer: This analysis is for informational purposes and not financial advice. Always stay updated with market movements and adjust your trading strategies as needed.
