Bitcoin monthly demand level at $84,349 is holdingBitcoin monthly demand level at $84,349 is holding. There are signs of new bullish impulses in the smaller timeframes. Let's see if BitCoin cryptocurrency wants to rally higher from this demand level.
Btcbuy

BTC BUY TRADE SETUP PREMIUM ANALYSIS.BTCUSD — Trade Setup
📈 Bias: Bullish
🎯 Entry: 87,600 / 87,900
🛑 Stop Loss: 86,500
🎯 Target: 89,000
📊 Technical Reasoning:
BTCUSD is maintaining bullish momentum after holding above a key support zone. The entry area is positioned where buyers are expected to defend price and continue the move higher. The stop loss is placed beyond the invalidation level to manage downside risk, while the target is aligned with a higher liquidity objective and continuation structure.
📌 Execution Plan:
* Buy from the marked entry zone
* Apply disciplined risk management
* Monitor price behavior as it approaches the target
❌ Invalidation:
A clear break and close below 86,500 would invalidate this bullish setup.
💬 Do you expect continuation toward 89,000, or consolidation before the next leg up?

BTC | BUY TRADE SETUP ANALYSISBTCUSD BUY SETUP.
Bitcoin is holding a key demand zone and showing signs of short-term strength on the lower time frame. If buyers maintain control, a push toward the upside target is possible.
Buy Zone: 85900 - 86200
Stop Loss: 85000
Target: 87000
This setup is based on price action and structure, with clearly defined risk and a logical invalidation level. Always wait for confirmation and manage risk properly.
If this idea adds value, like & follow for more crypto market updates and chart insights.

BTC | UPDATE📊 BTC Update — Key Levels in Play
Bitcoin is currently reacting near a critical structure zone. Price holding above support keeps the bullish scenario valid, with momentum favoring a continuation toward the next resistance level. A clean reaction from these levels could confirm further upside.
🔓 Entry: 87,195
❌ Stop Loss: 85,843
🎯 Target: 88,098
Market structure and liquidity around this area make it a level worth watching closely.
What’s your bias from here — continuation or rejection? 👇
Support with a like if this helps your analysis 🚀
⚠️ Disclaimer: This post reflects personal market analysis. Not financial advice.

BTC DAY TRADING SETUP📌 Trade Setup:
* Entry Levels: 90,456 / 90,300
* Stop Loss: 89,121
* Target: 91,936
BTC is showing bullish momentum from the current support zone. Buyers are defending key levels, and if momentum continues, price may move toward the target. The bullish setup remains valid as long as BTC stays above the stop-loss.
Disclaimer: This is not financial advice; it reflects only my personal market analysis. Please do your own research before trading.

On the 9th Day of ETHmas...Continuation and a New H4 Demand ZoneOn the 9th Day of ETHmas, my true love gave to me....Continuation of what she has already given me...and a new H4 Demand Zone.
Please refer to my previous posts on ETH over this past month or so to see how the market has been playing out EXACTLY as it should. Once again, we have been ignoring the world of Trump News, Microstrategy plans, and every other noisy gong of crypto crashes, tarrifs, etc. We have been focusing on SOLID Technical market structure that I follow and teach. ETH has been following this solid structure and we've endeavored to give you a preview of what to expect, and then followed up with how it actually played out.
So what happed in the last few days?:
At our last post, ETH was making its pullback to the last H4 Demand Zone. What seemed like another bloody murder episode to many was simply a pullback to gain stronger support for this move up. We had the expected pullback, along with a few strong wicks below this last H4 Demand Zone to take out over leveraged traders. But, when the dust settled, the H4 candle closed above this zone and never showed that we were going bearish again.
So...where are we now?:
Today, after a few days of consolidating around this H4 Demand Zone, we saw the break out above it and the continuation with the bullish move that started all of this (When we had the first H4 BOS UP on November 28, and the return to the H4 BOS Source on Dec 1). That was the Ultimate Buy Setup on ETH, and projected to take us up to the H4 Supply Source of ~ 3450-3560. So, today, we broke out and continued and are now heading to this zone.
What to look for?:
As we make our way up, there is still the older Daily Supply Zone (the one that caused the first pull back to the H4 Demand Zone). The top of that zone is ~ 3230. We have broken through that zone, but the top may still need to be retested before we keep pushing on.
Also, there is a big Daily Supply Source sitting at (3355 - 3520). This overlaps our target area, so we need to watch the 15 min chart closely as we approach this area. Look for any BOS Down structure that would signal that this pullback is coming. Otherwise, we are on the way to 3450 - 3560, just as the plan has been since November 28.
Happy Trading, and please leave me your comments. I would LOVE to hear what you all are thinking, hear any challenges or push backs on my analyses, or to just see if you have been following along.

Bitcoin trading idea 15-minute time frameHi traders
While Bitcoin has seen its liquidity targets (see the link below), we have reached the 4-hour support area in the lower time frame and we will have a few conditions to continue the path:
First, the 15-minute candle must stabilize within the specified support range, ultimately above the buyers' equilibrium level, i.e. 96.633. In this case, the pullback will have a buying position at this equilibrium level and then if it can see a 15-minute consolidation above 97.633, it will be a confirmation for the continuation of the rise for the high liquidity targets specified in the 4-hour chart.
Main chart link:

#BTC Time to Buy ?!I believe We could have another downside move , and then we can have a buy position on it as Scalp . for 6-15%
Added in watchlist .

BTC/USDT 4H AnalysisAfter taking out the sell-side liquidity, Bitcoin has shown signs of reversal and filled previous imbalance zones.
Currently, price is reacting from a Fair Value Gap (FVG) around the 110K area after a market structure shift (MSS).
🟢 The bullish scenario suggests that if this FVG holds, BTC could aim for the next buy-side liquidity around 126K as the main target.
🎯 First target: 115K – liquidity area above the short-term high.
🚀 Final target: 126K – buy-side liquidity sweep.
📌 Key zones:
Sell-side liquidity taken ✅
FVG (Potential bullish continuation area)
Buy-side liquidity at 126K
📅 Analysis based on Smart Money Concepts (SMC) and liquidity flow.
📖 For educational purposes only — not financial advice.

Bitcoin BTC - Market AnalysisWhile my broader bias on Bitcoin (BTC) remains bearish, I hold a short-term bullish outlook leading into the New York (NY) session open. This perspective is based on several key technical observations:
I anticipate potential price manipulation during the NY session that may drive BTC toward the 0.618–0.786 Fibonacci retracement levels. This zone also coincides with a significant market structure shift (MSS) key level, making it a potential area of interest for short positions.
Notably, we have already seen strong rejection from the 0.5 equilibrium level within the current Fibonacci range, suggesting sustained selling pressure from market participants.
Furthermore, there appears to be limited liquidity buildup on the buy side, indicating a lack of engineered liquidity or compelling draw for a continued move higher compared to the liquidity we have on the sellside.
Given these factors, I plan to position myself for a potential short trade, capitalizing on any bullish manipulation that drives price into the aforementioned sell zone.

BTCUSD Intraday Move 03.09.2025🔹 Bias: Bullish Channel Structure
BTCUSD is moving strongly within an ascending channel, respecting FVGs along the way and maintaining bullish momentum.
🔹 Key Level – 111,600
A decisive close above 111,600 will confirm strength and open the path for continuation toward higher liquidity pools. This level also aligns with channel midline and prior consolidation, making it a pivotal breakout zone.
🔹 Retest as Entry Trigger
The ideal plan is to wait for a clean breakout and candle close above 111,600, followed by a controlled retest of this zone. If demand re-enters here, it validates buyers’ control and offers a low-risk entry.
🔹 Upside Target – 113,482
Once 111,600 holds as support, price has room to push toward 113,482, where liquidity rests near channel resistance.
🔹 Risk Management
Invalidation lies below 111,000, where the most recent demand and FVG structure would fail.
👉 Trade Plan: Close above 111,600 → Retest → Long entry → Target 113,482 with stops below 111,000.

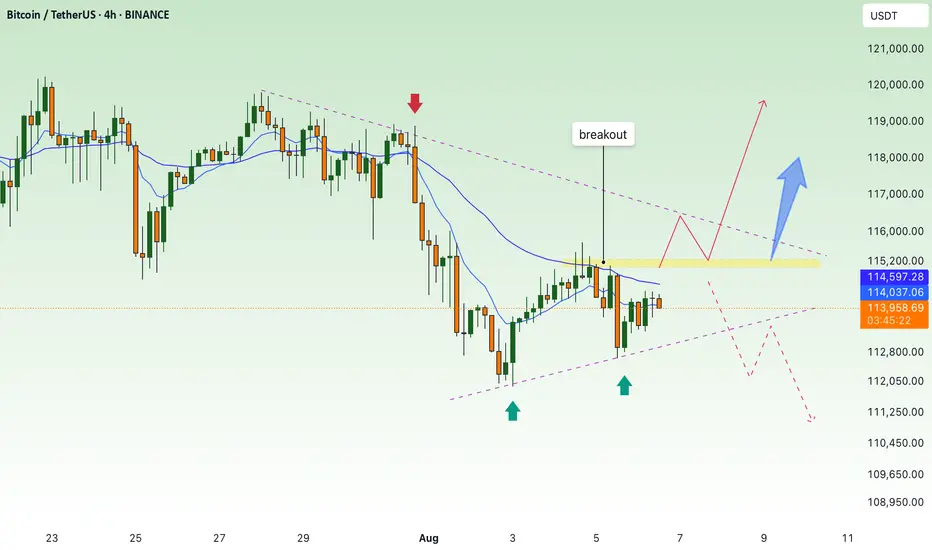
BTC Analysis - August 20, 2025, 09:28 AM EDT 📊 Price: ~$114,016, consolidating after failing $120,000 resistance (24h).
Technical Analysis:
• Supports: $112,300, $108,000
• Resistance: $116,800, $120,000
• RSI: 46 (daily, neutral), 50 (4-hour)
• MACD: Bearish, histogram narrowing
• EMAs: Below 20-day ($117,300), above 50/200-day ($115K/$110K)
• Bollinger: Near mid-band ($115,400, daily)
Patterns:
• Ascending Channel: Retest of mid-channel ($114K–$115K, August 15–20)
• Bearish Pinbar: August 14
• Doji: August 19
On-Chain:
• MVRV Z-score: 2.2, neutral, nearing rally trigger
• Active Addresses: Up 3% (30d)
• CDD: Low, strong HODLing
• LTH Supply: 74% held >155 days
• STH Supply: Down 13% (30d), profit-taking
Fundamentals:
• M2: $107T (Feb 2025), 3.8% growth, 0.94 correlation with BTC
• ETFs: $15B inflows (2025), $0.8B weekly (August 15)
• Regulatory: GENIUS Act supports crypto (July 2025)
BTC Reserve: Exchange reserves down 10% (2025), low selling pressure.
Dominance: 61% (BTC.D), neutral, altseason if <63.2%.
Social Sentiment: 450K #BTC mentions on X, 55% bullish ( low volatility, dip-buying).
Trends: Neutral short-term, possible dip to $112,300. Long-term: $130K–$200K (2026).
Signal: Buy (60% confidence)
• Buy on dips: $112,300 or $108,000
• Stop-loss: <$108,000
• Target: $116,800 short-term, $130,000 (Q4 2025)
Disclaimer: Research before investing. #BTC

BTC recovers, maintains long-term growth💎 MIDWEEK BTC PLAN UPDATE (20/08)
BTC Technical Outlook (Daily)
Current Trend:
BTC is in a corrective phase after failing to break above the 120,000 – 120,500 zone. The price has tested the key support area around 112,000 – 113,000, where it converges with the 200 EMA and the 0.5 Fibonacci retracement.
Main Scenario:
If the 112,000 – 113,000 zone holds, BTC is likely to rebound, first targeting 116,000 – 117,500, and then 120,000 – 120,500. This will be a strong resistance area to watch.
Alternative Scenario:
If 112,000 breaks, BTC could drop deeper to the 108,000 – 109,000 zone, and potentially further down to 104,000 (Fibo 0.786).
Key Levels to Watch:
• Resistance: 116,000 – 117,500 and 120,000 – 120,500
• Support: 113,000 – 112,000 and 108,000 – 109,000
Overall Outlook:
BTC is currently at a sensitive level. If the 112k support holds, the bullish trend remains intact, but a deeper break below this zone could extend the downside risk toward 108k and lower.

BTC Buy / Long SetupWait for the entry till London Session, and Hold the trade, Must use SL with proper risk management.

BTC continues to accumulate, waiting for breakout to go up💎 MID-WEEK BTC PLAN UPDATE (06/08)
Brief BTC Analysis – 4H Timeframe:
• Main Trend: Price is consolidating within a descending channel (green diagonal lines).
• Support: The 112,500–113,000 zone has been tested twice and bounced (green arrows).
• Resistance: The 114,800–115,200 zone (purple area) – this is the key level that will determine the next trend.
⸻
Two main scenarios:
🔺 Bullish Scenario (Preferred):
• Price breaks above the 115,200 resistance zone → confirms a breakout from the descending channel.
• Next targets: 116,500 → 119,000.
🔻 Bearish Scenario:
• Price gets rejected at around 115,000 and breaks below the 113,000 support → likely to revisit 110,000.
📌 Key Signals to Watch:
• A clear breakout above 115,200 with volume is a strong buy signal.
• If the price fails to break this zone, consider selling once there is a clear bearish reaction.
Accumulate waiting for btc price increase💎 BTC PLAN UPDATE – End of July (31/07)
📊 BTC Technical Analysis (4H Timeframe – End of July)
✅ Positive Signals:
• BTC has broken out of the consolidation triangle pattern (blue diagonal line), indicating a potential strong uptrend.
• The current price is retesting the breakout support zone around 117,800–118,000 → showing a good reaction and creating upward momentum.
• MA50 and MA200 are starting to slope upwards → confirming increasing buying strength.
📈 Bullish Scenario:
• If BTC holds above 118,000, it is likely to move toward the nearest resistance zone at 119,900.
• After breaking 119,900, the next targets are:
→ 122,792 (Fibonacci 1.618)
→ Further target: 127,900 (Fibonacci 2.618)
🛑 Risk Note:
• If the price drops below 117,000, it’s important to monitor again, as it may retest a deeper support zone around 114,500.

BTC Era, continue to create new ATH💎 BTC WEEKLY PLAN UPDATE (14 July )
NOTABLE NEWS ABOUT BTC
Bitcoin (BTC) broke above a key milestone on Friday, setting a new all-time high of $119,999 with no signs of slowing down. The technical outlook supports further gains as momentum indicators remain strong and price action is solidly in price discovery mode, with the next potential target at $135.000
Bitcoin’s Next Stop: $135.000
Bitcoin entered price discovery on July 9, and since then, the king of cryptocurrencies has surged toward the $120,000 target—a key psychological level for traders. Early Monday during the Asian session, BTC climbed to a peak of $119,999, marking a new all-time high and the closest the asset has come to this milestone.
TECHNICAL ANALYSIS PERSPECTIVE
Two key momentum indicators on the daily timeframe signal underlying bullish momentum in Bitcoin, suggesting a potential for further upside. The Relative Strength Index (RSI) reads 76, and the Moving Average Convergence Divergence (MACD) is flashing green histogram bars above the neutral line.
However, if BTC undergoes a correction, it may extend its pullback to find support near the lower boundary of the Fair Value Gap (FVG) around $115,222.
Derivatives market data shows that $76 million was liquidated over the past 24 hours as BTC surged toward its new high. The long/short ratio, which is considered an indicator of bullish or bearish trader sentiment, is above 1—indicating that more derivative traders are optimistic about Bitcoin and are expecting further gains in the king of cryptocurrencies.
Stay tuned to the channel for updates.
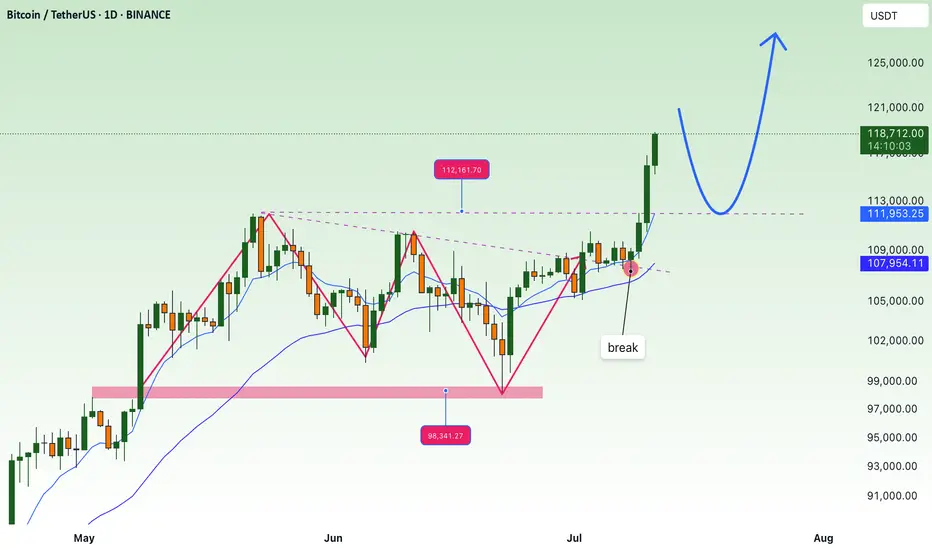
FOMO price increase, create new ATH💎 Update Plan BTC weekend (July 11)
Continuously creating a new ATH, preparing to have a short sale?
The reinforcement of Bitcoin price around the upper boundary of the previous consolidation area was broken at $ 108,355, which ended on Wednesday. The price has soared to the highest level of the new time of $ 116,868 on Thursday. At the time of writing on Friday, the price is fluctuating above $ 116,600.
When BTC entered the price exploration regime and if the trend of increasing continues, the price can expand the momentum to an important psychological level of $ 120,000.
Technical analysis angle
Our community has continuously chose the trend of increasing as the mainstream for all previous transactions and currently preparing to welcome 120k as forecast.
The relative power index (RSI) on the daily chart reaches 71, higher than the excess buying 70, showing a sharp increase. However, traders should be cautious because the ability to adjust the decrease is very high due to over -purchase. Meanwhile, the average divergence dynamic indicator (MACD) has shown a price intersection at the end of June. The indicator also shows that green histograms are increasing on neutral zero, showing that the rising momentum is being strengthened and continues to increase.
However, if BTC must be adjusted, the price may extend the decline to search and support around the upper boundary of the unified area that has been broken earlier at $ 108,355.
Plan has been constantly accurate in the past 2 months, which is the positive signal of the channel that brings value to the community.
Please follow the channel to receive accurate scenarios about gold and BTC
==> Comments for trend reference. Wishing investors successfully trading
BTC up following H1 trend linePlan BTC today: 07 July 2025
Related Information:!!!
Bitcoin (BTC) trades slightly below $109,000 at the time of writing on Monday, following its highest weekly close on record. Institutional and corporate demand continues to serve as a key catalyst, with Metaplanet acquiring an additional 2,205 BTC on Monday, while US-listed spot Bitcoin Exchange Traded Funds (ETFs) saw over $769 million in net inflows last week.
As market participants assess the latest bullish indicators, focus now shifts to broader macroeconomic developments, including new trade-related headlines and reports suggesting that the administration of US President Donald Trump may extend the current tariff pause until August 1.
personal opinion:!!!
BTC moves sideways in the trend line, trend line support 108,300
Important price zone to consider :!!!
support zone : 108.300
Sustainable trading to beat the market

waiting for new ATH this week , btc💎 BTC PLAN UPDATE FOR THE BEGINNING OF THE WEEK (07/07)
NOTABLE BITCOIN NEWS: Focus on 4 key points today
1. Elon Musk – “America Party” to Support Bitcoin
Elon Musk has confirmed that his newly formed political party, the “America Party,” will support Bitcoin, stating that “fiat is hopeless.”
2. Cup-and-Handle Pattern Analysis: Targeting $230K
According to technical analysis by Cointelegraph, BTC is forming a “cup and handle” pattern on the monthly chart, which could lead to a target peak of $230,000 if a breakout continues.
3. BTC Price Holds Steady Around $109K Amid “Crypto Week” and Trade Tensions
Bitcoin is currently trading around $109,000, influenced by “Crypto Week” and concerns over U.S. tariffs.
4. Institutional Inflows Increase, But Market Demand Weakens
According to CoinDesk, institutional investors are still buying BTC, but not enough to offset declining demand in the spot market, negatively affecting short-term market sentiment.
⸻
TECHNICAL ANALYSIS PERSPECTIVE
The short-term trend remains bullish. However, the steep slope of the trend indicates buying pressure is still being contested and unstable.
BTC remains stuck at Fibonacci levels—pay close attention to the resistance zones at 112K and 115K. If these two resistance levels are broken, investors may get the answer to whether BTC can approach the 120K level.
In the short term, both gold and BTC are moving sideways, indicating that market liquidity and investor capital are unstable and being divided across multiple portfolios.
==> This analysis is for reference only. Wishing all investors successful trading!

BTC Scalp Long / Buy SetupWait for the entry first, BTC must sweep the liquidation levels below side first then it should start pumping towards the tp, if it takes 2nd tp first then trade is not valid, if it takes first tp and then come back at entry level trade is still valid. if 4hr candle closing below the Bullish OB then close the position otherwise wick doesn't matter.

BTC continues to accumulate above 103,500Plan BTC today: 19 June 2025
Related Information:!!!
Bitcoin (BTC) price edges slightly higher, trading near $104,700 at the time of writing on Thursday, after stabilizing above a key level — the 50-day Exponential Moving Average (EMA) at $103,100. A breach below this level could trigger a sharp fall in BTC. Risk aversion could intensify, as reports indicate that US officials are preparing for a strike on Iran in the coming days. Despite this risk-off sentiment in global markets, institutional demand remains strong, with US spot Bitcoin Exchange Traded Funds (ETFs) seeing positive inflows for eight consecutive days
personal opinion:!!!
btc continues to accumulate above 103,500, the market is no longer sensitive to interest rate information yesterday
Important price zone to consider :!!!
support zone : 103.500 \ 101.000
Sustainable trading to beat the market

BTC accumulates above 104,300 zonePlan BTC today: 17 June 2025
Related Information:!!!
Bitcoin (BTC) price falls to around $106,000 at the time of writing on Tuesday following a mild recovery the previous day. The decline comes as investors continue to digest the escalation of the Iran-Israel conflict and after US President Donald Trump highlighted concerns and asked his security advisors to meet in the Situation Room. While institutional interest in Bitcoin remains robust, any further escalation in the Middle East could impact global risk assets.
The US steps in to resolve the Iran-Israel war
Bitcoin price action remained broadly resilient on Monday despite escalating tensions in the Middle East. The four-day-old war between Israel and Iran, which began on Friday, has so far failed to trigger a sharp correction. The largest cryptocurrency by market capitalization held above its key psychological threshold of 100,000 despite the initial shock — a contrast to April last year, when BTC fell more than 8% amid similar Iran-Israel turmoil.
The New York Times reported on Monday that US President Donald Trump has encouraged Vice President JD Vance and his Middle East envoy, Steve Witkoff, to offer to meet with the Iranians this week.
personal opinion:!!!
Gold price continues sideways and accumulates in 2 trend lines, support 104,300
Important price zone to consider :!!!
support zone : 104.300 - 104.100
Sustainable trading to beat the market
