BTC Analysis: Rising Channel Resistance & Volume Divergence
1. Reaching Ascending Channel Resistance
Looking at the turquoise Ascending Channel on the chart, the current price has reached the top of the channel (resistance line).
In technical analysis, the upper boundary of an ascending channel acts as a strong resistance zone. Unless there is a strong breakout (overshoot), the price tends to revert to the channel's median or bottom. Therefore, selling pressure (profit-taking) is likely to dominate in this area.
2. Bearish Volume Divergence
The most critical signal is indicated by the white arrow on the volume indicator.
Phenomenon: The price continues to make Higher Highs, but the volume is making Lower Lows.
Implication: This is a classic 'Bearish Divergence' signal, indicating that the buying momentum driving the rise is becoming exhausted. It suggests a lack of "fuel" to sustain the rally, meaning a trend reversal is highly probable in the near term.
3. Volume Profile & Support Retest Required
Pay attention to the gray Volume Profile on the left and the yellow box.
POC (Point of Control) Reversion: The longest bar in the volume profile (white line, approx. 87.8k) represents the 'High Volume Node' where trading was most active. Due to the rapid price increase, it is highly likely that the price will retrace to this zone to fill the low-volume areas and retest support.
Box Top Support Confirmation: It is not yet clear if the top of the yellow consolidation box (approx. 90k) has successfully flipped into support after the breakout. Therefore, a healthy correction down to the 90k–88k range (indicated by the red line) is expected.
4. Liquidity Zones
Although the chart shows an uptrend, the dense yellow liquidity zone formed just below at 91.8k is likely to act as a magnet pulling the price down.
Therefore, it is reasonable to expect a short-term pullback to around 91,800 USDT. The market will likely decide whether to resume the uptrend or decline further after sweeping the liquidity in this area.
5. Coinbase Premium
The Coinbase Premium has been rising for the past 4-5 days, but it remains in negative territory.
Btcchartanalysis

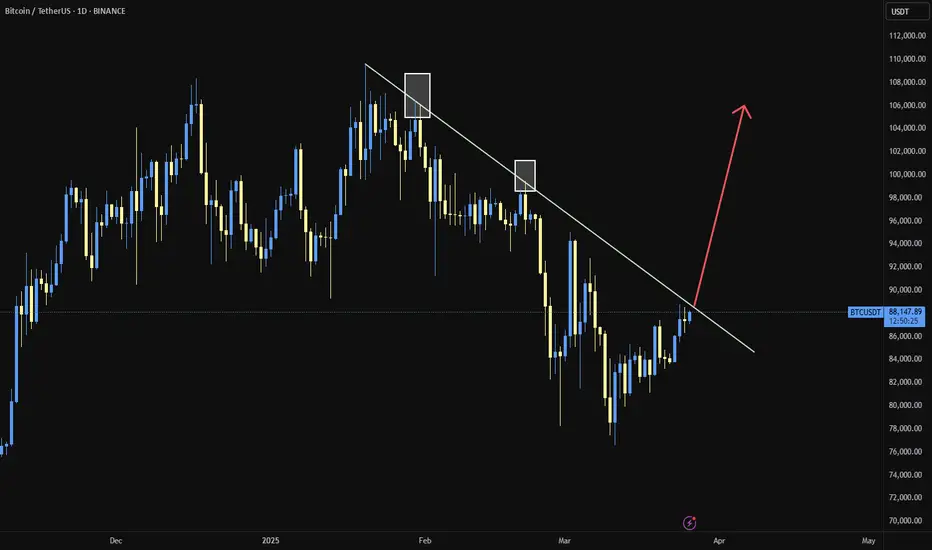
Technical analysis of bitcoin key levels and wedge chart pattern1. Trend Structure
The descending trendline (Resistance line) at the top of the chart remains valid.
The price has repeatedly faced rejection at this level, indicating that the medium-term downtrend is still intact.
2. Key Price Levels and Indicators
50-week EMA
The price has recently recorded its third downward break below the 50-week EMA.
From a traditional technical perspective, this is viewed as a signal that strengthens the possibility of a medium- to long-term bearish shift.
POC (Point of Control)
The mid-range POC is acting as a strong supply zone,
and recent rebound attempts have also failed to break above this level decisively.
3. Liquidity Zones
Two major liquidity zones are marked in the upper and mid sections of the chart.
Liquidity zone near 112k (upper zone)
A cluster of large liquidity pockets and liquidation points
If a short-term rebound occurs, this is the first upside target likely to be tested
Liquidity zone near 102k (mid zone)
Overlaps with the 4h FVG, making it a level closely watched by both buyers and sellers
4. FVG (Fair Value Gap)
Multiple FVGs are present on the 4-hour timeframe, with some already filled.
Unfilled FVGs have a high probability of being revisited as the market corrects in the future.
5. CME Gap
All weekday CME gaps have already been filled and may act as short-term resistance.
A weekend gap forms when Monday’s CME opening price starts above 95.4K.
6. Current Market Structure Interpretation
The price is currently attempting a rebound from the lower boundary of the downtrend.
However, several resistance layers overlap—POC, FVG zones, and trendline resistance—raising the likelihood of heavy selling pressure on any upward move.
In the short term, volatility consolidation is expected within the 96k–100k range.
7. Potential Formation of a Lower Wedge Pattern
The price has broken below the lower boundary of the wedge pattern, accompanied by rising volume.
A short-term rebound is likely, and if the price re-enters the wedge, further upside momentum may follow.
If the lower trendline is not reclaimed, the structure may shift into a range after a retest.
8. USDT.D Chart Analysis
The price has once again touched the upper boundary of a downtrend line that has persisted for over a year.
Downward pressure on the USDT dominance chart suggests potential upward momentum for Bitcoin.
Technically, this zone offers conditions supportive of a short-term rebound.
9. Summary
The medium-term trend remains bearish, with the ongoing breakdown below the 50-week EMA reinforcing a sustained bearish outlook.
A short-term bottoming attempt is visible, but dense supply overhead limits the strength of any rebound.
FVGs, POC, and liquidity zones overlap near the current price region, increasing the probability of heightened volatility.
If you found this content helpful, feel free to support with a boost (🚀) and a comment (💬).
Your encouragement helps drive better analysis and more valuable content.
Follow the page to receive notifications (🔔) for future posts.

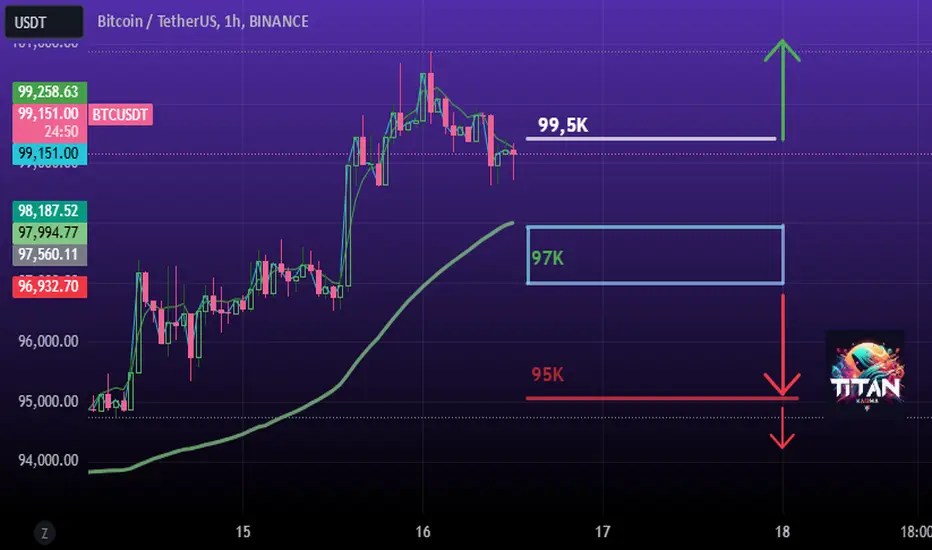
Bitcoin price forecast, short-term BTC chart analysisResistance line: Represented by a red diagonal line indicating a downtrend, suggesting that the price may struggle to break above this level.
Support line: A green horizontal line at the bottom of the chart, marking the support area where a recent W pattern formed, currently around 99K.
CME gap: Highlighted in yellow at the center of the chart, representing a short-term resistance area.
Parallel channel: Formed by two gray diagonal lines, illustrating the range within which the price is likely to move.
POC (Point of Control) line: A red line cutting across the center of the chart, representing the price level with the highest trading volume. Currently around 110,000 USDT, it can serve as a key support or resistance level.
Liquidity zone: The area where the POC line near 110,000 USDT overlaps with the upper boundary of the parallel channel, indicating a zone of highest expected liquidity. This is where short stop losses and long take profits are likely to cluster.
Predicted path: Shown in green, suggesting the price may bounce off the support line, rise along the parallel channel, break through the CME gap, and move toward the liquidity zone. If it breaks the red resistance line, the ascent toward the liquidity zone could accelerate.
Conclusion: Bitcoin is expected to gradually rise as it overcomes resistance levels, ultimately reaching the high-liquidity zone around 110K–112K. This analysis is based on current market conditions, and actual price movements may differ due to various market factors.

BTC/USDT"Do you think we're going up this time? I think it's taken quite a long time; we can enter a position if the resistance line breaks."
BTC/USDT updateBefore the correction, we had already shared the most probable scenario for #BTC in Spot Club and, with a slight delay, in this channel. As expected, the price dropped around 11% in spot within wave C, leading to significant liquidity being absorbed in the market.
However, we had already warned tarde-ai.bot members about this potential move in advance.
We still consider our previous outlook as the most probable scenario for Bitcoin's next move. If our perspective changes, we will update the analysis accordingly.

Bitcoin DominanceThe same scenario we discussed in our pinned posts remains intact. It appears that as long as the price stays below the red box, there is a possibility of a medium-term Wave C formation. We also had a support trendline, which is now broken; however, we need to wait for the daily candle to close to determine whether this break is fake or genuine.

Thought about BTC chart analysisBelow is a structured, step-by-step technical analysis of the shared BTC/USDT chart (on a 30-minute timeframe) along with a possible short-term (next 12 hours) outlook. Please note this is not financial advice but rather a technical perspective for informational purposes.
1. Identify the Overall Context
Timeframe: The chart is set to the 30-minute interval, indicating short-term price action and intraday volatility.
Current Price Region: BTC appears to be trading in the mid/upper 98,000 range (as shown on the screenshot).
Recent Movement: Price fell sharply from around 102,000–103,000 down to approximately 97,000, and then recovered slightly to the 98,000–99,000 zone.
2. Key Indicators Visible
Bollinger Bands (Purple Area)
Bands are relatively wide, suggesting increased volatility.
Price is near or below the middle band, indicating slight bearish pressure in the short term.
Moving Averages
There appear to be at least two commonly used MAs:
A shorter-term MA (possibly 50-period) in yellow/orange.
A longer-term MA (possibly 200-period) in blue.
The price has fallen below the shorter-term MA, which can be a short-term bearish signal.
The price is hovering around or slightly under the longer-term MA (the 200 MA in blue), which typically acts as a stronger support or resistance.
Volume Profile (SVP HD Up/Down)
Shows volume-by-price bars on the right side.
Notable high-volume nodes around 99,000–100,000, suggesting a strong interest level where price may consolidate or reverse.
Another cluster of volume near 97,000, possibly acting as short-term support if price revisits that zone.
Volume Bars (Below the Chart)
A significant spike in volume during the sharp move downward from ~102,000 to ~97,000.
Post-drop volume appears moderate, suggesting some stabilization but not an aggressive recovery.
3. Short-Term Momentum Evaluation
Price Action Relative to Moving Averages
Trading below the 50-period MA often indicates short-term weakness.
If the price fails to reclaim the 50 MA, the market may remain under bearish pressure for the next few candles (each candle = 30 minutes).
Bollinger Band Position
If candles close near or below the lower Bollinger Band, oversold bounces are likely but not guaranteed.
If candles remain compressed below the midpoint of the bands, it tends to confirm near-term bearish or sideways sentiment.
Possible Divergence Signals
Without direct MACD/RSI data on the screenshot, we rely on the advanced divergence indicator “MIS Adv Div.” If it’s showing bullish divergence (not fully clear from the image), there could be a short-term bounce. If it’s showing bearish continuation, the downward trend may persist.
4. Support and Resistance Levels
Immediate Resistance
Around 99,000–99,500: This area aligns with the lower side of a high-volume zone and the short-term MA.
Around 100,000–101,000: A psychologically significant level and also near the previous swing highs and volume node.
Immediate Support
Around 97,000: Where price found an initial bounce on the large sell-off.
Around 95,000: The next potential zone if 97,000 breaks.
5. Short-Term (Next 12 Hours) Price Outlook
Likely Scenario (Sideways to Slight Rebound)
The price may range between 97,000 (support) and 99,500 (local resistance).
If buyers step in at 97,000 again, expect a mild recovery toward the 99,000–100,000 region.
Bullish Breakout
If BTC reclaims the 99,500–100,000 zone with strong buying volume, it could target 100,500–101,000 next.
Watch for a 30-min candle close above the 50 MA to confirm potential upside momentum.
Bearish Continuation
If price fails to hold 97,000, a deeper retracement to 95,000 or lower may occur.
Sustained trading below the 200 MA would reinforce near-term bearish momentum.
Bitcoin (BTC/USDT) Analysis. BTC appears to be trading within an ascending channel. The chart shows a bullish medium-term structure.
The price is currently testing the lower trendline support within the channel.
A crucial support area is marked between $94,000 – $92,000 (green area). This is a crucial level for a bounce.
Any break below this support could invalidate the channel and lead to further upward pressure.
Resistance lies around $100,000 – $102,000 (orange area), which has been tested multiple times.
A breakout above this level could spark a bullish push towards the upper trendline of the channel or new highs.
For updates on other coins or personalized insights, feel free to reach out via DM.
@Peter_CSAdmin

Btc key levelsBtc key levels.
If support holds target should be around 105k that can reject to new lows or push it to 115k.

Btc chart if this holds supportBtc chart if this holds support and trend continues.
Each level can reject to a new low. You want the breakout resistance to become support and that most likely will push Btc to sub target1 and target1.
If this will work out for you don`t ask me how I know :)) just tip me (I need to pay bills).

BTC LONG TERM TOP 250K NOW 38K COMING!!BTC LONG TERM TARGET 250K WITHIN 2026. Before that we may visit 38k range in 2024 - 2025.

BTC is showing Bullish Pennant Pattern in the 1D time frameBINANCE:BTCUSDT.P
BTC is showing Bullish Pennant Pattern in the 1D time frame and the price may increase between 71k and 73k if support is found from the underlying trendline. brake the trendline below, price can down between 61k and 60k!🌈🍀
NOTE: This is just my prediction. Be sure to use STOPLOSS and remember that I am not a financial adviser. your money, your risk!
Thanks
The sroced.

Bitcoin Could Reach high 38 before starting to collapseBTC been consolidating around high 37K and bouncing to the upside around 38.5.We could see a correction and another move to the upside around 38.8 before the main move to the downside starts.OR 38.2 was the top and we go down today.
Thanks for watching

Bitcoin Might try 26.1 over the weekendBitcoin went up and dropped back to our yellow line - some FVG gap to clear at 26.1 and could also sweep the lows.
Thanks for watching

Bitcoin Will Fail to Break Above $27.5K and Drop FurtherBitcoin getting weaker and might try one last push before it starts to drop back down.
BTC decoupling showing that the strenght on btc is gone and more sell is to come!
thanks for watching

Bitcoin Consolidating For Another Sell Off.25K Imminent!*** DISCLAIMER No Financial Advice ***
Bitcoin can go as low as 25K today
it's important to note that technical analysis and patterns suggests an imminent correction before the next leg up
when we reach 25K then we decide the next level but IMHO 20K is comin slowly but surely and more lows will follow after that
Thanks for watching
Please support the channel by Boost,Follow,Comment and sharing my video

BTCBUSD 1D Chart AnalysisCurrently in the 1D BTCBUSD chart, BTC price is moving near both of the upper lines of Ascending Channel and the Expanding tringle. After some liquidity grab this may be get a downward movement. Other than that, there is a sell OB area above that levels. So price may reach to that level and then price may rejected from that level. Likewise we should consider about the next FED meeting held on 21-22 March.
Trading is highly risky. Always focus about the risk management. Put less than 2% of your capital and less than 10 trades per day. 1:2 or 1:3 Risk reword ratio is appropriate. Try to keep more than 75% win rate. I'm not financial advisor. This is only for the educational purposes and not as the financial advices. Do your own research. Trade carefully. Good luck!

BTC/USDTDescending Triangle Pattern
The descending triangle is a bearish pattern that is characterized by a descending upper trendline and a flat lower trendline that acts as support.
This pattern indicates that sellers are more aggressive than buyers as the price continues to make lower highs. The pattern completes itself when the price breaks out of the triangle in the direction of the overall trend.

BTC UPDATE 1#BTC UPDATE 1 :
In 1W TF already awared this The Profit Station Family Wyckoff's market cycle, I have been seeing people saying around 19000 to 20000 since this was the previous high from 2017 right this could be actual bottoming area for bitcoin and we could be slowly starting new phase but if you look in example right side so far playing out very accurately according to wyckoff's market cycle final stage could be showing some sort of support and finally breaking downward direction exactly as shown in example and discussed plenty ( ) of times so let's say an actual accumulation phase for bitcoin then we heve to overcome obstacle which we are forming right now in other time frames. ( ) according to wyckoff's distribution phase we could finding ourselves i mean the final stage where we could be showing some sort of support and finally breaking into downside exactly as shown in example of Wyckoff's Distribution Phase.

BTC UPDATE 3#BTC UPDATE 3 :
In 4H TF smaller Time Frame broadening wedge and breakout going and according to this broadening wedge our target is 22000 to 22400. But we have to be very careful because 21300 to 21700 we have bearish order block + daily resistance. Undoubtedly this is bullish move, but we need to be mindful that we have a bearish order block + daily level located around 21300 - 21700 area. if we flip this into support than could see further price action in Bitcoin otherwise if we failed to flip could gravitated downward direction.

BTC/USDTIn the previous educational post, I posted about Rising Wedge patterns and in this post, I have explained Falling Wedge Patterns. ( Falling Wedge is the opposite of Rising Wedge pattern; for every chart pattern there are opposite patterns excluding some.)
Falling Wedges are Bullish Patterns and it generates a bullish signal, Falling wedge patterns forms with Lower highs and lower lows.
The Falling Wedge pattern forms in two shapes same as the Rising Wedge; If the Falling wedge pattern forms in an uptrend it will make a continuation and if the Falling wedge pattern forms in a downtrend it will make a reversal.
The Lower highs and the lower lows along make a trend resistance and trend support. When a breakout occurs upside, the price breaks the trend resistance line.
In a Falling wedge, a breakout occurs upside 60 to 70% of the time.
To confirm a true breakout, we can take the help of Volume and other indicators. In a true breakout, there will be big volume than usual.

BTC/USDTThe rising wedge (also known as the ascending wedge) pattern is a powerful consolidation price pattern formed when the price is bound between two rising trend lines. It is considered a bearish chart formation that can indicate reversal and continuation patterns – depending on location and trend bias. Regardless of where the rising wedge appears, traders should always maintain the guideline that this pattern is inherently bearish.

BTC/USDTRight-Angled Broadening Wedges come in two varieties, ascending and descending. They consist of a horizontal trend line and a sloping trendline.
The Ascending Right-Angled Broadening Wedges (ARABW) have an ascending trendline above the horizontal trendline with price action in between.
The Descending Right-Angled Broadening Wedges (DRABW) have a descending trendline below the horizontal trend line with price action in between.
With both versions, the price broadens over time.
Prices should be seen to touch both trendlines twice. Two touches to form the horizontal trendline and two touches to form the sloping trendline.
Breakouts from these two patterns often follow a partial rise or a partial decline.
