Bitcoin’s Unfilled CME Gap: A Price MagnetBitcoin currently has a CME gap between $79,600 and $83,730, which remains unfilled.
From a historical and statistical perspective, CME gaps have a strong tendency to be filled over time, making them important reference zones for both swing traders and long-term market participants.
At the moment, price has moved significantly away from this range, which reduces the probability of a gap fill in the short term and makes any immediate retracement less likely without a clear catalyst. Strong momentum and trending conditions can delay gap fills for extended periods.
However, this does not invalidate the gap. Instead, it should be viewed as a high-probability magnet zone that may come into play during future corrections, deeper pullbacks, or broader market structure shifts.
As long as this CME gap remains open, it represents a key area of interest for liquidity, potential support/resistance reactions, and higher-timeframe mean reversion. Traders should keep this zone marked on their charts and be patient, as sooner or later the market tends to revisit and fill these inefficiencies.
Risk management and confirmation from price action are essential when approaching this area.
If you have a coin or altcoin you want analyzed, first hit the like button and then comment its name so I can review it for you.
This is not a trade setup, as it has no precise stop-loss, stop, or target. I do not publish my trade setups here.
Btccmegap

What is bitcoin CME Gap? How to use BTC gap IndicatorWhat is bitcoin CME Gap? How to use BTC gap Indicator
The 'Gap' in the CME (Chicago Mercantile Exchange) futures market, which offers a glimpse into the movements of institutional investors, is one of the key indicators many professional traders watch closely.
1️⃣ What is the Bitcoin CME Gap?
CME is one of the primary avenues for institutional investors to access Bitcoin. However, the CME Bitcoin futures market closes over the weekend (from Friday afternoon to Sunday afternoon, Chicago time, USA). Additionally, there is a one-hour trading break after market close on weekdays.
Conversely, spot exchanges like Binance and OKX, which we commonly see, operate 24 hours a day.
This difference is where a 'Gap' occurs. Especially during weekends, when the break is longer, gaps tend to be larger.
Bearish Gap: Occurs when the opening price after the CME market closes is lower than the closing price. This means that the Bitcoin price fell in the spot market during the off-hours.
Bullish Gap: Occurs when the opening price after the CME market closes is higher than the closing price. This means that the Bitcoin price rose significantly in the spot market during the off-hours.
Abrupt Psychological Shift: This implies that investor sentiment leaned heavily towards one side during the weekend.
Unfilled Order Blocks: The gap area is interpreted as a region where potential unfilled orders (buy/sell pressure) may exist.
Gap Fill Phenomenon: Many traders believe in the adage "gaps get filled" and use it as a trading strategy. This suggests a tendency for the price to move in the opposite direction of the gap, eventually attempting to cover the gap area. However, this phenomenon is not 'mandatory', and whether a gap will be filled immediately or much later must be judged through various analyses.
2️⃣ Easily Find CME Gaps
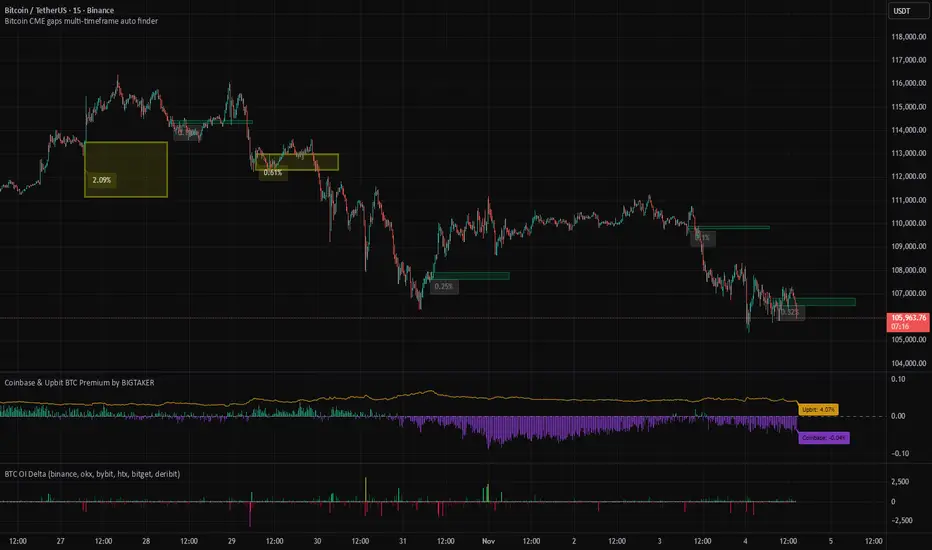
The Bitcoin CME gaps multi-timeframe auto finder indicator automates CME candle analysis and displays it intuitively on the chart.
⚡Indicator Features and Usage
Multi-Timeframe Gap Detection: 5-minute, 15-minute, 30-minute, 1-hour, 4-hour, and even 1-day candles! It simultaneously detects and displays CME gaps occurring across various timeframes. Whether you're a short-term trader or a long-term investor, you can check gaps according to your trading style.
Automatic Box and Label Display: The detected gap areas are drawn as rectangular boxes on the chart. Bullish gaps are displayed in green tones, and bearish gaps in red tones, making them easy to identify at a glance. The size of each gap (%) is displayed as a label above its respective box.
Highlight Function: Large gaps above a set threshold (e.g., 0.5%) are highlighted with an emphasized color. 'Big gaps' can have a greater impact on the market, so they should be noted.
Chart Price Synchronization: The price of spot charts from other exchanges may differ from the CME futures price. This indicator adjusts the price of the gap boxes to the price level of the chart you are currently viewing via the "Chart_price" mode. By using the "Chart_price" mode, you can more intuitively grasp the price level of the gap box on the spot chart and make direct trading plans on the chart of another exchange you are viewing.
Real-time Alerts: You can receive real-time alerts when a new CME gap is detected. You can also set alerts to notify you only about gaps from a specific timeframe. This is extremely useful when you can't continuously watch the chart during weekends or specific times on weekdays.
3️⃣ Trading Strategies
💡Gap Fill Strategy:
When a Bullish Gap Occurs: If the price breaks above a bullish gap but then falls back into the gap area attempting to fill it, one might consider a long position near the bottom of the gap, or a short position if the price fails to rebound from the top of the gap. Alternatively, a strategy of considering a short position in a resistance zone before the gap is filled is also possible.
When a Bearish Gap Occurs: If the price breaks below a bearish gap but then rises back into the gap area attempting to fill it, one might consider a short position near the top of the gap, or a long position if the price fails to fall from the bottom of the gap. Alternatively, a strategy of considering a long position in a lower support zone before the gap is filled is also possible.
💡Utilizing as Support/Resistance Areas:
Old CME gap areas can act as strong support or resistance lines when the price retests those levels in the future.
Observe whether the price encounters resistance and falls again when it reaches the top of a bearish gap, or if it finds support and rises again when it reaches the bottom of a bullish gap. Gaps that overlap across multiple timeframes can hold even stronger significance.
💡Trend Confirmation and Reversal Signals:
If a strong bearish gap occurs and is not immediately filled, but the price continues to fall, this could indicate the start or continuation of a strong downtrend.
If a strong bullish gap occurs and is not immediately filled, but the price continues to rise, this could indicate the start or continuation of a strong uptrend.
You can use the price movement after a gap occurs to gauge market momentum and apply trend-following or trend-reversal strategies.
For example, if a bearish gap occurs but is quickly filled within a few days and breaks above the top of the gap, this could be interpreted as an early sign that the bearish market has ended.
💡Multi-Timeframe Analysis:
When looking for key support/resistance levels, check not only the gaps of the current timeframe you are viewing but also gaps from higher timeframes (e.g., 4-hour or daily gaps on a 1-hour chart).
Gaps from larger timeframes are areas of stronger market interest. When making trading decisions in smaller timeframes, consider the location of important gaps from higher timeframes for risk management or to set entry/exit targets.
Short-term Gaps (5m, 15m): Most gaps occur within 1% and can be utilized for short-term volatility, high-leverage scalping, or day trading. They are suitable for quick entry/exit strategies, with caution against whipsaws. They tend to be filled before the 4-hour candle closes after the market opens.
Medium-term Gaps (1h, 4h): Can be referenced for swing trading or position trading. They can become significant support/resistance areas depending on price movement after the gap occurs.
Long-term Gaps (1d): Can act as major turning points in market trends or as important support/resistance levels from a long-term perspective. If a 'big gap' occurs, the possibility of a shift in the market's overall direction should also be considered. They usually occur during the weekend off-hours, and sometimes large gaps of over 3% occur.
A weekday short-term gap that was filled 4 hours ago.
A weekend long-term gap that saw a trend increase after a 4% big gap occurred.
4️⃣ Conclusion
The 'Bitcoin CME Gap Multi-Timeframe Auto Detector' indicator is a powerful tool that helps you not miss crucial price fluctuation points in the market.
However, no indicator should be blindly trusted. Gaps may not be fully filled, or the price may immediately break out in the opposite direction after surpassing a gap. Instead of relying solely on gap filling, it is crucial to analyze it in conjunction with other indicators to increase your win rate.
We hope you utilize the information gained from this indicator and combine it with your existing analysis methods (chart patterns, auxiliary indicators, macroeconomic analysis, etc.) to build more sophisticated trading strategies.
📌If this content was useful, please support us with a boost and comments. Your small encouragement is a great strength for creating better analyses and content. By following, you can also receive notifications about our postings

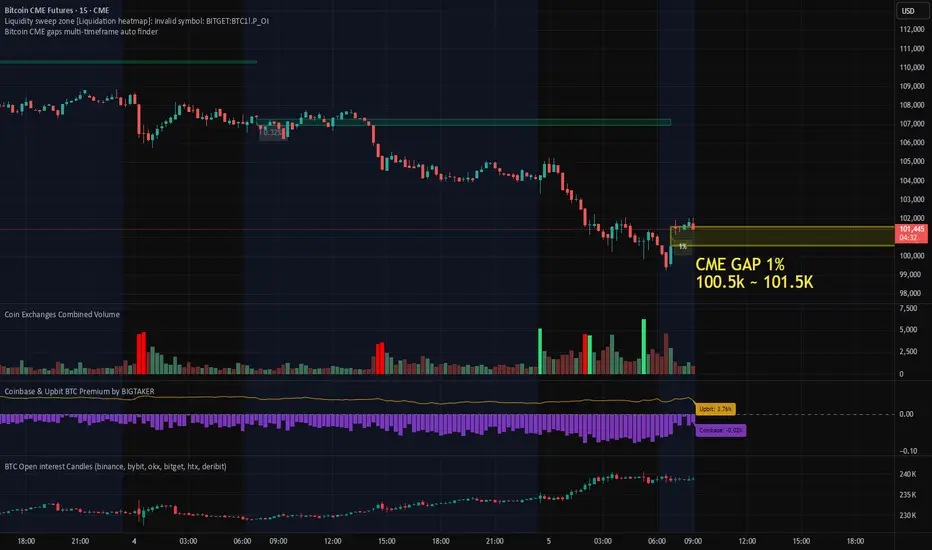
1% Bitcoin CME Gap Formed, Futures Market Data AnalysisThis morning, a ~1% gap formed on the Bitcoin CME futures chart.
Given that the gap occurred after a sharp decline, it’s important to consider the possibility of both a gap fill and a retest of recent lows in the short term.
The Coinbase Premium remains in negative territory, though it has shown slight improvement compared to yesterday, suggesting that U.S. spot selling pressure has somewhat eased.
In addition, Open Interest has increased, with data indicating a rise in short positions.
This suggests that selling pressure has been building during the recent decline, which may lead to a period of heightened short-term volatility and consolidation before the gap is fully filled.
Summary:
CME Gap Range: Approximately 1%
Market Structure: Short-term downtrend followed by consolidation
Coinbase Premium: Still negative, but slightly improved
Open Interest: Increasing (inflow of short positions)
📍In the short term, it is crucial to monitor whether the price enters the gap fill zone and retests the recent lows, while maintaining support at 98K, which remains a key short-term level.
How to use bitcoin CME gap auto finder indicator on tradingview📊 Bitcoin CME Gap Auto Detection and Visualization Indicator
The Pine Script-based indicator Bitcoin CME gaps multi-timeframe auto finder is a TradingView tool designed for cryptocurrency traders and investors to automatically identify and visualize Bitcoin CME (Chicago Mercantile Exchange) futures market gaps across multiple timeframes.
The Bitcoin CME futures market often creates price gaps after weekends or holidays when trading resumes. These gaps typically represent market imbalances, and many traders believe that price levels where gaps occur are likely to be revisited in the future.
This concept is known as the "Gap Fill" theory, where such gaps are considered key price zones that may act as support or resistance levels.
Traditionally, manually identifying these gaps requires checking multiple timeframes and verifying weekend/holiday sessions, which is both tedious and time-consuming.
Indicator Link: Bitcoin CME gaps multi-timeframe auto finder
🔑 Key Features of the Indicator
Automated Gap Detection: Saves traders the time and effort of manually searching for and marking gaps.
Cross-Exchange Synchronization: CME gap boxes are displayed in sync on other Bitcoin charts such as BTCUSDT, BTCUSDT.P, and BTCUSD.
Multi-Timeframe Analysis: Displays gaps simultaneously across various timeframes (5m, 15m, 30m, 1h, 4h, 1D), providing multiple market perspectives.
Visual Clarity: Clearly highlights gap zones, with major gaps emphasized for quick trader recognition.
Strategic Trading Support: Provides essential information for developing and executing gap fill-based trading strategies.
CME Gap History: Allows users to review all past CME gaps formed in historical candles.
Alert Functionality: Sends real-time notifications when new gaps are detected, helping traders respond promptly to market changes.
⚙️ Main Functions and Usage
This indicator provides a wide range of customizable input options, allowing traders to adapt it to their specific analytical needs.
CME Gap Settings:
CME Symbol for Gaps: Specifies the symbol used to fetch CME futures data. The default is “BTC1!” (Bitcoin CME Futures).
Minimum gap percentage (%): Sets the minimum price movement recognized as a gap, allowing users to filter out minor fluctuations and focus on significant ones.
Display Timeframes:
Enables or disables gap visualization for each timeframe (5m, 15m, 30m, 1h, 4h, 1D). Users can activate only the timeframes they prefer to analyze.
Box Colors:
Customizable colors for each timeframe and gap direction (upward/downward), allowing easy visual distinction between gap types.
Box Extension Lengths (Bars):
Sets the number of bars the gap box extends to the right for each timeframe.
This visually illustrates how gap zones can remain relevant as future support/resistance levels.
Label Settings:
Show labels: Toggles the display of percentage labels for gaps.
Label position: Adjusts where the label appears inside the box.
Label text size: Controls the label font size.
Highlight Settings:
Highlight gap % (>=): Emphasizes gaps larger than a specified percentage, providing visual alerts for major gaps.
Highlight label text color: Sets the text color for highlighted gap labels.
Highlight box color: Defines the color for highlighted gap boxes.
Highlight box border width: Adds adjustable border thickness to highlighted gap boxes, making significant gaps stand out even more.
Alert Settings:
Enable Alerts: Toggles alert activation when gaps occur.
Alert Timeframe: Choose specific timeframes for receiving alerts or enable alerts for all timeframes.
🚀 How It Works
The indicator retrieves CME futures data (BTC1!) and compares the previous bar’s close/high/low with the current bar’s open across multiple timeframes to identify gaps.
It is specifically designed to detect gaps that occur when the market reopens after weekends or holidays.
Once a gap is detected, the indicator draws a box to visually mark it on the chart.
If the gap size exceeds the user-defined threshold, the box is emphasized using a highlight color and thicker border for greater visibility.
💡 Trading Strategies and Applications
Support and Resistance Identification:
CME gap zones often act as strong support or resistance levels.
Unfilled gaps may indicate potential price return zones, serving as signals for possible reversals or trend continuation.
Gap Fill Strategy:
Many traders believe that gaps tend to be filled eventually.
This indicator can help identify potential entry and exit points for gap fill trades.
For example, after a downward gap, traders might consider entering a long position when the price begins to recover toward the upper boundary of the gap and close the trade once the gap is filled.
Market Sentiment Analysis:
The size and frequency of gaps can reflect strong market movements or uncertainty.
Large gaps often indicate intense buying or selling pressure, and highlighted gaps help quickly identify these significant market events.
Multi-Timeframe Confirmation:
When gaps occur simultaneously across several timeframes, it underscores the importance of that price zone.
For instance, if a gap appears on both the 1-hour and 4-hour charts, traders should pay close attention to potential price reactions at that level.
Opportunity Detection via Alerts:
By enabling alerts, traders can monitor market changes in real time and act immediately when new gaps form — particularly useful for short-term or high-frequency strategies requiring fast decisions.
🚨 Cautions
Gap fills are not guaranteed: While gaps often tend to be filled, not all of them will, and some may take a long time.
Time zone configuration: Since the CME operates in specific trading hours, make sure the indicator’s GMT+9 timezone matches your local trading setup on TradingView.
Avoid using in isolation: Combine this indicator with other technical tools (e.g., moving averages, RSI, volume indicators) to enhance reliability and accuracy.
※ If you found the Bitcoin CME gap auto finder indicator helpful, please give it a like and follow.
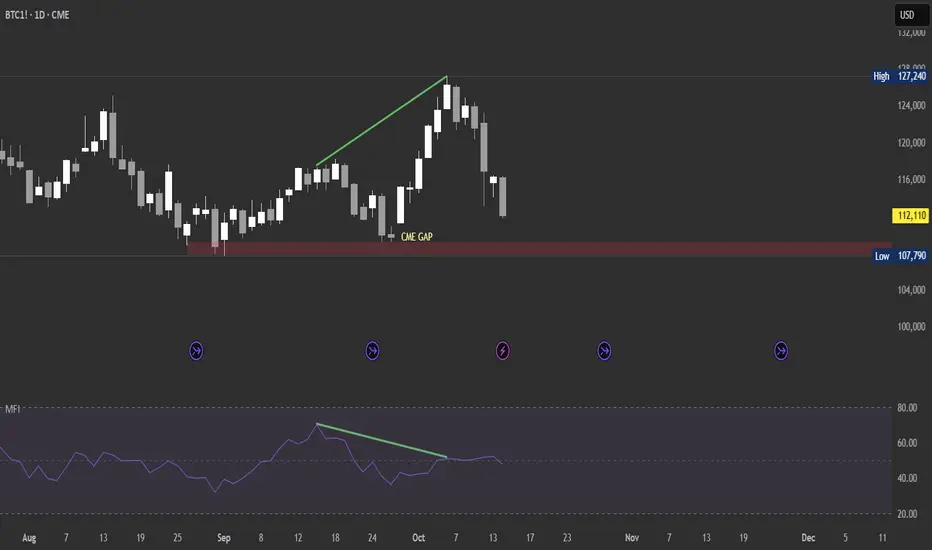
BTC heading to fill the CME GAPBTC looks like it's heading to fill the CME gap on the daily timeframe. That red zone could act as a strong support and a good level to go long under ideal conditions — unless our orange head decides to rig it again. Peace
$BTC Bearish Engulfing Candle AlertGOOD NEWS:
-CME Gap was completely filled.
-PA is still above the 20DMA.
BAD NEWS:
-Very concerning Bearish Engulfing candle on the Daily Close.
-Volume confirms the change in trend.
MY TAKE: I wouldn't be surprised to see the market rally into a low liquidity weekend and dump hard on Monday.
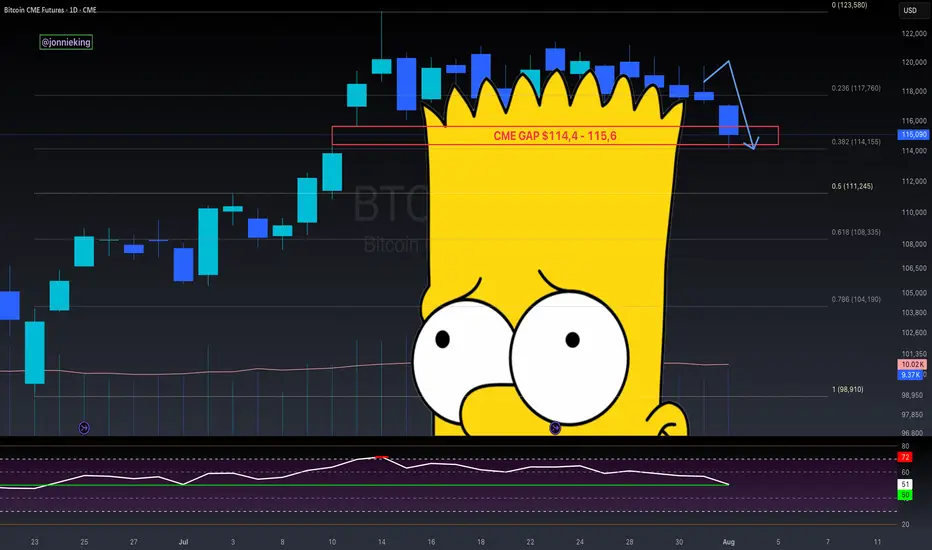
$BTC CME Gap + Bad Bart = Easiest Short EverCME Gap + Bad Bart is like taking candy from a baby 👨🏻🍼
Look at that textbook bounce off the .382 Fib 🤓
Pain ain’t over folks.
RSI still shows room on the downside 📉
Global Liquidity drain on the 4th.
Looking like the 50% Gann Level is next ~$111k
Get those bids in 😎
And never forget the BullTards who were telling you about the “Bollinger Band Squeeze” and UpOnly season 🫠
ETH/USDTbtc $85k is high liquidation and cme gap zone.
once these tariff headlines slow down bitcoin will be pulled toward these magnet levels

Bitcoin Rising to Fill most recent CME GAP - what then ?We have seen some pretty Good CME Gaps in recent months, a sign of volatility.
And, as I have been saying, CME GAPS ALWAYS GET FILLLED
the proof of that is right here, showing you the recent ones.
So, eight now, we are filling a gap from Below
The question is, what will we do than? Once the Gap is filled at around 86485
I would be a Very rich man if I knew for sure but as I have been saying in a few posts, I do not think PA is fully ready to berak out just yet BUT we may see a push higher to around 90K before it returns to the Low, maybe even to dip lower into the 73K zone.
But, obviously, this may not happen. However, Next time you see a CME Gap, understand it WILL get Filled.
If in a bull run Move, it will remain a gap till a later date, or, as we range as we are now, you can see howe this happens.
The Dips are great buying opportunists
Almost like the Fair Value Gaps ( FVG )
Stay safe

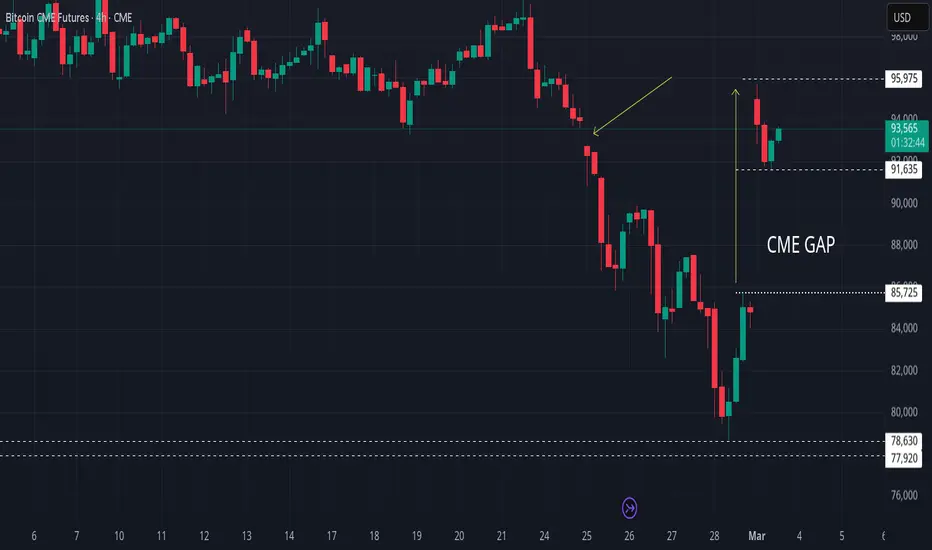
Bitcoin CME Gap Wars continue with a Bigger New Gap- what next ?
Last week we saw the Bitcoin PA Drop down and begin filling that existing CME gap, that had opened in Nov 2024
CME Gaps ALWAYS get filled I said. And they usualy do
PA got down to 78600 and bounced back up. It had NOT completely filled the Gap, leaving a gap from 78600 down to 77920.
This is a small gap But significant in that the BTC Bulls pushed PA up before the gap was filled....waving 2 fingers at he CME.
CME Closes for the Weekend and the price at close on Friday evening was around 85345
I thought we were going to see PA turn and drop back down to complete the Fill..I even had a Spot Buy order down there..
BUT NO - The Bulls arrived again and BANG-
When CME opened for the New weeks trading, Bitcoin was up at EXACTLY 95K
This had created a NEW gap, with the remains of the older one just below.
And so now, Whats next ?
Since then, PA dropped to 91635, Filling a more recent smaller gap and has since then, pushed back up higher.
When will the Bigger new Gap get filled ?
We have a number of possible scenarios and I think my preferred one is that we revisit the Lower levels, Fill the Gap and at the same time, continue to cool off that Still Bearish weekly MACD., whihc, once at Neutral, will have more than enough ability to push to s decent new Cycle ATH in Q4
Another option is that BTC PA ranges high, for Longer and Cools off that Weekly MACD, till around June, Leave the gap open for a later date
OR, PA Simply pushes to a New ATH now, exhausts itself and falls hard after, filling the Gap as it plunges to 65K or Lower.
Take your pick
The MACRO side of Xrypto now is noce but I do worry about how this cold all just make Bitcoin rise to Fast and go POP at the top
We need to continue the Slow Steady rise, maintain a balance and act like Adults..Not like Teenagers with a new Bag of Sweets.
Be REALLY careful righ tnow, But MAKE MONEY TOO But remain cautious.
This Gap WILL GET FILLED ONE DAY
BTC CMEThe CME gap at 93k has been filled,but due to the announcement on sunday, wall street and CME bears got wrecked as TradFi was closed.

BTC CME gap finally filledCME gap filled. And look how it respected it. Now, still everyone is convinced that cme gap, is only a conspiracy?

BTC CME GAPS (4H)Bitcoin has two gaps on the CME chart.
The first gap has been filled. There’s another gap at $77,000, and it remains to be seen whether this gap will be filled before the price moves higher or if it won’t be filled anytime soon.
Currently, it's the end-of-year holiday season, trading volume has decreased, and we are observing dumps and pumps within a range-bound movement.
For risk management, please don't forget stop loss and capital management
Comment if you have any questions
Thank You

BTC SHORT TERM Road for 78K Level for btc to get the CME gap filled? I think it is likely to happen. It is ok, if BTC goes down we can make money anyway.

Bitcoin CME Gaps get filled normalyALWAYS look at the CME chart
BITCOIN CME GAPS
The Daily chart shows us one that is still open and down to 58900
For me, this is HIGHLY likely to get filled
So, SPOT BUY order placed at 59K ( not advice, just what I have done ) - Lets see if it gets filled.
What this highlights is simply that the CME is a Major player now. Look at the previous gaps that have been filled
It has the LARGEST share of FUTURES trades in the 'Bitcoin environment", overtaking Binance earlier in the year.
It HAS the power and it WILL use it.
We just have to play along, be smart and understand that most of the time, GAPS get filled. Knowing this can give you very good buying opportunities.
Just be careful when the bull run hits....they may get left behind till the Bear market hits...THEN the Gaps can give us ideas of retracement levels to come.
Lets see how thins plays out

We have a CME Gap to Fill - Below current PAI have not Looked at the CME GAPS Chart for a while and here it is
WE HAVE A NEW GAP TP FILL..2 in fact but the lower one is so small it may not be worth the workl to fill it.
90% of Gaps get filled and given the dominance that CME Futures has now in the Bitcoin Market, I see no reason why this one will not also be filled.
So, PA is very likely to descend to lower line to Fill the Gap
Depending on Bull pressure, PA may turn before
Top Line at 62085
Bottom line at 60190
I have placed a SPOT BUY at 60200
Lets see if it fills.
NOY ADVICE JUST MY OPINION

BTC CME ANALYSISThis is the CME chart where we can see the Bitcoin GAPs.
In the range of 66360 - 64190 we have a GAP that may be filled.
We have also had a bearish CH and the price has reached supply.
If the gap fills up, it's a good time to look for buy/long trades

BTC CME GAP- Just posting to monitor the new gap.
- Not an Analysis.
- This new gap can be taken back fast or can be taken back later at next bear market.
- The Legend of the Gap.
Happy Tr4Ding !


#bitcoin #btc has closed a historical #CME #GAPAs you see on the chart, there was very important #CMEFUTURES gap at 35 - 36K area which was opened in #luna collapse times. Now, #btcusdt price has CLOSED this historical gap and what now?
It' s too early to say #btcprice will go on through the #bullrun or " BTC will directly go to close the OTHER historical GAP at 20 - 21K region!.."
Now, just relax and watch the #market and especially #BTCdominance. #BTCD will reveal the direction of the market. I will update my thoughts.
As you see on the chart, there only 1 #CME #FUTURES #GAP left at 20 - 21K region. Don' t underestimate this and also don' t be pessimistic, just carefully watch #bitcoin moves.
NOT FINANCIAL ADVICE. Dyor.

BTC CME gaps to be filled We are entering an important zone ➡️ above previous high and around 0.5fib...
Let's wait and see if we support or lose the R/S line. When lose, I close my long CRYPTOCAP:BTC position and start to look for short setups... If we support, we will continue 🐨
Be alert...
#trading #bitcoin

CME Gaps: Don't Ignore Them... How often have you heard this term “CME gap” on Twitter, Reddit and other social media platforms. People usually refer to CME gaps during and after the weekends. “There is a CME gap at $9800”, “Bitcoin is about to make a huge gap on the CME chart”, “gap has been filled” and so on.
What is CME
CME stands for Chicago Mercantile Exchange. It is the world’s largest financial derivatives exchange. This futures platform allows one to trade variety of asset classes like: agricultural products, energy, stock indices, fiat currencies, interest rates, real estates, metals and even they have futures trading options for weather.
What is a GAP
To put it plainly; A gap is simply an area on a chart that has no trades. It is basically an empty space between the close and open price of an asset. You can see the current gap just filled down at 19k-20k last week.
CME Bitcoin futures gap: Bitcoin (BTC) is being traded 24/7 on majority of crypto exchanges, but not on CME. Bitcoin does not trade during weekends on CME and this causes gap on CME chart once the trading resumes on the platform. The CME gap on Bitcoin typically occurs when the price of Bitcoin moves after the CME futures market is closed. Once CME opens; the trade on CME resumes at the same price as other Bitcoin exchanges thus creating a gap on the CME chart.
Why do they fill?
Price gaps getting filled is not just a CME phenomenon and is not just a Bitcoin thing. It’s a common occurrence that can also be seen quite regularly within stock and traditional markets. In most cases the price tend to fill the gaps and due to this many technical analysts consider gaps when doing price analysis. But why do they fill?
In physics there is a famous saying: “Nature abhors a vacuum“. This idiom is used to express the idea that any unfilled, empty spaces are unnatural and goes against the laws of physics and nature. This is based on Aristotle’s observation. Nature contains no vacuums because the denser surrounding material continuum would immediately fill the rarity of an incipient void.
Could this possibly be the reason why the gaps are getting filled?
Well, there are several different theories regarding this but the fact is no one exactly knows why gaps fill.
Trading based on BTC gaps
Although CME accounts for a large portion of BTC traded volume, the price of Bitcoin does not necessarily gravitate towards CME gaps. There are so many other factors such as Volume, momentum, buy / sell pressure, technical structures, support / resistance and many more.Traders consider gaps as an interesting marker on a chart. But they don’t necessarily trade on as they are not always a reliable indicator. They have high hit rate and so using them on your technical analysis will help you position yourself on the right side of the trade. However taking a trade solely based on this one factor is a wrong move. Trading gaps seems like an easy strategy but the risks are high and in most cases you’ll be on the losing side. So do not risk your trade account with just this one strategy. Use proper risk management, set stop losses and be sure to trade safe.
Apart from this there are other types of gaps which traders use in their technical analysis like for example: Liquidity gap, Breakaway, Balanced price range, Fair Value gap and so on...
I have located all the 'Unfilled' CME BTC gaps in the chart...

CME Gaps to watch in 2022There is a possibility that BTC will drop to $31000, $25000, $19000 levels again. Closely monitor indicated CME gaps in the chart and buy bitcoin in those levels.
