#BTCD On the blue box, close all your longs.#BTCD On the blue box, close all your longs...
After 3755, I will close all my long positions. BTCD will suddenly rise, which will cause a market crash. Those in profit on longs should book their profits, and those in loss should save themselves from bigger losses. #ETH can go down near 2900, so you can imagine what will happen to the rest of the alts.
We’ll keep checking the remaining updates.
!! Jai Baba Ki !!
Btccrashcoming

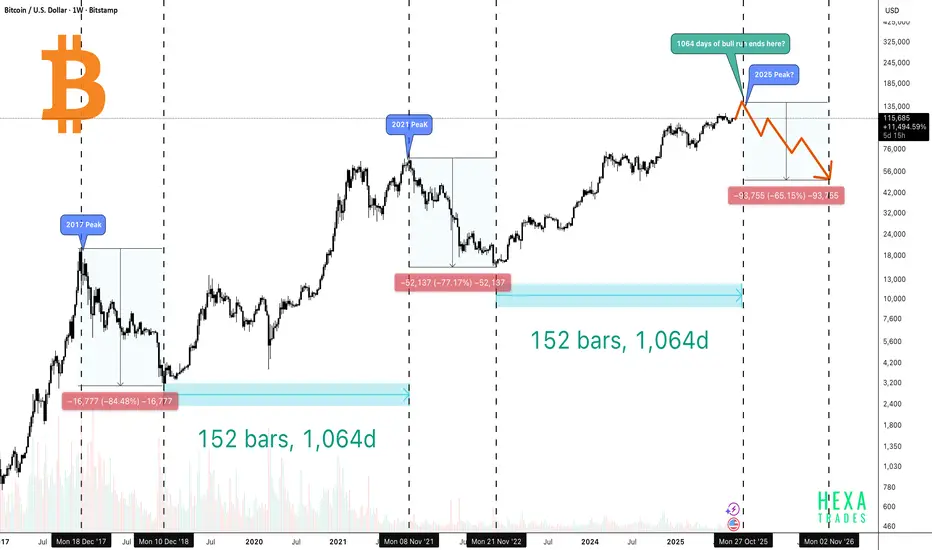
Bitcoin Peak Coming in 45 Days?The above chart compares Bitcoin’s previous market cycles (2017 and 2021) with its current trajectory in 2025, aiming to identify whether history might be repeating. It highlights how long Bitcoin’s bull runs last, how steep the crashes are afterward, and when the next peak and correction could happen.
🔶 2017 Peak
- Bitcoin topped out in December 2017.
- After the peak, BTC crashed by -84%, dropping from around $20K to nearly $3K.
- The bear market lasted about 1 year of decline, followed by roughly 1,065 days of bull run from the bottom before a new cycle peak.
🔶 2021 Peak
- Bitcoin peaked again in November 2021.
- Price fell by -77%, retracing from nearly $69K to about $15K.
- Similarly, the downturn lasted around 1 year of drop, and the recovery phase extended for about 1,065 days of bull run from the bottom.
🔶 2025 Peak?
- If the pattern repeats, the next top could align around late October 2025 and reach the $140K–$150K range.(1,064–1,065 days from the December 2022 bottom).
- In every cycle, Bitcoin’s crash percentage has decreased, suggesting the asset is maturing. If this pattern repeats, we could see a 60–70% drop, pushing the price back toward the $40K–$60K range.
Conclusion
Bitcoin’s historical cycles suggest a repeating rhythm of 1 year of decline followed by ~3 years of recovery and growth. Both the 2017 and 2021 cycles lasted about 1,065 days from bottom to top, with each new bull run setting higher all-time highs and each crash becoming less severe.
If this pattern continues, Bitcoin could potentially reach the $140K–$150K range by late October 2025, before facing another correction in the 60–70% range, possibly pulling the price back to the $40K–$60K zone.
While the market shows signs of maturity with institutional adoption and reduced crash percentages, history reminds us that sharp corrections often follow euphoric peaks. For long-term investors, the lesson remains clear: cycles repeat, but opportunities also return.
Bitcoin Crash Incoming?Bitcoin Cycle Analysis – Are We Nearing the 2025 Peak?
The above chart highlights Bitcoin’s historical market cycles, which have shown a remarkable pattern of consistency over the past decade. Each bull cycle has lasted roughly 1,064 days from the cycle bottom to the cycle peak, followed by a sharp correction phase.
Historical Cycles
- 2013 Peak → After the 2011–2012 bottom, Bitcoin rallied for ~1,064 days before peaking in late 2013. This was followed by a deep bear market.
- 2017 Peak → From the 2015 bottom, Bitcoin surged over 12,000% in ~1,064 days, peaking in December 2017 before dropping 84%.
- 2021 Peak → From the December 2018 bottom, Bitcoin rallied for 1,064 days again, gaining over 2,000% and peaking in late 2021. The following year saw a 76% correction.
Current Cycle (2021–2025)
- The most recent bottom was established in late 2022, marking the start of the current cycle.
- We are now over 1,000 days into this bull run, and Bitcoin has gained approximately 675% so far.
- If the historical cycle length repeats, the 2025 peak could occur around late October 2025.
Price Projection Based on Curved Support & Resistance
- Bitcoin’s price action has respected a curved support–resistance channel across the past three cycles.
- If the same pattern continues, the current cycle could see Bitcoin touch the curved resistance around the $130K–$140K level in October 2025.
- Historically, October has been a bullish month for Bitcoin, with strong momentum in previous cycles. Notably, in October 2021, Bitcoin printed a powerful bullish candle that led to the cycle peak.
- If history repeats, we could see a similar October rally in 2025, potentially marking the cycle top.
After the peak, a correction in the range of 60–70% is expected, consistent with the pattern of diminishing drawdowns (84% → 76% → projected 60–70%). This would place the potential next cycle bottom in the $50K–$60K range.
Conclusion
Bitcoin is nearing the end of its 2021–2025 bull cycle, with a potential peak around $130K–$140K in October 2025. Historically, October has been a bullish month, and past cycles suggest a 60–70% correction could follow, likely bringing prices back to the $50K–$60K range. With diminishing corrections each cycle, the market shows signs of maturity, but caution and risk management remain essential as we approach the cycle top.
Cheers
Hexa
CRYPTOCAP:BTC BINANCE:BTCUSDT BITSTAMP:BTCUSD

Pepe/UsdtBINANCE:PEPEUSDT
Pepe looks **bullish** 📈 and is forming a good structure. Right now, it's facing key **resistance levels** 🏔️, where the price might struggle to go higher:
- **0.00001845** 🔴 #Resistance1
- **0.00001932** 🔴 #Resistance2
- **0.00001950** 🔴 #Resistance3
If the price can't break through these resistance levels, we might see it pull back. If it holds above those levels, the price could continue to move higher 🚀.
In case the price doesn’t hold and starts to drop, the next key **support levels** 🔻 are:
- **0.00001750** 🔵 #Support1
- **0.000016834** 🔵 #Support2
📉 **Resistance** = The ceiling. If the price hits resistance, it might fall back down.
📈 **Support** = The floor. If the price hits support, it could bounce back up.
If the price stays above resistance, we could see further bullish momentum, but if it drops below support, it might continue to decline.
Disclaimer : This is just analysis and not financial advice! Always do your own research. 💡

BTC\USD Ascending Broadening Wedge FALL ALERTIn this idea we have a ascending broadening wedge On Bitcoin that really matches the behavior we have witnessed recently. I did my best to project the targets we should see as we break out to the downside assuming that is how this moves. Maybe it will maybe it won't. Only time will tell. Good luck to everyone and much love- ND
Ps-If you look at the formation in smaller frames where we are now you will see the exact formation that is towards the end of the example.

OBJECTIVE DATA ANALYSIS OF BTC 5D Chart. Starting with the main price chart: there are no supply zones above. There is a bullish order block off the 07 SEP low at 52.7k. Also notice that price have not reached equilibrium yet which is what price always retraces to. That is around 44k which suprisingly (not) is the ETF entry price. Price is also at the top of the long term bearish channel. The price bars look pretty bearish. What will probz happen is break through OB at 53k, reject off bottom of it and go down to equilibrium. From there price will head toward its new ATH as it will finally have enough supply to get there. Cannot rule out the extreme imbalance in the market on the lower levels which can be seen if zoomed out.
Now for the AWPRVC the price cloud is starting to separate after being squeezed and is curling down crossing the short territority. It has already crossed the volume candles, volume candles have rejected off bottom once and is rejecting off it again. There is also bearish divergence in volume bars compared to the main chart price bars meaning price bars likely to go down.
The Hiken Ashi Algo V6 which integrates RSI with price and volume is consolidating and about to switch bearish as well as reject off the 75 percentile and hit back into the 50 percentile line (black) or reject off the volume wave.
IDK how many more bearish signs you need but ya. idc what you do with this info just trying to help some people. whether you think I am right or wrong, all i am doing is analyzing the data in front of me COINBASE:BTCUSD INDEX:BTCUSD BINANCE:BTCUSDT

BTC Swing Short Liquidity Zones:
Sellside Liquidity: Two key levels are identified:
- Near-term sellside liquidity around the support zone (approximately $53,423.59).
- Mid-level sellside liquidity marked above the current price.
Gap Analysis:
- CME Gap: Indicated within the blue shaded area, suggesting a potential drop to fill the gap left by CME futures.
Current Setup:
- The chart shows a potential bearish scenario where the price might drop to fill the CME gap and tap into the identified sellside liquidity areas.

12 June 2023: Bitcoin Drop to $11,300 Kuala Lumpur, 11 June: Meeting with top tier Malaysian hedge fund yesterday, we have currently agree for the future price of Bitcoin will be drop down to $11,300 price mark.
The decision was made from several factors and agreement between many parties and bodies.
From the mining sector on bitcoin, was too shabby for a moment and many of the miners has given up all the mining that contribute to the new money supply into the market was not suitable for the current condition.
While, SEC attacking the Binance right now and acquired the industry of decentralised to become centralised by the government body.
For most of the part of in the crypto industry, Binance crypto platform was the only defense mechanism among the huge holder old supply that hold the crypto industry at the moment.
Since, new money supply from mining bitcoin is not there for almost 24 months 2021-2023, it is a sign to revamp the crypto supply into the market.
On the other hand, SEC will make the CDBC going mainstream. When US Dollar is in digital, who else need the bitcoin and other memes token that cant be withdraw to people wallet as not much supply in the market.
Dollar in jeopardise as trillions in debt and still counting. While the Joe Biden sat on the throne that did not make any act that can boost the current crypto market.
People are right now losing confident already for almost 3 years in a row. People will eventually will make the digital US dollar in demand when it almost come to the mainstream when the chip after the chip of IC implemented on the palm worldwide.
The hype for the $1 million mark of bitcoin almost depleted. People can see now it is only the act of hype from the media to encourage young kids to get into the crypto while be other crypto millionaire be the role example in the market.
The BRICKS project that dethrone the US Dollar in the market, will almost done. Malaysia followed by all other country for not use Dollar into the system. While they printing money is still on going, someday it will collapse the finance system.
Bitcoin will once again visit the price of $11,300 on 1 Oct 2020 which is the mark for the most demand that led the Bitcoin spiked to $68,000 once in the span of 12 months.
ZEZUZAZA
2047

BTC LONGDeviation is done to the downside , we have LOADS of liquidity not in the downside no more but to the upside . This will be a trade for the books , to remember Forget the news , Fugasi etc and look at your only friend , the charts .
My last bet was to 22k but closed at 21 and shorted to 17,100
This time I think it'll go way longer to 29k or a tap of 30k

BTC Slow Bleeding Could End In A Catastrophic MoveBitcoin is slowly bleeding down and with todays news it could actually get volatile.
If we want to go lower before any retracement to the upside it could be all the way to 18.4 (big capitulation candle) or fill the gap (20400 to 20k) with a wick around 19.5 and bounce back up.
There is a big cluster of liquidation from 22.4 to 23.4 (near 8M) which shows a possible pullback there to grab those liquidation.
Bottom Line is Crash did not happen yet and is YET to happen.Longing is not recommended at all cause we could flood down.
DXY is looking very strong as SPX losing power day after day.
Details on Video
Please support the video in anyway you can by share,boost,comment

BTC/USD (POTENTIAL BUY/SELL LEVELS) ***BEARISH SENTIMENTThis is just my basic MONTHLY charting.
I have marked what I see as the POSSIBLE bottom (support).
I see overall DOWNTREND
I have marked my potential BUY LEVEL for SHORTS/PUTS.
***** IT IS MY PREFERENCE TO TRADE BTC/USD OVER HOLDING CURRENTLY.

BTC fall The critical 20k area for BTC is now converted to stiff resistance. We'll see if it drops again to lower amounts and at least 19K
let's see

BTC for the Downtrend BTC looking for a blood bath ?
9.15 am ( 5.30 + UTC ) BINANCE:BTCUSDT looks like for huge downtrend momentum with large volume portfolio. It s seems to gone around 18,500 - 19,000 range. Here is the one more confirmation thing to say ; 0.236 Fib Level available in around 18,500 - 18,900
*Let's see what will happen*

BTCUSD (BITCOIN)After the drop from 22k now price test its strong support trend line 19500 level. We also see rising wedge pattern and now bulls trying to hold this level. Bullish hammer candle shows the strength of bulls in the market. so after the break out of recent pullback high level 20010 after the cadle close above this level in 1h you can go #long in #btc.
TP1 20454$
TP2 21000$
TP3 21750(Swing trade)
SL 19400

bitcoin short or long 📉📈i think BTC down to 19850 $ , there are two ways after going down to 19850 $ .
First way 📉 ( plan A 70 % ) break the support and go to the red areas.
Second way 📈 ( plan B 30 % ) Rebound from the support to the green areas.
Plan A ( 70 % ) 📉 :
T1 : BTC ==> 19850$
T2 : BTC ==> 18850$
T3 : BTC ==> 17850$
Plan B ( 30 % ) 📈 :
T1 : BTC ==> 22850$
T2 : BTC ==> 24850$

Short term (very) Bearish BTC and ETH. Very long term Bull.Why I think BTC will fall further to $7,500. (ETH will most likely fall with it)
1. Long term support trends 'extension' resides around $7,500
2. Bear flags 1 & 3 ( flagpole #2 and flagpole #4) price estimates consolidate at the long term support trend area around $7,500
3. Elliott Correction Wave C started at the November 2021 peak, and the 5-wave impulse that makes up Wave C consolidates around $7,500.
Some very Large investment funds ( like 3AC and MicroStrategy ) are getting close to a margin call. Any collateralized BTC will be sold and may cause a cascading effect in liquidity pools.
If any large LP with high TVL amounts get effected, we may see a 'bank run' on LPs. This could then effect leveraged traders who then get margin called.
Any ETH locked up with BTC as collateral will get wrecked, further crashing the market, and (of course), people will panic sell during all of this.
...but, maybe all this just never happens and BTC hits $1 million this year?

BTC/USDT may drops more 30%HELLO FRIENDS, here we can see in 1 day timeframe and it showing barish flag pattern. If bitcoin rejects by its resistance I will fall up to 30% ($27,000). BITCOIN has Major resistance at $39,400 and $46,000. If you are a short term holder be careful...... FOLLOW FOR MORE...

WHALES WANT YOU TO BUYLook at a weekly perspective, whales are not trying to buy at this prices, they are trying to sell the crypto they posses. Always the crypto crashes are fast and then it consolidates for at least 6 to 8 months. We are gonna see a lot of bull traps to make us think it will go to the moon. 30K. First take profit for short. And if we have the oportunity to buy at 14k- 8k (The fixed range and volume of interest for whales massive buy) will be ideal for a new cycle of bull trend. Cryptos are very interesting right now i'm not gonna lie.

BTC demand getting weakerBitcoin hit ATH in OCT 10 but interest is getting lower. I've checked trends and it's getting worse by months despite ATH. All attention goes to other crypto projects and NFT's.
At this moment crypto interest and demand are getting weaker too despite BTC ATH but NFT is at the biggest peak right now, which is a sign of overvalue.
Time and price match. All of this shows that big moves are approaching and unfortunately I see down.
Assess the risk by yourself.
It's only my view and opinion.

BTC DAILY CHARTBTC at the resistance now little push will be led btc towards 50.5k which is good for shorting , tp will be 39k. btc crashed coming soon in next 60 hours, be safe trading, you can see the chart three cross from where btc will be rejected and then dump heavily.

Another Head and Shoulders on BTCUSDFound another Head and Shoulders pattern on 4h this time! If we got a 4h close below the neckline i.e. around $47000, we can see the price at $46600 which is 100 Exponential Moving Average in 4h timeframe. I am expecting a price pullback from this level to retest the neckline of Heads and Shoulders.
If the retest is done successfully, on breaking the previous local low i.e. $46600, we can get a support at $46000 (daily EMA support). Technically, targets are around the same $42000 weekly/daily support region which I have also marked in my previous idea " : Price Action & My Opinion":
If we look in Daily Timeframe the price, we can also observe a Ascending Broadening Wedge Pattern which can broke on either sides!
Muneeb

BTC CRASH !!! (Give it some thought)NOTE: This is not a trading idea, yet more of a overdramatic fundamental outlook As countries continue to ban BTC /BTC mining /Crypto Exchanges
There has been massive manipulation the past year in the world of crypto. Institutions clearly understand the value of crypto currency. I wont sit here and say I have it all figured out. However, as the economy continues to collapse and debt increasing along with new formulas to account for inflation. Its very possible we can see an epic crash in the crypto community as the worlds top 1% make a few adjustments to their portfolios. We must understand there has been a massive shift in wealth over the past year or two til this point. From reputable strong hands to significantly weaker hands much due to the digital age where we would suspect the youth and techies to dominate.
Although wealth has shifted it is not wise to forget there are several old money players yet to voice their move. Diversification could actually be the shakeout smart players are looking for, think it is likely they have much more assets that will allow for them a longer wait time before making their entry. I will admit $6k - $10k could be a bit dramatic. However, use case for BTC and crypto could be pretty for the next 3 years as much traction is gained in the community. This could be a very long re-accumulation period.
As you may have noticed. Social media has been a tremendous contribution to the rapid growth within the crypto community. Mainly suggestive tweets, celebrity endorsement, and personalize token/coin creations. All performed by those who have massive mounds of liquid capital to invest, re-invest, and hodl.
Crude Oil industries could possible accumulate the greatest lost ever seen by the year 2025. California will have its commuters in fully electric vehicles within the next decade. Not long after many other states will follow the same suit. creating a larger demand for renewable and clean energy sources. Think of the transition itself. Oil will become a high dollar ticket item for sure. As it becomes scarce the value of EV will increase rapidly creating a higher demand for all tech industries to rapidly develope techncal integrations from the EV's into our phones as well as our livelihood.
What we have experienced the past year is a teaser hinting to the inevitable conclusion we have been teased about through the generations.
If the above information holds and true weight, I would suspect massive downsides in the near future to account for a new structure of power by governments and Tech industry leaders.
Just keep this in the back of your brain for now.
SIDE NOTE:
ETH = Energy (Think on it)
Watchlist for this though
Tron
Doge
ETH
BTC
BAT
LINK
VET
OXT
TESLA
SPCE
Coinbase
XRP
XLM
BINANCE:TRXUSDT
BITFINEX:DOGEUSD
BITSTAMP:ETHUSD
NYSE:SPCE
CAPITALCOM:OIL_CRUDE

