BTC.D is about to dip – time for altcoins to shine?First of all, you should know that BTCDOM is a price index that shows Bitcoin’s market volume performance compared to altcoins. This index indicates how much market money is moving toward Bitcoin relative to other cryptocurrencies and can be useful for traders.
What is the difference between BTCDOM and BTC.D?
BTC.D: The traditional Bitcoin dominance index, showing the ratio of BTC’s market value to the total crypto market value as a percentage.
BTCDOM: A version of dominance available on Binance as a tradable instrument (futures), usually showing Bitcoin dominance relative to the top 20 altcoins (not the entire market).
The BTCDOM symbol has formed a price range, with the top of this range acting as a liquidity pool that was hunted. Now, the price is forming a double top pattern.
The trendlines have also been broken. It is expected to move soon toward the two targets marked on the chart, which could trigger a rally in altcoins.
If a daily candle closes above the invalidation level, this analysis will be invalidated.
If you have a coin or altcoin you want analyzed, first hit the like button and then comment its name so I can review it for you.
This is not a trade setup, as it has no precise stop-loss, stop, or target. I do not publish my trade setups here.
Btcdom

BTC Dominance (BTC.D) – Weekly Chart BTC Dominance (BTC.D) – Weekly Chart | Full Details (with 25MA and 100 MA)
BTC.D is trading within a long-term descending channel. After a strong recovery from the 2022 lows, the dominance is now stalling near the mid-range resistance (~59–60%).
25 MA: Tracks short-term momentum
BTC.D is hovering around/slightly below the 25 MA.
100 MA: The price is still above the 100 MA, meaning the overall BTC dominance trend has not yet broken down.
A break below the 100 MA would signal a significant shift towards altcoin strength.
This is a decision zone.
BTC dominance is not yet bearish, but the strength of the uptrend is weakening.
Keep a close eye on the MA — they will guide the next move.
DYOR | NFA

#BTC.D Update: Charts Don’t Lie.The Hidden Altcoin Opportunity!💬 Bitcoin vs BTC Dominance Update:
While many of you are stressing about Bitcoin, BTC Dominance is flashing multiple bearish signals.
Technically, BTC.D looks ready for a massive drop, and that’s extremely bullish for altcoins.
Those 80% crashes in alts? In my opinion, they’re opportunities, not reasons to panic.
This is a big moment, and very few people can see what’s coming.
I’ve been calling altseasons with high accuracy since 2017, and I’ll say it again,
Alts will have their time.
Focus on new altcoin launches that don’t have heavy bag-holders.
The era of long-term big-cap alts is fading.
You get into altcoins to stack more BTC, and stables always remember that.
Our strategy for the next few months:
👉 Spot trading selective altcoins
👉 Gradually increasing portfolio exposure
If you’re interested, I’ll be sharing new altcoin picks soon. Show some support on this chart.
Multiple indicators, such as VWAP, MACD, StochRSI, candlestick patterns, and oscillators, are all signalling a bearish move in BTC Dominance soon.
So look at the bright side.
❌Invalidation: Break and close above the upper resistance trendline.
DYOR | NFA
If this update helped you, please hit the like button 👍
Thank you.
#PEACE ✌️

Market analysis using bitcoin dominance & usdt dominance chartsWe aim to conduct an in-depth analysis of the correlations among four key indicators used to interpret the complex dynamics and investor sentiment in the cryptocurrency market — Bitcoin Dominance, USDT Dominance, TOTAL3, and the Coinbase Premium — and to share insights on how these can be effectively utilized in real trading strategies.
By analyzing these four indicators together, traders can identify the overall market trend, gauge the vitality of the altcoin market, and assess institutional participation, which provides a foundation for developing mid- to long-term trading strategies.
First, please click Boost (🚀) so that more people can see this post.
💡Understanding the Key Indicators
Bitcoin Dominance: CRYPTOCAP:BTC.D
The ratio of Bitcoin’s market capitalization to the total cryptocurrency market capitalization.
It represents Bitcoin’s market strength relative to altcoins.
USDT Dominance: CRYPTOCAP:USDT.D
The ratio of Tether (USDT) market capitalization to the total cryptocurrency market capitalization.
It helps identify risk-on/risk-off sentiment among investors and assess the level of market liquidity.
TOTAL3: CRYPTOCAP:TOTAL3
The total market capitalization of all altcoins excluding Bitcoin (BTC) and Ethereum (ETH).
It directly reflects the overall momentum of the altcoin market.
Coinbase Premium Index: TradingView Indicator
An indicator showing the price difference of BTC between Coinbase and other major exchanges (e.g., Binance).
It is used to indirectly gauge institutional buying pressure (positive premium) or selling pressure (negative premium) in the U.S. market.
⚙️Interaction of Indicators and Trading Strategies
These four indicators exhibit specific patterns under different market conditions.
By analyzing them comprehensively, traders can identify medium- and long-term trading opportunities.
Correlation between BTC price and indicators:
BTC price vs BTC.D: Complex correlation.
BTC price vs USDT.D: Mostly inverse correlation (USDT.D rising = market uncertainty and BTC decline)
BTC price vs TOTAL3: Mostly Positive correlation (BTC rise = TOTAL3 rise)
BTC price vs Coinbase Premium: Mostly Positive correlation (sustained positive premium = continued BTC uptrend)
✔️Scenario 1: Bullish Phase📈 (Bitcoin-led Rally)
BTC.D rises: Capital concentrates into Bitcoin
USDT.D falls: Increased risk appetite, cash inflows grow
TOTAL3 moves sideways or slightly upward: Altcoins remain weak or unresponsive
Coinbase Premium rises and stays positive: Institutional buying inflow
Interpretation:
Strong institutional buying of Bitcoin drives the market, with capital shifting from stablecoins into BTC.
Altcoins may lag behind this movement initially.
Strategy:
If the Coinbase Premium remains positive even during minor BTC corrections, it favors building long BTC positions.
When the positive premium persists and BTC breaks key resistance levels, it can be interpreted as a strong buy signal.
During early stages, focus primarily on Bitcoin rather than altcoins.
✔️Scenario 2: Strong Bull Market📈 (Altcoins Join the Rally)
BTC.D declines: Capital rotates from Bitcoin to altcoins
USDT.D declines: Ongoing risk appetite and continuous inflows
TOTAL3 rises: Peak momentum in the altcoin market
Coinbase Premium remains positive: Continuous liquidity inflow
Interpretation:
As Bitcoin stabilizes or trends upward, capital starts flowing aggressively into altcoins.
The rise in TOTAL3 reflects broad-based strength across the altcoin market.
Strategy:
Select fundamentally strong altcoins and build positions gradually.
During this phase, large-cap and small-cap thematic groups may experience rotational pumps — monitoring related narratives is crucial.
✔️Scenario 3: Bearish Market📉
BTC.D rises: Altcoins fall more sharply as BTC declines
USDT.D rises: Strengthened risk aversion and increased cash positions
TOTAL3 declines: Deepening weakness in the altcoin market
Coinbase Premium drops and stays negative: Institutional selling or halted buying
Interpretation:
Heightened market anxiety leads investors to liquidate risk assets and move into stable holdings such as USDT.
Institutional selling pressure pushes the Coinbase Premium negative or maintains it in a downward trend.
Altcoins are likely to experience the greatest losses in this phase.
Strategy:
Reduce crypto exposure or convert positions to stable assets (USDT) for risk management.
During technical rebounds, consider trimming positions or cautiously taking short opportunities (with higher risk).
✔️Scenario 4: Sideways or Correction Phase
BTC.D moves sideways: Range-bound consolidation
USDT.D moves sideways: Persistent risk aversion and lower market volume
TOTAL3 moves sideways: Altcoin market remains flat or slightly weak
Coinbase Premium stable: Fluctuates between positive and negative values
Interpretation:
The market enters a wait-and-see phase with sideways movement or mild correction.
The Coinbase Premium’s neutrality reflects uncertainty in institutional capital flows.
Strategy:
Monitor BTC and TOTAL3 reactions at major support levels before re-entering positions.
It may be prudent to stay on the sidelines until clear institutional accumulation or positive catalysts emerge to restore sentiment.
🎯TradingView Chart Setup and Usage Tips
Multi-Chart Layout: Use TradingView’s multi-chart feature to display BTCUSDT, BTC.D, USDT.D, and TOTAL3 simultaneously for comparative analysis. (Apply Coinbase Premium as an additional indicator.)
Timeframes: For short-term analysis, use 1H, 4H, or 1D; for medium- to long-term, use 1W or 1M charts. Confidence increases when multiple indicators align across the same timeframe.
Trendlines and Support/Resistance: Draw trendlines, support, and resistance on each indicator chart to identify key inflection points. Breakouts on USDT.D or BTC.D often signal major market shifts.
Supplementary Indicators: Combine RSI, MACD, or other technical indicators to detect divergences or overbought/oversold zones for added precision.
⚡Analytical Value and Considerations
Comprehensive Market Insight: Analyzing all four indicators together enhances overall market understanding.
Leading vs Lagging Indicators: Coinbase Premium can serve as a leading signal, while dominance and market cap metrics act as coincident indicators reflecting current conditions.
Probabilistic Nature: These indicators are not predictive tools but should be interpreted within a broader context of market variables.
Risk Management: Always apply stop-loss measures and manage exposure carefully. Be prepared for deviations from expected market behavior.
🌍Conclusion
Bitcoin Dominance, USDT Dominance, TOTAL3, and the Coinbase Premium Index are fundamental components in decoding the complex structure of the cryptocurrency market.
Analyzing them in conjunction enables a deeper understanding of market sentiment, anticipation of upcoming opportunities and risks, and the development of a more intelligent and stable trading strategy.
💬 If you found this analysis insightful, share your thoughts in the comments!
🚀 Don’t forget to hit Boost to support the post!
🔔 Follow to make sure you don’t miss the next market insight!
Altcoin Fear Rising — But Liquidity Shift Is ComingI know the current pullback on altcoins has greatly increased the fear of a deeper drop, especially since Bitcoin just hit a new all-time high at $126,200 yesterday.
Yet, the Bitcoin Dominance Index (BTCDOM/USDT) shows that the price is getting ready for a major decline.
This suggests that liquidity could soon start flowing into altcoins, potentially starting this week.

BTC.D Alt coins updatewait for the monthly candle closure and to form a fvg / gap, whenever it taps into the monthly fvg, start acculumating altcoins, invest good in stronger altcoins like ETH, Link, ENA, SEI, INJ and stronger memes like Doge, Fartcoin, Bonk and Turbo. These pairs are my favourite and will outperform in alt season. Because btc.d is strongly bearish that's why not giving any short signal for alts, ignore what's BTC doing. Market makers are just flushing the long / buyers before a strong impulsive moves. October first week or maybe the 2nd week may go in red then the real strong move will start. Market makers are just showing the market is strongly bearish, shifted structre to the downside trapping all smc/ict traders and other breakout traders to trap for short selling as they did in feb. Best Of Luck.

Bitcoin Dominance Continue Dropping, Dec. 2024 Support HoldsThe uptrend ended the 23-June 2025 week. On this date, the index at hand started to decline; Bitcoin Dominance (BTC.D) turned bearish.
Notice how many altcoins bottomed in April, the majority, and yet BTC.D did not peak until June. A delayed effect.
The downtrend is now on and undeniable; the altcoins bull market is now on and undeniable.
The downtrend is unraveling but far from being done. Bearish momentum is building up but we have not seen the true potential of the altcoins market. As Bitcoin Dominance moves down, the altcoins market moves up.
In July BTC.D took a pause, two green weeks. It closed green and the third week we saw the resumption of the bearish move and trend.
In August, late August, now, BTC.D is taking another pause, about to close one week green. This should not be taken as the end of the altcoins bull market, not at all. The market is only becoming stronger to produce even higher, bigger and better growth.
The low from November-December 2024 (54.56%) is still intact as support. Cryptocurrency market prices are going much higher this time around; the cycle will be much longer, this support is sure to break based on TA, with the index moving much lower.
Back in late 2024 the bullish wave for the altcoins lasted exactly 1 month. After this major rise, we had a decline lasting many months.
Things are different now. BTC.D has been going down for weeks, 10 weeks but the index is still trading pretty high and that's my main point. There is still plenty of room for this index to drop.
Sell when prices are up. Bearish potential develops after a major uptrend; out of a top. This top is present here and from here down-we go. The index again, of course; Crypto is going up.
Namaste.
BTCUSD Short Opportunity, Bears Take Control BTCUSD is currently trading around 116,980, facing strong rejection near the 117,200–117,500 resistance zone. The recent price action suggests that sellers are gaining control as bullish momentum fades. A sustained move below 116,800 could trigger further downside pressure, pushing Bitcoin toward 115,500 and 114,800 in the short term. If the bearish structure remains intact, the next major target lies near the psychological level of 110,000, which aligns with previous demand zones and a key Fibonacci retracement level. Stop-loss should ideally be placed above 117,600 to protect against any false breakouts. Watch for increased volatility during US trading hours and upcoming macroeconomic data releases, as these could accelerate the move. Overall bias remains strongly bearish as long as BTC trades below 117,500.

Bitcoin Dominance Continues To Drop (Bullish Crypto)While Bitcoin Dominance (BTC.D) continues to drop, the altcoins continue to consolidate, to recover. Not all of them are up and to be honest, most of them are down, and this is good news.
Even after all this time and all we've seen and waited, still, there are many opportunities available; meaning, it is still early in this bull market bullish cycle and wave. There is still time to buy at low prices. But...
There is a "but." Many pairs are no longer great to buy. Some examples are the obvious ETHUSDT, BTCUSDT and those trading high up. Don't get me wrong, these pairs can be traded all of the time, over and over, again and again, but, the best prices possible are no more and this will increase the complexity of our new entries and how much money we can make. Risk also becomes higher. No worries though, when one door closes, seven hundred new doors open. Opportunities are endless in this market.
Bitcoin Dominance Index bearish bias remains intact, in fact, it continues to strengthen. This means that Bitcoin will continue to grow and the altcoins as well. Truly, this is all we need. We already have more than enough signals, but one more can't hurt.
Bring the bullish storm. Crypto will change your life for the better, if not now, in the future.
Thank you for reading.
Namaste.

Bullish Now, Bitcoin & The Altcoins · 2025 Bull Market ContinuesThe altcoins market cannot be bearish at the same time that Bitcoin Dominance (BTC.D) is bearish. When Bitcoin Dominance is bearish the altcoins market is bullish. When the altcoins market is bullish Bitcoin is already growing or set to grow.
Here we have the daily chart for Bitcoin Dominance. Here we have a full break of support. The bearish bias only continues to strengthen and is supported by really high volume. As Bitcoin Dominance moves lower, the altcoins move higher.
You can see a huge rounded top pattern as well as a very strong decline started late June. Notice that the strongest decline before this June was November 2024. November 2024 was when the entire altcoins market produced a strong advance. This was the first signal and also the bottom for many altcoins (ALTS vs BTC pairs). Things are changing.
The dynamics we are about to experience between Bitcoin and the altcoins market is something not seen ever before. The market evolved for years, is evolving and continues to evolve and this evolution will be reflected in market price action and the charts. The charts will be different and how the altcoins behave in relation to Bitcoin and each other. The market will continue to become harder to read, predict and understand. It is just natural. We human becomes more mentally complex as we become older, it is the same system.
A bearish bias on this index confirms the continuation of the bullish wave for the altcoins. This is all you need to know. You need to know that Bitcoin and the altcoins market will continue to grow. Not months into the future, not years into the future, short-term. We are going up now.
Thank you for reading.
Namaste.

Bitcoin Dominance (BTCDOM) Headed Toward MA200 @2277Here we have Bitcoin Dominance (BTCDOM) but this time through the perpetual futures contract on Binance, weekly timeframe.
The bearish bias is fully confirmed—already a developing phenomena—it has been happening for months.
A little more than two months ago, on the 16-June week, BTCDOM peaked and started dropping. The break of the uptrend was confirmed with four consecutive weeks BTCDOM closing red. The action went below our short-term moving averages and also below a strong Fib. retracement level.
The last two weeks closed red. This is the third week and while it is green, most of the space won has been lost. The current candle is a bearish hammer, a continuation of the previous two and of the broader bearish move.
While BTCDOM was rising for years volume was dropping for years. This volume divergence supports the structure breakdown we are seeing now. The next support is found around MA200, black line on the chart. This indicator has a reading of 2277. MA200 falls between 0.618 and 0.786 Fib retracement.
As Bitcoin Dominance moves down (BTCDOM), Bitcoin (BTCUSD) and the altcoins (TOTAL) grow.
Namaste.

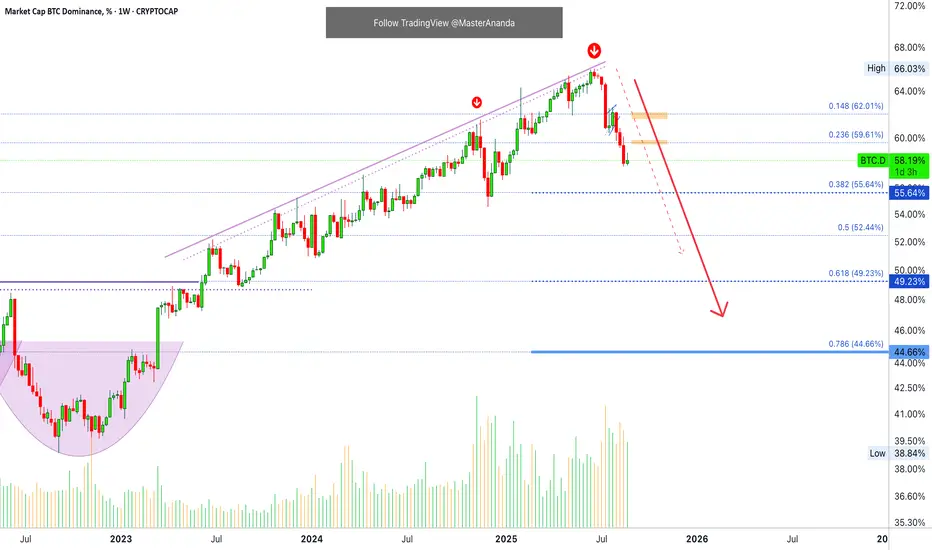
Bitcoin Dominance Below 60% & Below SupportBTCD just lost the 0.236 Fib. retracement support, the next level to be tested immediately is 55.64 followed by 52.44 followed by 49.23. All these are high probability targets.
The week closes today and is red. The chart drawings, patterns and signals are bearish; bearish confirmed, pointing lower and support additional bearish action. Everything points down for this index and the volume is just too strong. The downtrend is on.
The drop is about to intensify next week. Last week was the continuation and this week the confirmation. Now we will experience the meat of the current move. This is when bearish momentum intensifies.
Thinking of the inverse relation between Bitcoin Dominance Index (BTC.D) and Bitcoin (BTCUSD) and the altcoins, this means that the 2025 bull market is about to speed up. We are about to see a massive influx of capital into the market and a large amount of bullish momentum.
Remember, Bitcoin will also grow.
Bitcoin and the altcoins market is going up.
Ethereum will continue growing.
Be prepared, no more red.
(As Bitcoin Dominance goes down, Crypto goes up.)
Namaste.
ALT SZNThe altseason is starting. I expect a small pullback, followed by an altcoin rally that will last until mid-2026.
BTC DOMINANCE UPDATE- So, all elements are annotated throughout the graphic, like always.
- Timeline.
- Older Top Dom (2021) (red doted line).
- New Top Dom (2025) (red line).
- Some supports ( Orange Line ).
- Some Bottoms ( Green Lines ).
- Most important in chart : Fibonnacci Retracements.
- After this chart, I’ll drop links to my older BTC dominance posts.
- Not much to say, just look at the chart :
- In 2021, BTC.D formed a double top because Bitcoin spiked twice and hit two all-time highs.
- That doesn’t mean BTC.D will behave the same way in 2025. I don't expect another double top, but who knows.
- We could see a retracement down to the 45–47% range. That would likely signal the start of a new bear market.
- For now, i don’t see the end of the bull run yet. I’m mostly waiting for a strong BTC push in price, a fast dip in BTC Dominance, and the kickoff of Altseason.
— it’s going to be wild and fast! Just my personal opinion.
Stay Safe !
Happy Tr4Ding !

Bitcoin Dominance · Bitcoin Hits $1,000,000, ETH $200K Bitcoin Dominance is displaying the lowest reading in 8 months, since January 2025.
Bitcoin Dominance is in the worst condition possible in 4 full years. The Bitcoin Dominance Index chart predicts a major bullish cycle across Crypto; Bitcoin and the altcoins market.
Good evening my fellow Cryptocurrency trader, I hope you are having a wonderful day.
This week we have a bearish continuation on BTC.D, which also works as bearish confirmation which reinforces the bearish continuation. The altcoins are already going up, it has been happening for months.
The market has been rising for months; Bitcoin has been rising for years but this isn't all. Seeing BTC.D here we know the bigger portion of the current trend is still to unravel.
The rounded top, a bearish reversal signal, is complete and the neckline, the main pattern support, has been broken. Trading volume continues to be high and the bearish bias strong.
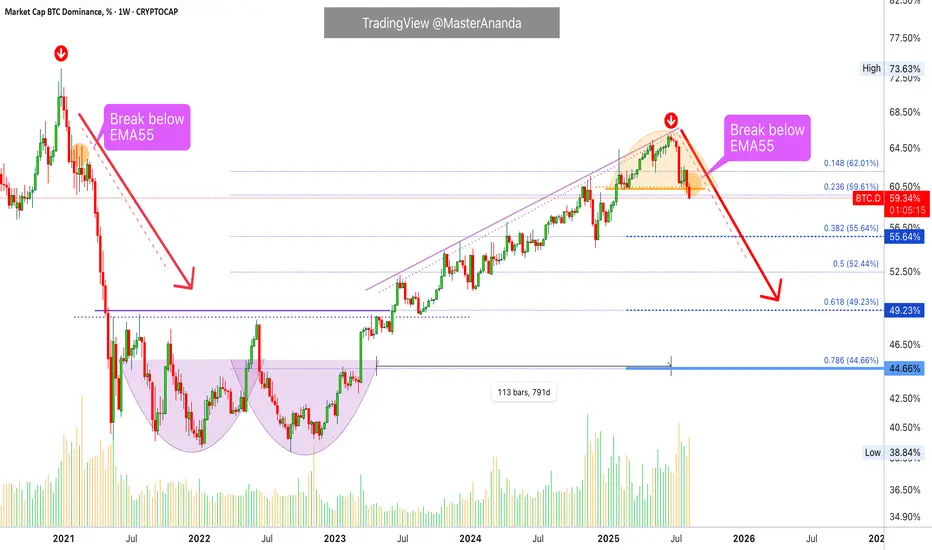
There is more. It is the first time Bitcoin Dominance breaks below EMA55 weekly since June 2022. Coming from a high point, this event happened January 2021, the start of the previous bull market. The same signal again now means the start of the current bull market.
It is already happening, it is already confirmed.
It was the same back in 2021. In January/February 2021 it was already happening and it was already confirmed that Crypto was having a major bull market. Bitcoin was already trading near its previous all-time high. Market conditions are the same. Bitcoin is about to grow 20%. While Bitcoin grows this much, the altcoins will grow between 300 and 600%. Then Bitcoin will take a pause and the altcoins will continue to grow. Ether is likely to go beyond 10K.
Crypto is going up. This is the best possible ever. Your life can forever change.
Take a minute to think.
Stop for a moment. Engage your mind and visualize... What type of results can you produce?
What would you do if you knew with a high level of certainty that Crypto is going up? How would you take advantage of this information? What type of actions are you taking now to maximize profits in this bullish wave?
It is not about being bearish or bullish, it is about adapting to what is happening. Crypto is going up; Are you in or are you out?
Namaste.

BTC-DOM- BTC dominance can't keep rising indefinitely.
-If we see a BTC dip, BTC dominance could climb to around 66% (71.8% Fibonacci), but in my opinion, that’s likely the maximum.
- If BTC surges too quickly and too high, altcoins will be suppressed, causing BTC dominance to potentially rise also to around 66%. However, once again, I believe that's would be the max.
- After any of both cases, altcoins will start to moon fly.
- 36-bar, 1096-day uptrend on the BTC dominance chart. That’s a significant duration from 2018 to 2021. The timespan from 2022 to 2025 could mirror the previous one.
- Take note also on the Bearish Divergence between the trend and the RSI. ( i will post weekly graphic also to show a more clear view ).
- An uptrend of this length indicates strong, sustained interest in BTC compared to altcoins. However, long-term trends like this are prone to exhaustion.
For now, just hold your alts and practice golden patience.
Happy Tr4Ding !

Bitcoin Dominance · Downtrend Continues (Bullish Bitcoin)The uptrend ended 27-July 2025 with the highest reading on BTC.D since January 2021. Back in January 2021 BTC.D was also bearish, dropping, and this bearish period in this index matched the strongest bullish action ever, the 2021 bull market.
Now, the bearish phase on BTC.D is intensifying. I am bullish on Bitcoin and the altcoins market.
Bitcoin Dominance being bearish does not mean Bitcoin is bearish, it means the altcoins are rising. When the altcoins are rising, Bitcoin is already high and will continue rising.
Two days closed green on BTC.D and today back red. A few days green, many days red. A new low each time, lower low. A lower high shows up each time... This is only the start.
A reading of 60% is nothing to be proud of if you are a bear. The truth is that Bitcoin Dominance being at 60% simply means that the altcoins market has still plenty of room for growth. For example, Ethereum can hit $11,111 and Bitcoin $200,000+. Targets need to be updated because we will have an extraordinary bull market.
» Many pairs have been growing for months, since April.
» Other pairs have been sideways for months, since April.
» While still others continued lower.
Soon, the entire market will move in one rhythm, one flow. And this flow is an up-wave. Rising prices for the long haul. The best scenario possible if you love Crypto. The strongest bullish cycle since 2021. Possibly the strongest ever.
Prepare for higher prices.
» Bitcoin Dominance (BTC.D) is going down.
» Bitcoin and the altcoins are going up.
Namaste.

BTCD Bear Market Confirmed · Altcoins Bull Market ConfirmedThis is a rising wedge pattern and it broke for the first time after 792 days. We are looking at Bitcoin Dominance (BTC.D) on the monthly timeframe, super long-term.
A classic long-term double-bottom in 2022 launched a massive uptrend. This uptrend developed within a perfect rising wedge. Last month BTC.D broke this pattern with a full red candle and the highest volume since November 2024.
To add some perspective, the highest volume months were last month (red) and November 2024 (red). The highest volume before these two only happened during the climax of the 2021 bull market, so you can have an idea how strong the volume is this time around.
Since Bitcoin Dominance has an inverse relation with the growth in prices of the Cryptocurrency an Altcoins market, when Bitcoin Dominance was ultra bearish and crashing down, 2021, the Cryptocurrency market was ultra bullish and moving up. Seeing this major long-term signal, the highest bearish volume month to break a 792 days long uptrend, reveals the start of another major crash on this index. The major crash on this index is the confirmation of the late 2025 altcoins bull market.
Bitcoin and the altcoins market will continue growing on all terms.
Thanks a lot for your continued support.
If you agree, leave a comment.
Namaste.

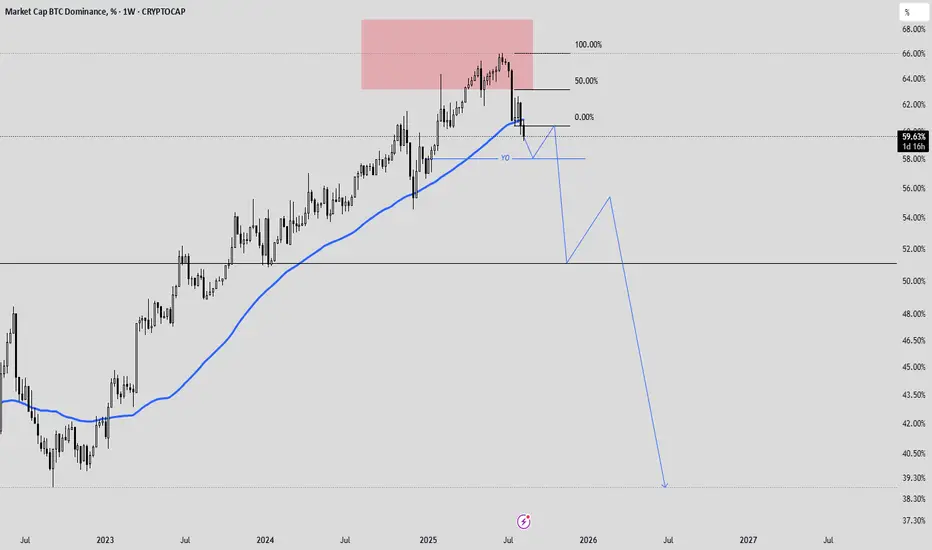
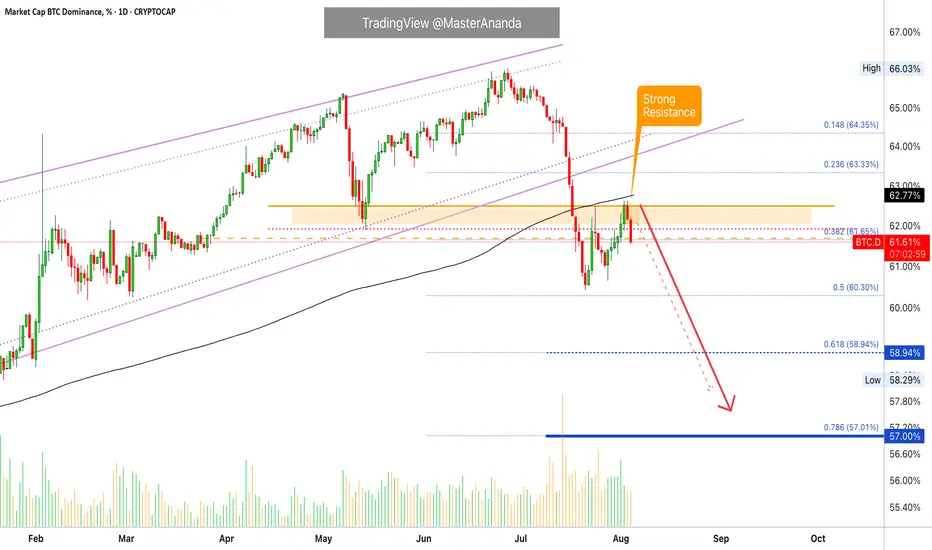
Bitcoin Dominance Update · Daily TimeframeThe rejection is happening right at "strong resistance." Notice that this is the same drawing from my previous update so it was drawn before the fact. Since resistance has been confirmed and the action is happening just as we expected, we can continue to follow our map as it is working.
The next logical move is a drop on Bitcoin Dominance Index (BTC.D), which translates into the resumption of the bullish wave for the altcoins, specially Ethereum and the big projects. It can also signal that Bitcoin will stop dropping and will either consolidate or move higher. This index reveals more than anything else the expected directions of the altcoins.
The retrace is over
The altcoins produced a retrace mainly between 21-July and the 2nd of August. In this period we saw many of the altcoins we are buying and holding move lower but only to produce a strong higher low. This higher low now will resolve into a very strong bullish wave, a bullish resumption.
Moving averages
Here MA200 daily has also been confirmed as resistance and trading below this indicator with a bearish bias, coming from a high point, gives out a very strong bearish signal. It means that long-term bearish action is now in place, the direction/trend. If the action was happening below MA200 but coming from a low point, this signal can have bullish connotations, right now it is bearish.
Bearish Bitcoin Dominance = Bullish Altcoins
The altcoins market will continue to grow, this is only the start. We are set to see growth long-term including now, next week, next month and until late 2025; maybe even for some portion of 2026, maybe even beyond.
Thank you for reading.
Namaste.
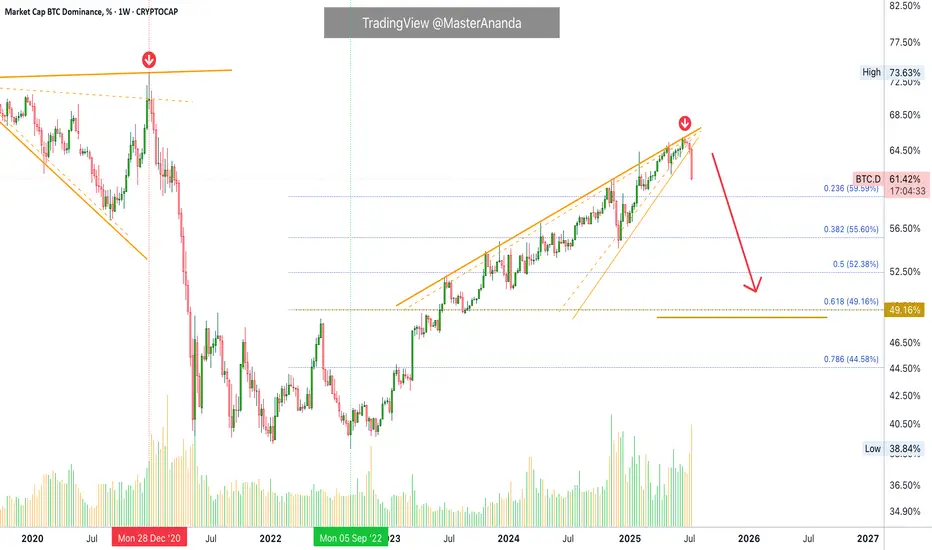
The End of the Altcoins Bull Market? BTC.D Turns Bullish?Bitcoin Dominance produced a bullish trend that was more than 1,000 days long. While this was a major development, the action never happened just straight up. There were always fluctuations.
Bitcoin Dominance broke out of a major rising wedge pattern. A pattern that lasted years in the making.
Recently, Bitcoin Dominance produced the highest bearish volume since 2021. A strong chart signal.
The major breakdown following the multiple years long uptrend signals the start of a change of trend. A downtrend. This downtrend is extremely bullish for the altcoins market because BTC.D only goes down when the altcoins are going up and doing so faster than Bitcoin.
What we are seeing now is an inverted correction, a pullback. Simply put, BTC.D already made a strong drop and it needs some relief. This relief is not the end. Bitcoin Dominance can move just a little higher to later resume its newly developing downtrend. Which means that the altcoins market bull market has not reached its end, it is only getting started.
Thank you for reading.
Namaste.

Bitcoin Dominance Weekly · Highest Bearish Volume in YearsThis week Bitcoin Dominance Index is producing the highest bearish volume session since February 2021. More than 4.5 years.
This week we have the strongest bearish action since June 2022. We can say that the altcoins market bull market is not only fully confirmed but already underway. We are already experiencing the best altcoin season since 2021 but it is still early, this is only the start.
Bitcoin Dominance is set to produce the strongest drop in many years and this only happens when the altcoins go ultra-bullish.
Bitcoin is moving sideways right now near resistance. As Bitcoin does this, the altcoins continue to move forward. This is classic bull market dynamics. When Bitcoin consolidates at a high price, the altcoins tend to explode. You can expect this pattern to continue to repeat for months to come. There is more good news though.
The fact that the altcoins are growing, perfect examples right now are Ethereum and Litecoin, is a bullish signal for Bitcoin.
It is not like the altcoins will grow and then Bitcoin will drop, no. Bitcoin consolidates and the altcoins grow, when Bitcoin stops consolidating it will move forward and hit a new major high, that is a price just around $134,000 and $136,000. When Bitcoin hits this price the altcoins continue to grow, back and forth. This is the most bullish the market has been since 2021. We will have to wait and see where this will all lead but new all-time highs are expected across all major projects and then some. Bitcoin is already in new all-time high territory but we need a new all-time high on Solana, Litecoin, Ethereum, Cardano, and so on. XRP is already at a new all-time high but it has much more to give.
If you visit @MasterAnanda, you will find up-to-date analyses for all these altcoins with new updated not conservative but realistic and good optimistic targets.
I will continue to share updates throughout the entire bull market. This is only the start. Get ready because the best is yet to come.
Namaste.
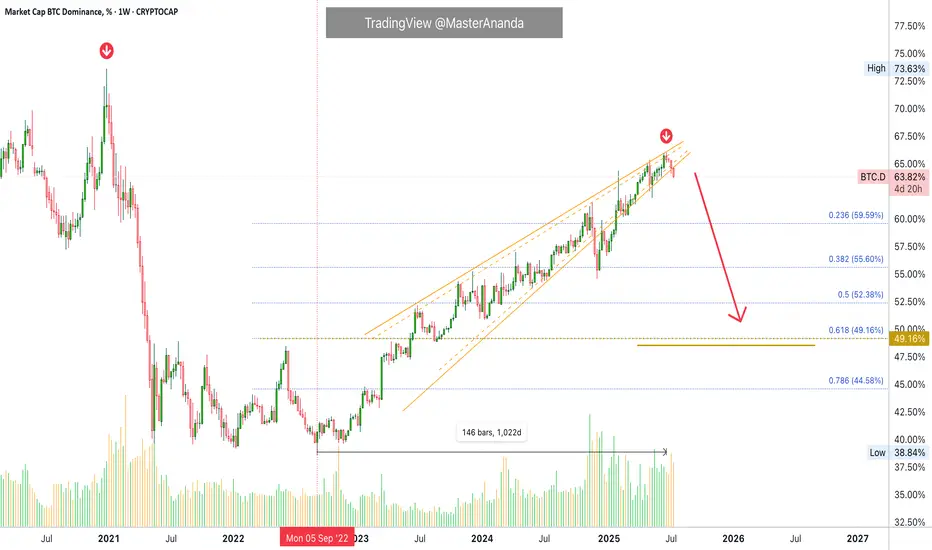
Bitcoin Dominance Long-Term · 1,000 Days Long Uptrend BreaksBitcoin Dominance Index (BTC.D) has been on an uptrend since September 2022, an uptrend more than 1,000 days long.
This uptrend produced a rising wedge pattern and this pattern is as bearish as it gets. During the entire time, from September 2022 until June 2025, BTC.D never ever produced more than 3 consecutive weeks red. Now, in July 2025, we are witnessing the fourth consecutive red week, a major bearish signal. The start of a new downtrend.
The last time BTC.D went bearish was December 2020. The index, as Bitcoin grew to new all-time highs, produced a drop from a high of 74% to a low of 39%. Reflecting strong demand for the altcoins and a very strong rising altcoins market. We are about to witness something similar, better or the same.
As Bitcoin Dominance moves down, the entire altcoins market will move up. Bitcoin will grow together with the altcoins. Everything—Crypto—will grow.
Namaste.
Bullish Altcoins · BTC.D Highest Bearish Volume Since Feb 2021The altcoins market is about to have its strongest and biggest bullish cycle since 2021, or possible ever. We are entering the strongest altcoins season in the history of the Cryptocurrency market.
Good morning my fellow Cryptocurrency trader, I hope you are having a wonderful day.
Bitcoin will continue growing, that's old news but let's start by getting this out of the way.
The altcoins are already waking up from major lows and all-time lows and what follows is something hard to comprehend. The hottest bull market ever for the altcoins. Bitcoin is already far ahead.
On the 14th of July BTC.D (Bitcoin Dominance Index) produced the highest volume bar in more than three years, since February 2021. This happened after a double-top and only after a drop was already confirmed. In this way this signal carries extra-strength. The 14th of July session ended up closing red.
We all know that Bitcoin Dominance Index goes down only when the altcoins move up. The fact that we have the highest volume in years on a daily basis signals the start of the altcoins market major bull-run. Sustained growth for months and months and months.
Get ready and be prepared. The confirmation is already in place.
The altcoins market is heating up. Crypto is going up.
The wait is over.
Namaste.
