Dominance & Altcoins- This graph is purely based on fibonacci law.
- 61.8% is the core of the system ( check rectangles in graph to get it )
- Most of long term traders not even look at the price.
- they just wait the good time to buy using Fibo.
- in 2016 BTC was almost 100%. Altcoins were inexistant. (less than 2% of the market with ETH)
- in 2021 BTC Dominance pushed to 75% (altseason followed the push)
- in 2024 we could see BTC dominance knocks 60% ish ( Altseason will follow )
- BTC is maturing.
- Cryptos are growing.
- Don't look too much at your altcoin wallets.
- Most of the time the story repeats itself.
- Respect the cycle, be patient and eat noodles!
Happy Tr4Ding !
Btcdomination

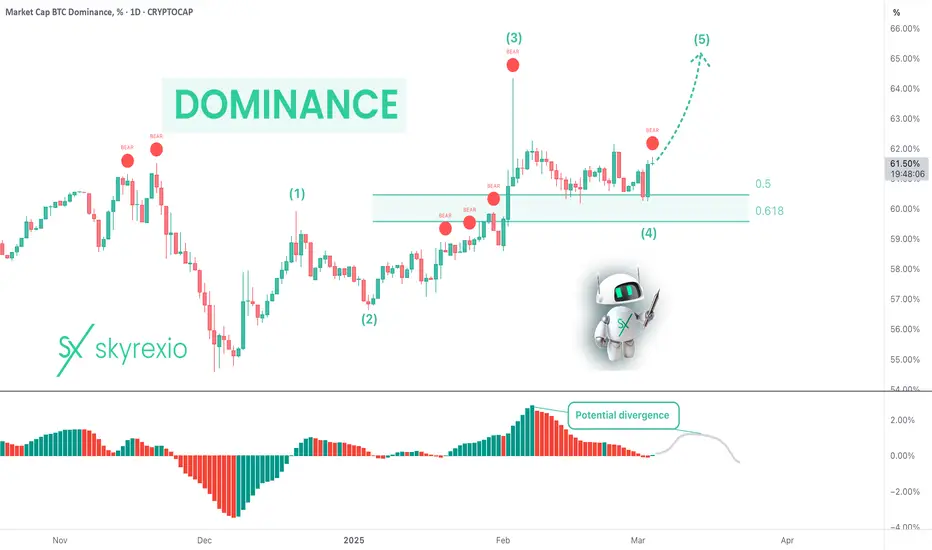
Bad News From Bitcoin Dominance: Pain AheadHello, Skyrexians!
I got sick for these 5 days that's why has not shared updates, but market was very boring so we didn't miss any significant move. CRYPTOCAP:BTC.D concerns me now because to end this trend we need to see any significant correction, but we didn't. On the 12h Awesome oscillator was not able to cross zero line and reversed to the upside, so our main change is that daily time frame measures the wave 3 inside the major impulse.
If we count waves inside this impulse price is approaching 1.61 Fibonacci level at 65.3% and trust me it's much better to see it's reaching before the drop. When this wave will be finished, wave 4 will happen. It can bounce significantly to 61%. This is strong target area and I am sure we will be there soon. Wave 5 can be extended, can be not. The max target is 71%! Sounds awful. The likely target at 66-67%, to make it more precise let's wait for wave 4 finish.
I plan to close in profit those part of trades which has been opened after Feb 3 dump on this potential bounce to have money to add on the last huge shakeout. People believe in altcoins too much, very unlikely to have altseason now. Ready for hate!
Best regards,
Ivan Skyrexio
___________________________________________________________
Please, boost this article and subscribe our page if you like analysis!

66% Is Actual Again For Bitcoin Dominance Hello, Skyrexians!
Sad news, pump on Sunday was a huge fake. If you remember our last CRYPTOCAP:BTC.D analysis we pointed out that if we will see 60% breakdown there is. great chance to see altseason right now. But Dominance started to grow again and finally we have no doubts that shakeout will happen.
Let's take a look at the daily time frame. Here we can see the clearest Elliott waves structure. Wave 3 has the max AO as usual, and wave 4 was a flat correction which found support at 0.5 Fibonacci. Now we can see that final wave 5 to the 66% target. Don't pay attention to the red dots on Bullish/Bearish Reversal Bar Indicator , they are not important inside the range and can be counted a signal only at the potential end of wave 5 in conjunction with the divergence.
Best regards,
Skyrexio Team
___________________________________________________________
Please, boost this article and subscribe our page if you like analysis!
BTC Dominance May Take Reaction From HereDOM can get reactions from here. It makes this pattern frequently after sharp rises. Be careful on alts.

The BTCDOM/USDT chart shows Bitcoin's dominance in the marketThe BTCDOM/USDT chart shows Bitcoin's dominance in the market, with current trading levels around 2,782.5. The price action has seen significant movements, including sharp rises and corrections, indicating a highly volatile market.
Key Points:
Support and Resistance Levels:
The price recently tested a high (HH) near 3,005.8 but faced strong resistance, leading to a correction.
Support has been identified around 2,754.8, where a recent long position was initiated. This level could serve as a crucial point for further upward movements.
Recent Trade Setups:
A long position was taken at 2,754.8, aiming for multiple take profit (TP) levels. The first TP level at 2,734.8 has been hit, and the price is now approaching the second TP at 2,714.9.
A short position was also entered near 2,763, but the price has since moved higher, possibly hitting the stop loss (SL) at 2,834.4.
Current Scenario:
The price is currently in a consolidation phase, moving between the key support and resistance levels. If it breaks above the recent high, it could retest the resistance around 2,834.4 and potentially move towards 3,000. Conversely, a break below 2,754.8 could lead to further declines, with potential targets around 2,688.4 and 2,635.3.
Potential Targets:
On the downside, the price might target the levels of 2,688.4 (TP3) and 2,635.3 (TP4) if the current support fails to hold.
On the upside, the key resistance levels to watch are at 2,834.4 and above, which the price needs to overcome to resume a bullish trend.
Conclusion:
BTCDOM/USDT is at a critical juncture, with the price testing key support and resistance levels. Traders should monitor the price action closely for a decisive breakout or breakdown, as this will determine the next significant move. Holding above 2,754.8 could indicate bullish potential, while a fall below this level might lead to a deeper correction.

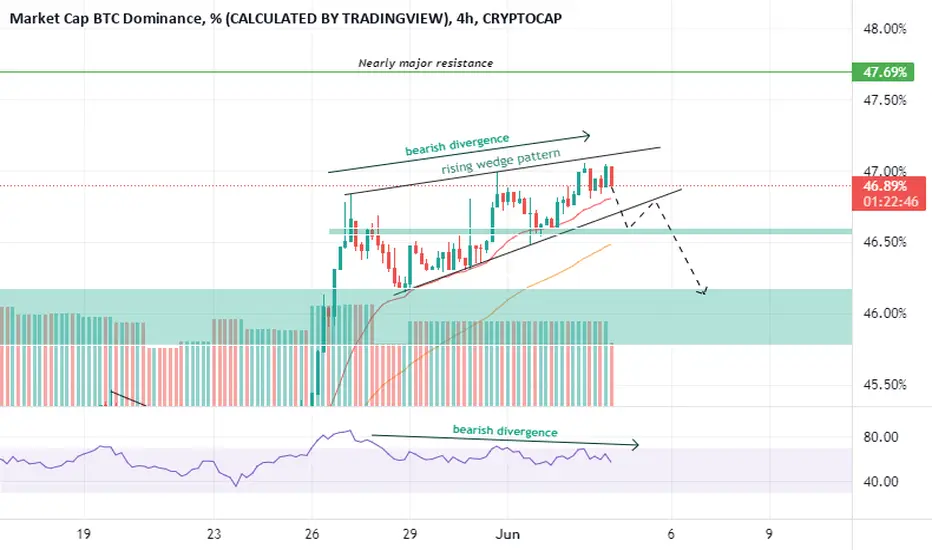
Chart Idea - BTC.DBTC.D is in rising wedge since Nov 2022. It's getting closer to the apex area. 82% rising wedges break towards downside. It seems that BTC will chop around in this after halving period, takes liquidity from both sides, and then will have a parabolic move by Aug-Sept 2024. Once BTC.D reaches the reversal zone range of 56-58%, it should break this rising wedge if not before. It's TP should be 45.7% which is a 0.618 fib level. ALTS should rally hard in the Q4 2024 if this TA works out.

Chart Idea - BTC.DBTC.D is in rising wedge since Nov 2022. It's getting closer to the apex area. 82% rising wedges break towards downside. It seems that BTC will chop around in this after halving period, takes liquidity from both sides, and then will have a parabolic move by Aug-Sept 2024. Once BTC.D reaches the reversal zone range of 56-58%, it should break this rising wedge if not before. It's TP should be 45.7% which is a 0.618 fib level. ALTS should rally hard in the Q4 2024 if this TA works out.

BTC.D Weekly resultsWeekly results show no signs of the trend continuing.
At two weeks, there are still 48% in the rejection area.
When the volume is viewed, there are no clear indications,
but it is clear that the 48% area is still quite powerful, and there is a chance that he will move back to the 47% area.

BITCOIN DOMINANCEBTCDOM/USDT just watch Bitcoin dominance starting to push down this plays a big role on Bitcoin where you can see a big Resistance zone on this chart if that resistance cant broke we are Bullish with BITCOIN for my opinion we can Take 22000$-23000$ if Dominance start to drop more down But if that resistance Broke We are Bearish and we comming first 19000$--16000$----14000$
ENJOY

BTC.Domination Analysis 9 June 2022#UPDATED
#BTC.D Analysis
still moving in ascending channel and rejected two times after hit nearly major resistance. but if we see from indicator BTC.D showing in overbought area which shoudly down first to retest indicator
center trendline be strong resistance any 4 times trying to breakout always rejected and back to support trendline
i this situation can't expect much . Alt season will happen if BTC.D breakdown And BTC sideways or up and instead if BTC.D up or pumping we will see ALT dominant dump

BTC.Domination Analysis 4 June 2022#BTC.D ANALYSIS
we can see BTC.D now make a rising wedge pattern And also any bearish divergence in RSI . Rising wedge valid if BTC.D breakdown . if this can happen, good for ALTS coin
#BTC.DOMINANCE 1HOUR UPDATE BY CRYPTOSANDERS !! Hello dear traders, we here new so we ask you to support our ideas with your LIKE and COMMENT, also be free to ask any question in the comments, and we will try to answer for all, thank you, guys.
Hello, dear traders welcome you to this BTC.DOMINANCE 1hr chart analysis.
CHART ANALYSIS:-As we can see in the chart above BTC.D was trading inside the parallel channel pattern and broke above the 45% level.
Now, BTC.D is retesting the upper trend line, and here BTC.D can put towards the 49% level which is 8.5% from the retesting level.
It indicates that BTC can also pump at any time and we can witness short-term bull rallies in upcoming hours.
Thanks for your time, we hope our work is good for you, and you are satisfied, we wish you a good day and big profits.
THANK YOU.

BTC DOMINANCE UPDATE!!Hi guys, This is CryptoMojo, One of the most active trading view authors and fastest-growing communities.
Do consider following me for the latest updates and Long /Short calls on almost every exchange.
I post short mid and long-term trade setups too.
Let’s get to the chart!
I have tried my best to bring the best possible outcome in this chart, Do not consider it as FINANCIAL ADVICE.
#BTC DOMINANCE short and simple UPDATE
USDTDOMINANCE is forming this bearish flag pattern currently it is at the upper resistance of this accusation channel we expect a rejection from there up to lower support or then if it breaks the lower support with confirmation then we can expect a drop up to 3.62.
Here we may Bounce from here up to the upper resistance of this rising which pattern then we can accept rejection from there.
Let's see how the daily candle closes
This chart is likely to help you in making better trade decisions if it did consider upvoting this chart.
Would also love to know your charts and views in the comment section.
Thank you

BTC DOMINANCE SHORTER TF UPDATE!!Hi guys, This is CryptoMojo, One of the most active trading view authors and fastest-growing communities.
Do consider following me for the latest updates and Long /Short calls on almost every exchange.
I post short mid and long-term trade setups too.
Let’s get to the chart!
I have tried my best to bring the best possible outcome in this chart, Do not consider it as FINANCIAL ADVICE.
BTC DOMINANCE UPDATE
CURRENTLY, BTC DOMINANCE IS MAKING THIS BEARISH FLAG PATTERN BUT IT IS NOT CONFIRMED YET IF IT BREAK THIS LOWER SUPPORT WITH CONFIRMATION THEN WE CAN EXPECT A DROP UP TO4035% LEVEL.
Let's see how the daily candle closes.
This chart is likely to help you in making better trade decisions if it did consider upvoting this chart.
Would also love to know your charts and views in the comment section.
Thank you

#BTCDOMINANCE 3DAY UPDATE BY CRYPTOSANDERS Welcome to this quick BTCDOMINANCE analysis.
I have tried my best to bring the best possible outcome in this chart.
Hello members, welcome to our BTC.D 3-day update
As we can see here that BTC.D is on a support of yellow MA, inside a falling wedge pattern.
If BTC.D rejects from yellow MA then that will be the confirmation that BTC.D can come down to 39% mark.
If it moves as we expect then we will see an uptrend in ALTCOINS until BTC.D changes its movement direction.
Sorry for my English it is not my native language.
Do hit the like button if you like it and share your charts in the comments section.
THANK YOU...

BTC DOMINANCE 4 HOURS UPDATE Hi guys, This is CryptoMojo, One of the most active trading view authors and fastest-growing communities.
Do consider following me for the latest updates and Long /Short calls on almost every exchange.
I post short mid and long-term trade setups too.
Let’s get to the chart!
I have tried my best to bring the best possible outcome in this chart, Do not consider it as an
Bitcoin dominance is breaking down from the ascending triangle in the 4 hours frame and looks bearish . Also, it breaks below the 21D ma which is also a good sign for Altcoins.
The Green dotted line shown in the charts indicates the support level . I'm expecting the Bitcoin dominance to reach the 40 levels again and we might see a good Altcoin season in the 2nd quarter of 2022.
IMO it's best to accumulate some good Altcoins, especially in BTC pair on spot. Soon I'll share some good Altcoins in BTC pair.
This chart is likely to help you in making better trade decisions, if it did do consider upvoting this chart.
Would also love to know your charts and views in the comment section.
Thank you

#BTC.DOMINANCE 4HOUR UPDATE BY CRYPTOSANDERS Hello members, welcome to the BTCDOMINANC Quick update by CRYPTOSANDERS.
I have tried my best to bring the best possible outcome in this chart.
In the current scenario, BTC.D broke the Chanel downside and retested the lower trend line.
We are expecting here that we will see some downfall which means that BTC will form some green candle because as we know that BTC and BTC.D both work inversely proportional.
Sorry for my English it is not my native language.
Do hit the like button if you like it and share your charts in the comments section.
THANK YOU...

#BTC Dominance ALT SEASON in Q2 Possible? Here's Why!Welcome to this extensive analysis of Bitcoin Dominance
If you are reading my updates for the first time, make sure you follow me if you want the most complex charts
Explained in the most simplified manner.
I also post margin and futures trade setups.
Now, let’s get to the chart.
BTC Dominance bounced and pumped almost 4% since the last chart.
Expected this growth and asked you not to go long on BTC pairs.
Hope you listened.
The charts show potential for more growth in BTC Dominance.
Once we hit the legacy trendline resistance, a rejection will cause rallies across the market in BTC pair altcoins.
This is why I expect a nice second quarter, especially for Altcoins.
CONCLUSION:- Bitcoin Dominance should rise to almost 45.50% We will see later whether it breaks the long-term resistance or gets rejected from there. It's early to come to a solid conclusion. Close above that level means BTC will hit new ATH and Alts go cheaper.
Invalidation:- A close below 50D MA will invalidate this chart.
What do you think of this chart?
Do share your views in the comment section and do not forget to hit the like button.
Thank you
#PEACE

btc dominance analysesbtc d will go down to the strong area in the chart, after that it will rise to the top with the entry of new liquidity to it and it will achieve a strong rise for bitcoin and will seize 45% as a first target and 48% as a second target

BTC Market Cap Domination Domination is near big support, there is probability that the domination will rise from that support around 39%. If this will happen and the price of btc despite that will go down, it means that alts will bleed a lot, 2x more than btc. If the price will rise along with the domination it simply means that the money will be going mostly to BTC and alts will rise slowly. The other scenario is that we will break that support and domination will fall to around 35% in this case we may have similiar situation to January 2018 when the huge altseason started.
We can also see that there is divergence on 1D timeframe on MACD which may suggest that we won't break this support and the dominance of btc will start to rise.
Be careful, always do your own research.
It is not financial advice, I'm just sharing my personal view.

Gear up for another Altszn at 50%BTC.D has performed its first bounce off the 2.618 Fibonacci line
This bounce will likely continue to around ~50 - ~53%
Then we prepare for another altseason as it hits a major trendline and gets rejected
Repeating double bottom pattern

Btc Dominance ! just a reminder of btc dominance
i think another major bullrun is about to happen in matter of days

Bitcoin Dominance ChartP.S: This is NOT investment advice. This chart is meant for learning purposes only and is a part of my personal journal. Invest your capital at your own risk.
