Bitcoin Update. Bitcoin Update.
Bitcoin is reacting to a strong supply zone, resulting in a short-term rejection. Despite this, the price remains above the ascending support trendline, maintaining the bullish structure.
A bounce off the trendline could initiate a new upward move. However, a clean breakout with confirmation from the current pattern would be the key signal for a strong continuation of the bullish trend in the market.
⚠️ Until then, expect consolidation with volatility—patience and confirmation are crucial.
Btceth

#BTC/USDT - Where the 2026 Bottom Might Actually Form ( Short) #BTC
The price is moving in a descending channel on the 1-hour timeframe. It has reached the upper limit and is heading towards breaking it. A retest of the upper limit is expected.
We have an upward trend on the RSI indicator, which has reached near the upper limit. A downward reversal is expected.
There is a key support zone in green at 944650. The price has bounced from this zone multiple times and is expected to bounce again.
We have a trend of consolidation above the 100-period moving average, as we are moving close to it. This supports a downward move towards touching this level.
Entry price: 93500
First target: 93006
Second target: 92509
Third target: 91866
Stop loss: Above the support zone in green.
Don't forget a simple thing: capital management.
For inquiries, please leave a comment.
Thank you.

BTC/USDT – 4H Chart UpdateBTC/USDT – 4H Chart Update
Bitcoin is trading inside a rising wedge / ascending structure and has just made a strong bullish push from the lower trendline.
Price holding above short-term MAs
Higher lows structure intact
Bullish momentum is building near the resistance
Current Price: ~92.5K
Immediate Resistance: 94.5K – 95K
Major Resistance: 96.8K
Support Zone: 89K – 90K
Trendline Support: ~88K
Above 90K: Bullish continuation possible
Break & hold above 95K: Momentum could accelerate toward 96.8K+
Rejection near resistance: Expect a healthy pullback to trendline support
A 4H close below 88K would weaken the bullish structure.
Bullish while above key support
Trade with discipline & proper risk management

BTCUSDT – 4H | Chart Update. BTCUSDT – 4H | Chart Update.
BTC is compressing inside a symmetrical triangle (lower highs + higher lows). This is a classic volatility squeeze before expansion.
Strong buyer reaction seen multiple times near 85.8k – 84.6k (green circles)
Rising trendline support is still respected.
93.5k – 94k remains a heavy rejection area
Price needs a clean breakout to unlock upside
Price is trying to reclaim short-term MA
Sustained hold above trendline + MA = bullish confirmation
Above 89–90k → breakout attempt toward 93k+
Below 85.8k → deeper pullback toward 82.2k
This is a decision zone. Structure favors upside only after confirmation.
Small update • Big move loading
DYOR | NFA

BTCUSDT –Chart Analysis (4H)BTCUSDT –Chart Analysis (4H)
BTC is coiling inside a tightening range — lower highs vs higher lows. This type of compression usually leads to a sharp directional move.
Price is respecting the rising base around 85k
Every dip into the green zones shows buyer absorption
Sellers are active below 89k, keeping pressure from above
Support: 85,800 – 84,600
Major Support: 82,200
Resistance: 88,800 – 89,500
Supply Zone: 93,500 – 94,000
When price holds support during Extreme Fear, it often means weak hands are exiting while stronger players accumulate quietly.
DYOR | NFA

BTC/USDT – 4H Chart Update. BTC/USDT – 4H Chart Update.
Price swept liquidity near 84.5K and bounced → classic fake breakdown.
Still moving inside a descending channel.
84.5K = key support (holding keeps bounce valid).
82.2K = invalidation level if support fails.
Resistance: 88K → 92K–94K supply zone.
Neutral to slightly bullish as long as 84.5K holds.
Reclaim above 88K = upside continuation possible.
Below 84.5K = deeper pullback risk.
Not financial advice. Manage risk.

BTCUSDT Trade Plan (December 08, 2025)BTC Trade Plan (December 08, 2025)
(D1 Bearish / H4 Sell Rallies → Compression / H1 Neutral / M15 Chop)
⬛️ 1. Higher Timeframe Context (D1 and H4)
• D1 bias: bearish (descending channel post-ATH)
• D1 range (approx): 84,000 – 126,000 (current lower third)
• Key D1 zones:
• Supply: 100–105k (broken)
• Demand: 88–90k channel low
• H4 bias: sell rallies turning compression (ascending triangle forming)
• H4 zones of interest:
• H4 Sell Zone 1: – recent rejection + supply cluster
• H4 Buy Zone 1: – weekend low + trendline
Active setups counter-trend long on dip (whale accumulation support), trend-aligned short only on clear rejection.
⬛️ 2. Preferred Setups by Horizon
🔳 2.1 Swing Setup (D1/H4)
Counter-trend long the channel low / whale accumulation zone. Time horizon: multi-day to weeks.
🔲 2.2 Intraday Setup (H1 focus)
Buy dips to 89.5-90k or breakout above 92k. Time horizon: intraday to overnight.
▫️ 2.3 Scalp Setup (M15 focus)
Scalp range 90-92k or absorption plays — higher risk in chop.
▪️ 2.4 Arbitrage/Pairs: BTC dominance rising → BTC outperforming alts short-term.
🟩 3.1 Long Setup (Trend-Aligned with On-Chain / Swing-Intraday)
• Execution timeframe: H4/H1
• Trigger timeframe: M15
• Entry zone:
• Pattern tags: Trigger conditions:
• Successful defense 88-90k zone + CVD higher low
• H1/H4 BOS up on volume
• Whale accumulation continuation
🟥 3.2 Short Setup (Counter-Trend / Scalp Only)
• Execution timeframe: H1
• Trigger timeframe: M15
• Entry zone:
• Pattern tags: Trigger conditions:
• Clear rejection with delta divergence high
• Failure to break 94k pre-FOMC
🔴 4. Stops (Invalidation Levels)
Long setups: 87,500 (channel break = bear confirmation)
Short setups: 94,500 (breakout = squeeze)
🟢 5. Targets
Long (swing/intraday):
• TP1: 92,000 (VWAP/H1)
• TP2: 94,000-95,000 (supply test/H4)
• TP3: 100,000+ (HVN/D1 optional)
Short (scalp):
• TP1: 90,000
• TP2: 88,500
⬛️ 6. Position Sizing
• Baseline trend-aligned long (on-chain supported): 1.0%
• Counter-trend short: 0.4%
• Adjustments: +20% (whale buying + clean lev + Fed tailwind) → Effective: longs 1.2% risk, shorts 0.3% max
⬛️ 7. Risk Flags
• FOMC Wednesday → vol expansion risk
• Thin liquidity mid-week
• Residual weekend trauma → fake moves possible
• Macro correlation re-assertion if equities dump
⬛️ 8. Flip Conditions
Bull → bear flip: clean close below 88k with volume + funding negative
Bear → bull flip: H4 close >94.5k + CVD reset + whale continuation
⬛️ 9. Alternative Scenario
Reject hard at 92-94k → descending triangle breakdown → fast move to 84-87k LVN void (bear trap completion, high risk short only with tight stop).
⬛️ 10. Model Self-Critique
• Assumptions: whale accumulation continues, Fed delivers dovish cut, no macro shock
• Vulnerabilities: sudden risk-off equities dump, whale distribution resumption, FOMC hawkish surprise
• Behavioural: do not chase breakouts pre-FOMC, do not average into losing shorts against whales
⬛️ 11. Uncertainty and Constraints
Uncertainty: medium → require flow + pattern confirmation, no high lev, prefer size on confirmed absorption only.

#BTC/USDT is currently strongly bullish#BTC
The price is moving in a descending channel on the 1-hour timeframe. It has reached the lower boundary and is heading towards a breakout, with a retest of the upper boundary expected.
We are seeing a bearish trend in the Relative Strength Index (RSI), which has reached near the lower boundary, and an upward bounce is expected.
There is a key support zone in green at 88200, and the price has bounced from this level several times. Another bounce is expected.
We are seeing a trend towards stabilizing above the 100-period moving average, which we are approaching, supporting the upward trend.
Entry Price: 88900
First Target: 90000
Second Target: 91123
Third Target: 92300
Remember a simple principle: Money Management.
Place your stop-loss order below the green support zone.
For any questions, please leave a comment.
Thank you.

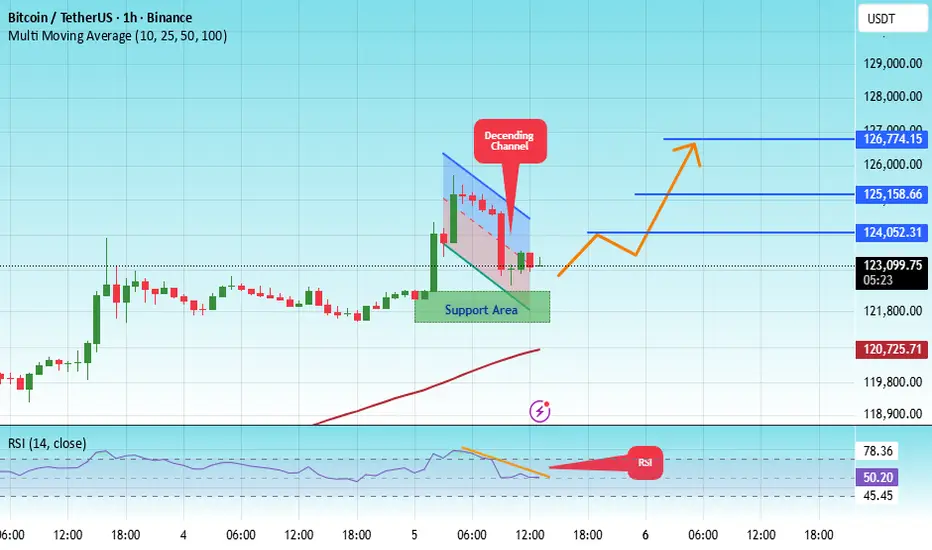
#BTC/USDT Let Bitcoin make a new ATH#BTC
The price is moving within a descending channel on the 1-hour frame, adhering well to it, and is heading for a strong breakout and retest.
We have a bearish trend on the RSI indicator that is about to be broken and retested, which supports the upward move.
There is a major support area in green at 121900, which represents a strong support point.
We are heading for consolidation above the 100 moving average.
Entry price: 123300.
First target: 124050.
Second target: 125160.
Third target: 126774.
Don't forget a simple matter: capital management.
When you reach the first target, save some money and then change your stop-loss order to an entry order.
For inquiries, please leave a comment.
Thank you.
#BTC/USDT Analysis — Pullback Before Bullish Continuation#BTC
The price is moving within a descending channel on the 4-hour frame, adhering well to it, and is heading for a strong breakout and retest.
We have a bearish trend on the RSI indicator that is about to be broken and retested, which supports the upward breakout.
There is a major support area in green at 111600, which represents a strong support point.
We are heading for consolidation above the 100 moving average.
Entry price: 111750.
First target: 112684.
Second target: 113672.
Third target: 115048.
Don't forget a simple matter: capital management.
When you reach the first target, save some money and then change your stop-loss order to an entry order.
For inquiries, please leave a comment.
Thank you.

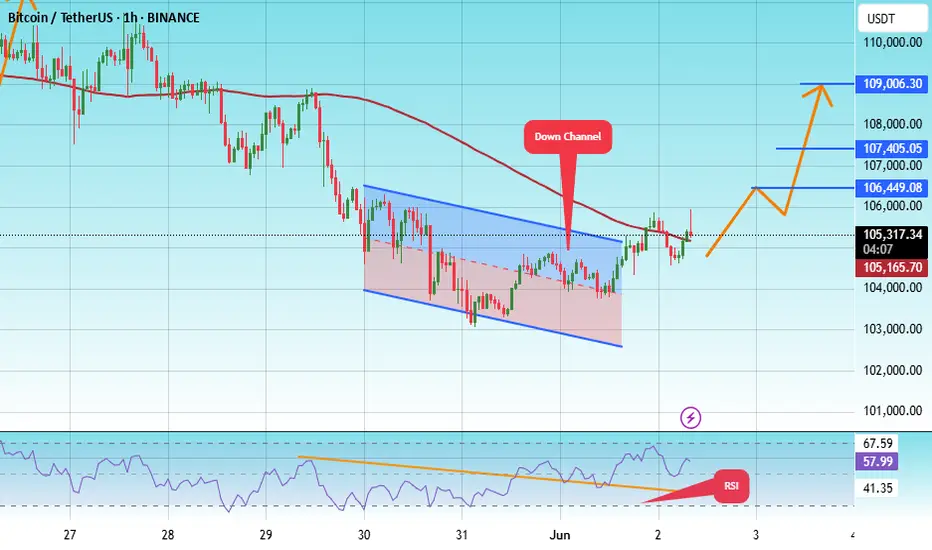
#BTC/USDT Bullish Divergence on 1H, Low Risk Trade#BTC
The price is moving within a descending channel on the 1-hour frame, adhering well to it, and is heading for a strong breakout and retest.
We have a bearish trend on the RSI indicator that is about to be broken and retested, which supports the upward breakout.
There is a major support area in green at 109800, which represents a strong support point.
For inquiries, please leave a comment.
We are in a consolidation trend above the 100 Moving Average.
Entry price: 111164
First target: 111727
Second target: 112450
Third target: 113470
Don't forget a simple matter: capital management.
When you reach the first target, save some money and then change your stop-loss order to an entry order.
For inquiries, please leave a comment.
Thank you.

#BTC/USDT Bullish Divergence on 1H, Low Risk Trade#BTC
The price is moving within a descending channel on the 1-hour frame, adhering well to it, and is poised to break it strongly upwards and retest it.
We have a bearish trend on the RSI indicator that is about to be broken and retested, supporting the upside.
There is a major support area in green at 108062, which represents a strong basis for the upside.
For inquiries, please leave a comment.
We are in a consolidation trend above the 100 Moving Average.
Entry price: 108450
First target: 108959
Second target: 109541
Third target: 110325
Don't forget a simple matter: capital management.
When you reach the first target, save some money and then change your stop-loss order to an entry order.
For inquiries, please leave a comment.
Thank you.

Will Ethereum and Altcoins Continue to Grow?Hello friends
You see the Bitcoin to Ethereum chart.
You may be wondering what caused Ethereum to grow. I should tell you that this chart shows us what happened.
The price is in a downtrend, which indicates a money movement (from Bitcoin to Ethereum).
When you see that after 3 hits to support, the price has managed to break the support and the price has fallen and formed a downward channel, which could indicate that Ethereum's growth is continuing.
So now we have identified the support areas for you using Fibonacci, based on the price range that has formed.
The price is now at an important support area, as you can see, we had a bullish reaction when we hit the support area, but the price reversed due to the strength of the downtrend...
Now, if the support area breaks, the price can move lower to the specified targets.
Keep in mind that if the price grows, the upper support areas that were broken now become resistance and the price must be able to break them for our trend to be bullish, but as long as the price is down, the upward trend of Ethereum will continue and the upward trend of Ethereum will also make the altcoins bullish...
*Trade safely with us*

#BTC/USDT Breakout needed #BTC
The price is moving within an ascending channel on the 1-hour frame, adhering well to it, and is on track to break it strongly upwards and retest it.
We have support from the lower boundary of the ascending channel, at 114200.
We have a downtrend on the RSI indicator that is about to break and retest, supporting the upside.
There is a major support area in green at 114000, which represents a strong basis for the upside.
Don't forget a simple thing: ease and capital.
When you reach the first target, save some money and then change your stop-loss order to an entry order.
For inquiries, please leave a comment.
We have a trend to hold above the 100 Moving Average.
Entry price: 114700.
First target: 115106.
Second target: 115537.
Third target: 116130.
Don't forget a simple thing: ease and capital.
When you reach the first target, save some money and then change your stop-loss order to an entry order.
For inquiries, please leave a comment.
Thank you.

Lets look at ETH V Bitcoin for a moment, before you jump in
Ever since Nov 2021, ETH has Lost Value compared to Bitcoin, as we can see on this ETH BTC chart.
Even while Bitcoin entered a Deep Bear market, ETH lost More....
And now, as we see ETH make a strong move, we have people screaming, "ETH to 10K"
And given how ETH is backed by almost everything American, as America wants ETH as its own Crypto.
Nut lets look here at simple idea.
ETH is up agains Stiff long Term resistance right now.
If we look at the daily chart.
We can already see how PA has been bumped down...an is trying again, even with a daily MACD turning Bearish
The weekly MACD has room to go higher and so I do expect PA to break over resistance and to nreak higher should sentiment remain strong.
As ever, this relies HEAVILY on BTC Dominance and Bitcoin PA to play along.
For me, I am not touching it, even if I can make money on it..
Principles

BTCETH parabolic run pointing towards 100:1Historically, during bull markets, Ethereum frequently surpassed Bitcoin at various moments.
However, this time around, that trend has not materialised, leading to a decline in investor confidence.
With capital exiting the ETH market, sentiment has soured, and critical indicators are revealing significant losses.
Unless a robust bullish turnaround occurs, Ethereum's struggle may persist, as the market currently favors Bitcoin as the more secure option.
However once this parabola breaks, we could see a strong snap back reaction in favour of the more riskier #ALTS, #DEFI and #MEMES as #ETH is still the home for stablecoin issuance and still the most trusted secure smart contract blockchain available.

#BTC/USDT#BTC
The price is moving within a descending channel on the 1-hour frame, adhering well to it, and is heading for a strong breakout and retest.
We are experiencing a rebound from the lower boundary of the descending channel, which is support at 103141.
We are experiencing a downtrend on the RSI indicator, which is about to break and retest, supporting the upward trend.
We are looking for stability above the 100 moving average.
Entry price: 105268
First target: 106500
Second target: 107405
Third target: 109006
BTC/USDT 1DAY CHART UPDATE !!BTC/USDT Chart Analysis
The price has broken above a key resistance area (~$104,000–$105,000) and is now retesting it as support.
The 50-day (red) and 200-day (green) moving averages slope upward, indicating bullish momentum.
Price activity consolidates just above the key resistance-to-support area, indicating accumulation ahead of a potential breakout.
If the price sustains above $104,000, we could see continuation towards $120,000–$125,000.
A break below $104,000 could see the price retest lower support areas near $100,000 or even $97,000–$98,000.
Conclusion:
Bullish bias above $104,000.
If support fails, a bearish move is possible, but momentum is in the bulls’ favor right now.
Stay tuned for updates and key levels to watch!
Thanks for your support!
DYOR. NFA

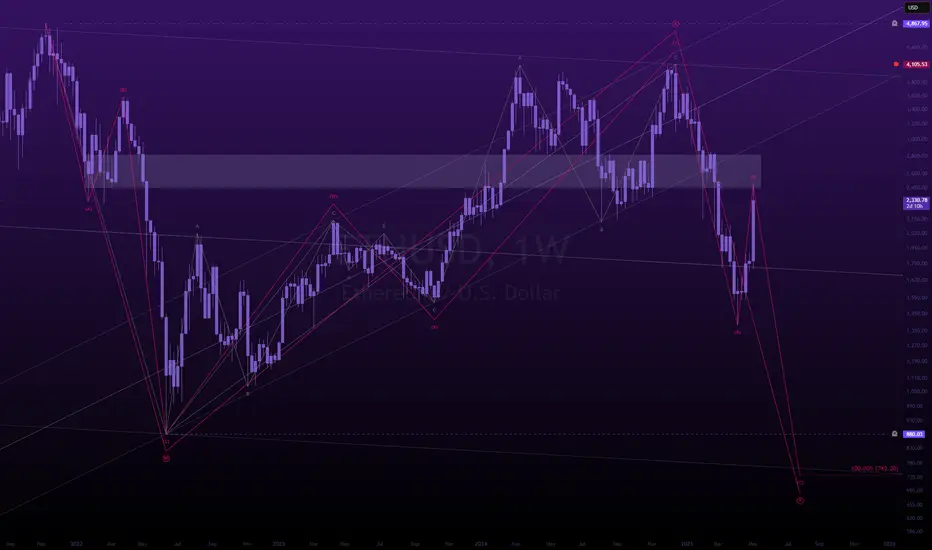
one last dancegm.
you finally woke up and ethereum was soaring.
you saw the bounce. the reclaim. the headlines.
you convinced yourself the bottom was in.
you drew trendlines, watched influencers say “we’re so back.”
you wanted to believe.
and that’s exactly what wave B needed.
because this wasn't a breakout.
it’s a reset.
a psychological rinse,
engineered to bait late longs and build fuel for the final l i q u i d a t i o n.
this is the macro (W)-(X)-(Y).
not hopium, not dreams structure.
wave A brought devastation.
wave B brought complacency
wave C brings the execution.
make no mistake:
we’re not going up,
we’re being set up.
the chart says $742.
you call it impossible.
but the market doesn’t care what you believe.
the market only exists to find the maximum pain,
your maximum pain.
eth to $700 is not a prediction.
it’s a scheduled event.
and you’re RSVP’d unless you wake up.
wave C of wave (Y) is coming.
and it doesn’t care how bullish you feel.
---
#BTC/USDT#BTC
The price is moving within a descending channel on the 1-hour frame, adhering well to it, and is on its way to breaking it strongly upwards and retesting it.
We are experiencing a rebound from the lower boundary of the descending channel, which is support at 74,300
We are experiencing a downtrend on the RSI indicator, which is about to break and retest, supporting the upward trend.
We are looking for stability above the 100 Moving Average.
Entry price: 79,056
First target: 80,422
Second target: 81,950
Third target: 84,000

Ethereum Failing against BITCION ? Here is a valid reason why.
In a world being thrown upside down and sideways and Markets Rising and falling and Rising again on a few words and actions, there is one Shining Light in the world of Crypto
Ethereum - And its constant DROP when compared to BITCOIN
It is possibly the Only coin in the top 10 that has failed to rally at least once, to any significant degree since 2023, when nearly everything else took off.
It currently sits at the same price it was in May 2020 !
It reached its ATH in Nov 2021 and ever since then, has fallen in what is becoming a parabolic reverse curve;
All this despite coins like BASE, Coinbases Crypto, being based on that ETH Layer.
This is pretty well ALL down to the adoption of BITCOIN by corporate ventures, keeping the Bitcoin Dominance high.
I mentioned in a post back in 2023 ( maybe here but certainly on X) how BTC could be used in the "Financial Wars" to come, as a means to weaken and scupper ALT coins.
They tried to Destroy crypto, they failed and so, by allowing Bitcoin ETF's etc, BTC dominance remains High and ALTS Fail
And that is EXACTLY what we have seen so far. As Corporations continue to Buy Bitcoin, Dominance remains high..... It isd as simple as that.
And this ETH BTC chart shows that very clearly.
The REAL question is why the ETH ETF's failed so much.
Maybe that is because MANY people realised the "energy behind Ethereum" - The American crypto , Protected by Gensler and predecessors. The Not really Descentralised structure and power if you hoold a LOT, something not many independants can do

ETH is lagging behing / Still holding BTC intead of ETH.Since 2022 Etherum has underperform BTC. We just broke a major trendline on the weekly.
We can expect more downside to more support level
At this stage, it is still better to hold BTC than ETH

BTC/USDT chart analysis !
BTC is retesting the breakout point near the descending trendline (around $98,000-$100,000).
If buyers step in, this retest could act as a launchpad for a potential bounce.
The green zone ($92,000-$96,000) remains a crucial area of demand, offering strong support in case of a deeper retracement.
The 50-day SMA (red line) is moving upwards, currently around $98,000. It acts as a dynamic support level.
BTC is slightly above the 21-day SMA (black line), which suggests short-term support.
Despite the pullback, the overall structure suggests a bullish continuation.
The orange projection shows a potential consolidation followed by a move towards higher targets near $112,000-$116,000.
If you found this analysis helpful, hit the Like button and share your thoughts or questions in the comments below. Your feedback matters!
Thanks for your support!
DYOR. NFA
