BTC : REVERSAL or FAKEOUT ?? Hello Bitcoin Watchers 📈
BTC is looking promising with a price recovery towards the upside, currently trading just over $90k.
📢But let's not forget, a higher high was observed here as well.
A further -30% drop followed after this pullback to the upside:
If we have to follow a similar trend, over the next two months we could end up at around $65K:
Conclusion - I'm leaning towards more drop to follow after a period of sideways trading here. We could see this zone hold for two or three weeks up until after Xmas, at which point longs could be liquidated again if the optimism goes too high.
If you've been following my previous BTC updates, you would have seen that it's not uncommon for the price to recover to the basis of the Bollinger bands, or mid-level moving average. And the only way that can be considered a reversal, is if the WEEKLY starts closing above the 50day moving average, which we are no where near close to seeing.
BINANCE:BTCUSDT
BTCEUR

$BTC beautiful range to play i will looking for short!lower time frame rejection call lead us for more downside ! keep eye on it..

#BTCEUR #1D (Binance) Bull-flag breakout and retestBitcoin looks very good for bullish continuation after regaining 50MA support on daily, against the Euro.
⚡️⚡️ #BTC/EUR ⚡️⚡️
Exchanges: Binance
Signal Type: Regular (Long)
Amount: 12.0%
Entry Targets:
1) 93017.86
Take-Profit Targets:
1) 108422.28
Stop Targets:
1) 85296.36
Published By: @Zblaba
CRYPTOCAP:BTC BINANCE:BTCEUR #Bitcoin #PoW bitcoin.org
Risk/Reward= 1:2.0
Expected Profit= +16.6%
Possible Loss= -8.3%
Estimated Gaintime= 1-2 months

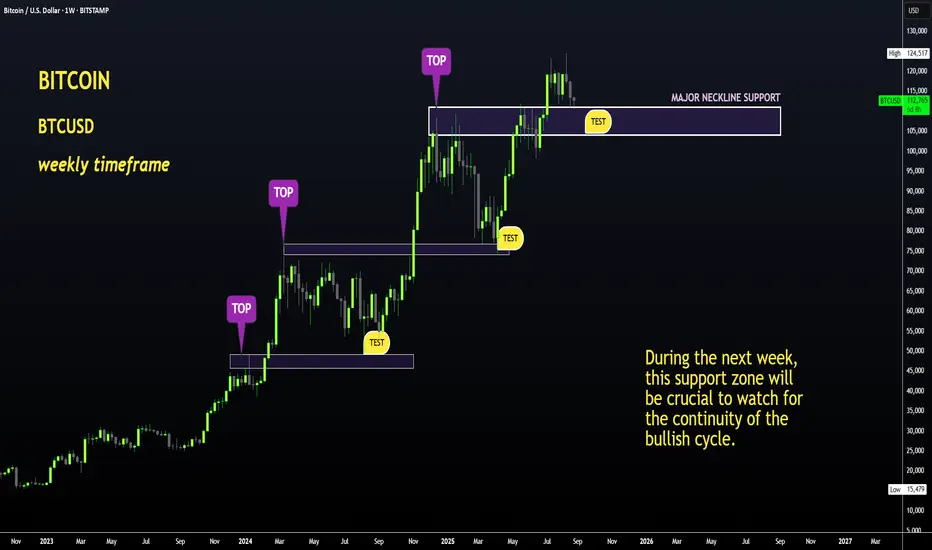
BTC in Trouble if THIS Support Breaks !Hello BTC Watchers
The previous update on Bitcoin was on how we may expect the altcoin market to play out during the next few weeks. (Find it here):
Now, if we look at Bitcoin in the weekly timeframe, the price is trading right on top of a KEY support zone. Here, we can either see a dip - marking the start of the bearish cycle OR the price can maintain this level and perhaps even push towards a higher high. This will all depend on the SUPPORT ZONE, and if the weekly candle will close ABOVE or BELOW this zone.
This would be between these zones:
Interestingly enough, we've extended to a full 2.0 on the Fibonacci retracement level. This will be very helpful in determining major bounce zones during the bearish season:
The next week will be vital! Update to follow at the end on the week on the progress of Bitcoin.
BITCOIN- MONSTER ORDERS IN THE BOOK -> You Know What This Means COINBASE:BTCUSD “Monster orders” are exceptionally large buy-limit orders clustered roughly 7 % beneath the current market price.
Large buy-limit walls can act like a price magnet—deep liquidity attracts algos and traders hunting fills, often pulling price straight toward the level.
Once the wall absorbs the selling pressure, the magnet flips: liquidity dries up, supply thins, and price can rip away from that zone with force.
They create a visible demand wall in the order book, signalling that whales / institutions are ready to absorb a dip and accumulate at that level.
Price will often wick into this zone to fill the wall, then rebound sharply—treat the 7 % band as potential support or entry.
Such walls can act as liquidity traps : market makers may push price down to trigger retail stop-losses before snapping it back up.
Confirm that the wall persists as price approaches and that spot + derivatives volume rises; if the wall disappears, it may have been spoofing.
Always combine order-book context with trend, momentum and higher-time-frame support for higher-probability trades, Just like the extremely powerful indicators on the chart.
🚀 Marty Boots | 17-Year Trader — smash that 👍, hit LIKE & SUBSCRIBE, and share your views in the comments below so we can make better trades & grow together!

Bitcoin Prediction that will blow your mind (warning for bulls) I am showing you that BTC made new ATH only in the USD pair and not in other pairs like EUR, and why, and what you can anticipate and what to watch out for from #Bitcoin next.

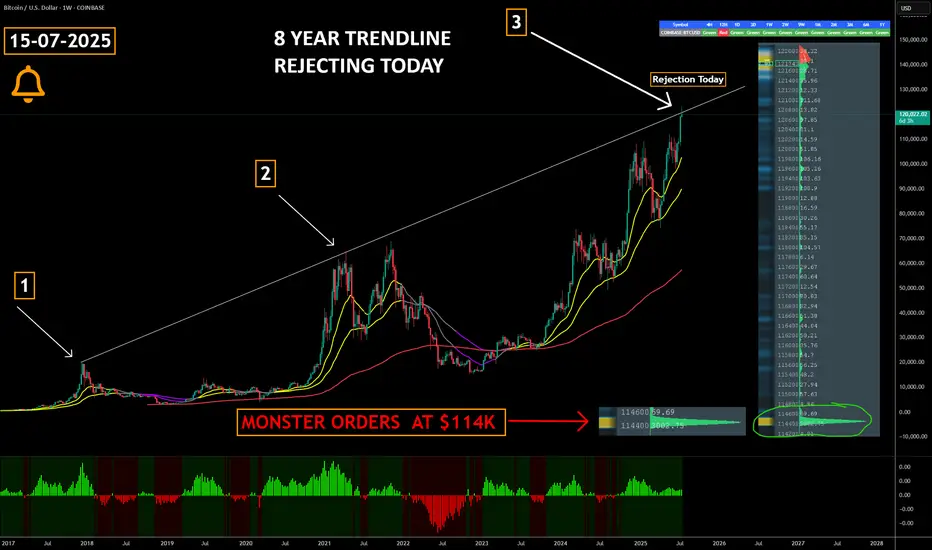
Did Bitcoin Just TOP OUT ??????
COINBASE:BTCUSD has just collided with an 8-year rising trendline that capped the market’s last two cyclical peaks—historically, this level has triggered multi-month corrections and Bear Markets.
Triple-test significance : a third touch of a long-term trendline ➜ heightened odds of a reaction; failure to break cleanly often confirms a major top.
Watch for confirmation signals —weekly bearish RSI divergence, waning volume, or rejection wicks can validate a reversal scenario.
Breakout = regime change : a decisive close and hold above the line flips it to support, opening the door to fresh price discovery and potential parabolic upside.
Large Orders at $114k create a visible demand wall in the order book, signalling that whales / institutions are ready to absorb a dip and accumulate at that level.
Risk-management alert : consider tightening stops, reducing leverage, or hedging until trendline fate is resolved.
The buy pressure has been relentless but this is always worth paying attention to
Marty Boots | 17-Year Trader — smash that , hit LIKE & SUBSCRIBE, and share your views in the comments below so we can make better trades & grow together!
btceur ath not yet reachedbitcoin all time high is not in. If euro will stay strong ATH could be in two months at 112 000€ ~ 130 000 $, then down only bear market for a year

80k BTC On The Move - WHAT It Means 80,000 BTC Wallet Movement (2011 Miner)
• Source: 8 wallets containing 10,000 BTC each — mined in 2011, dormant for 14 years
• Total Value: Over $8.6 billion USD
• Timing: Moved on July 4, 2025 — largest dormant BTC transfer in history
• New Addresses: Funds moved to modern SegWit wallets
• Probable Owner: Likely a single early miner with 200k+ BTC history
Possible Reasons for the Move
• Key Rotation: Upgrading to modern wallets for better security
• Recovered Access: Private keys may have been recently recovered
• Market Strategy: Positioning for profit-taking or major sell-off
• Yield Farming: Preparing COINBASE:BTCUSD for use in DeFi/lending platforms
• Collateral Use: Possibly for loans, stablecoin leverage, or RWAs
• Estate Planning: Legal restructuring or generational wealth setup
• OTC Transfer: Could be prepping for off-exchange institutional sale
• Psychological Warfare: Could be intended to spook or manipulate the market
• Regulatory Response: Aligning with new compliance or tax jurisdiction
Market Reaction
• COINBASE:BTCUSD Price Dip: Price briefly fell below $108,000 post-move
• ETF Context: Movement occurred despite record ETF inflows
Key Note: These wallets had not been touched since COINBASE:BTCUSD was worth ~$0.78. Their reactivation adds uncertainty and opportunity in a fragile macro environment.
• What to do????: Watch the orderbook to find these large bitcoin moves in case of exchange selling
Near term support & resistance
$106000 support
$109500 first resistance
👍 If this breakdown helped your trading, smash that Like and drop a comment below—let me know what you think will happen with the 80k COINBASE:BTCUSD . 👍
Best Reguards
MartyBoots, 17-year market trader

MACRO 3-Drive Pattern on Bitcoin | Major Reversal Ahead?Is Bitcoin completing a massive 3-drive structure on the macro chart?
Three clear pushes higher, each with fading momentum, are flashing a major reversal signal.
This could be the final phase before a long-term shift — are you ready for what’s next?
📚 3-Drive Structure Trading Strategy — Full Breakdown
The 3-Drive Pattern is a powerful reversal-based price structure used to spot major turning points in trending markets. It works by identifying three consecutive drives (or pushes) in one direction, typically ending with exhaustion and a high-probability reversal.
Each drive forms a new high or low, but with weakening momentum — especially visible using RSI, MACD, or volume divergence.
🔍 What is the 3-Drive Pattern?
3 consecutive higher highs (or lower lows)
Each drive followed by a shallow pullback
Momentum weakens on each push (divergence forms)
Fibonacci symmetry often present:
- Drive extensions: 127.2%–161.8%
- Pullbacks: usually 61.8%
📉 Bearish 3-Drive (Reversal from Uptrend):
Drive 1: Price makes a higher high with strong momentum
Drive 2: Another higher high, weaker strength
Drive 3: Final high with clear divergence
Reversal: Entry when price breaks below structure
🎯Entry Criteria:
Wait for all 3 drives to form
Confirm with divergence on Drive 3
Use a confirmation candle or structure break
Stop-loss: just beyond the 3rd drive’s high
🎯 Targets:
Conservative: Return to Drive 2 base
Aggressive: Full trend reversal (50%–100% Fib retracement)
🧠 Pro Tips:
Best on 4H, 1D, 3D or 1w timeframes
Confirm with RSI, MACD, or volume divergence
Combine with key S/R or supply-demand zones
💡 Summary:
The 3-Drive pattern is one of the most reliable reversal structures when combined with divergence and Fibonacci symmetry. It's especially powerful at market exhaustion zones and works best with confirmation-based entries.

Bitcoin & Ethereum New Quarter | What To Look For🎯 New Quarter For COINBASE:BTCUSD & COINBASE:ETHUSD — What To Look For
As we enter a new quarter, smart money is already positioning.
Institutional investors, hedge funds, and asset managers don’t just trade price — they rotate capital based on quarterly performance, risk appetite, and macro expectations. That’s why each quarterly open is a key inflection point across all markets — including crypto.
In this video, I break down:
• 🧠 How institutional capital rotation impacts Bitcoin and Ethereum
• 📈 Key levels to watch as Q3 unfolds
• 🔁 What are the likely outcomes
• 📊 How to prepare for volatility and new trend formation
This isn’t just another candle — it’s the start of a new chapter in the cycle.
If you’re serious about understanding where the money flows next , this video is for you.
This is the likely outcome
Price not ready to moon yet
Strong candle implying new highs incoming
Watch for bearish stop hunt on new quarter
This is a bullish outside bar
MartyBoots here , I have been trading for 17 years and sharing my thoughts
👍 Enjoyed the insights?
Let me know your thoughts in the comments below — and don’t forget to like this post to support the channel!

Has Bitcoin Topped? Trump’s SBR Impact | Deep Dive Analysis🚨 Has COINBASE:BTCUSD topped? Even with Trump's Bitcoin Strategic Reserve? 🚨
In this deep dive, we analyze COINBASE:BTCUSD major factors that could point to a major reversal or breakout and to uncover whether a market top is forming.
We’ll cover:
Powerful Indicators
Bitcoin / BTC Trends
Price Action
EMA / SMA Trends
Volume Delta
Trend reversal / breakout
Bullish / Bearish / Confirmation from Indicators
order flow analysis
Timeframes (1W, 1D, 1m, 6M etc.)
Bullish and Bearish Sentiment
Strength Candles
👉 Like, comment below, and follow for more pro-level crypto insights.
MartyBoots here , I have been trading for 17 years and sharing my thoughts on COINBASE:BTCUSD .
Whether you're a short-term trader or long-term investor, this post provides the technical insight and edge to help you make better informed decisions.
📉 Stay ahead of the market. Watch the full breakdown and view charts to decide for yourself: Has Bitcoin really topped?
Watch video for more details and below I will show some powerful charts with descriptions.
Warning in near term - LARGE ORDERS
Consolidation in price with large orders above
The Red lines = LARGE ORDERS
Large orders can act as an magnet to price
Large orders can also be support and resistance
Price Above the white 100 moving average
Price strong above it
Price weak below it
Strength Candles
Still Bullish
Multiple timeframes still green
Sentiment Tool Still Bullish
Still Bullish
Multiple timeframes and settings still green
3 Drive Structure
Equal Measured moves
Implies Top Is Not In
Target = $126k
Bullish Engulfing Candle
Implies higher prices to come
👉 Like, comment below, and follow for more pro-level crypto insights.
#Bitcoin #Trump #BTC #CryptoTrading #TechnicalAnalysis #CryptoMarket #BitcoinTop #TradingView #StrategicBitcoinReserve

Bitcoin Order Book - How To Trade ItBitcoin Order Book Analysis | Massive BTC Liquidity Zones You Need to Watch
In this video, we break down the Bitcoin (BTCUSD) order book and highlight the biggest buy and sell levels currently driving market sentiment. These are the exact price zones where whales and institutions are placing large orders—often creating powerful support and resistance that can trigger breakout or reversal setups.
In This Breakdown:
• Where major buy/sell walls are forming in the BTC order book
• How order book depth can predict short-term price direction
• Real-time liquidity pockets traders are watching now
• Key price levels to watch for possible long/short entries
This is a must-watch if you’re actively trading BTC and want to track where the smart money is stacking their positions.
⸻
Tools Featured:
• BTCUSD real-time chart
• Order book heatmap / depth
• Liquidity zone visualizations
• Volume profile overlays
• Sentiment Tool
⸻
Use this insight to position your trades around high-probability reversal or breakout zones. Comment your BTC target below, and follow for daily pro-level crypto insights.
⸻
#Bitcoin #BTCUSD #OrderBookAnalysis #BTCOrderFlow #WhaleActivity #LiquidityZones #CryptoTrading #PriceAction #CryptoTA #BitcoinStrategy

BTC FRACTAL : Has BTC been following THIS EXACT PATTERN?The only difference in terms of the first peak, is the duration. But even the pullback size has been similar:
Interestingly, in terms of the second peak, the increase from the corrective bottom to the new ATH is almost exact at 122%:
Here's why we MAY still have a small push upward:
- The previous time, the peak was at least 6% higher. Currently, that would put us around 116K.
- The current pennant pattern is different from the previous bearish flag.
2%:
Pattern:
Do you think the bearish cycle is starting, or is another push up likely?
___________________
BINANCE:BTCUSD

Ethereum Is Not DEAD ... WHY ??? Because BlackRock Says SoMartyBoots here , I have been trading for 17 years and sharing my thoughts on ETH here.
ETH Is Not Dead — It’s Just Getting Started
Narrative of ETH being “dead” is short-sighted. Here’s why:
1. Ethereum Is Still Younger Than Bitcoin
• Ethereum launched in 2015, a full 6 years after Bitcoin.
• BTC had over a decade of network effect, price discovery, and global trust before ETH even got its first DApp.
• On the charts, ETH still has room to mature, just like Bitcoin did pre-2020.
• Fundamentally, Ethereum is still evolving — from PoW to PoS, scaling solutions (L2s), and now modular chains.
You’re not late to ETH — it’s just halfway through the marathon.
⸻
2. BlackRock’s BUIDL Fund Is a Massive Signal
• The BlackRock BUIDL fund, launched on Ethereum, already has $3B in AUM — and it’s growing.
• It shows that legacy institutions aren’t ignoring ETH — they’re building directly on it.
• This isn’t speculative hype. It’s tokenized real-world assets backed by the biggest asset manager on earth.
• Smart money is moving into ETH, not away from it.
The narrative is shifting. Institutions aren’t betting on meme coins — they’re betting on Ethereum rails.
Final Thought
ETH is not dead. It’s undergoing the same early-stage skepticism BTC did in its early years. With foundational upgrades and institutional validation, ETH might be the most undervalued top asset in the market today.
⸻
Watch the chart. Track the fundamentals. And don’t sleep on ETH.
#Ethereum #ETHUSD #Crypto #fundamentals #BUIDL #BlackRock #OnChainData #NotDead #TradingView
Watch video for more details

BTC - Why THIS TIME is DIFFERENT (⊙ˍ⊙)This time IS DIFFERENT. Bitcoin has made a new ATH as I predicted in a few previous posts, but something's off...🤔
If we look at BTC from a macro view, the dates for this run up was quite extended. We do see some similarities in terms of the retracement (highlighted in blue) but from a timeframe analysis, there is no comparing this high to the previous:
stretching from March to October where classical bear market symptoms were show - lower highs and lower lows, with a duration unlike any of the previous cycles.
Interestingly, the previous season we increased not even 7% from the previous peak. And if we were to look at the same fractal, that places us around $116k.
But the ONE thing, that has had me suspicious this entire time (🥁) was ETH. Overlaying the ETH chart, we see that historically, ETH peaked a week or two after the BTC ATH - until this time.
The fact that BTC made such a dramatic ATH and Ethereum didn't? That was a new one. And even up to now, ETH is still 80% away only from it's previous ATH - imagine the altseason we will have IF ETH makes a new ATH... or will this time just be , different ?

BREAKING NEWS - India launches missile attack on Pakistan
🚨MartyBoots here , I have been trading for 17 years and sharing my thoughts on btc here..
🚨
BTC is a geopolitical asset
Bitcoin Vs Microsoft 🚨MartyBoots here , I have been trading for 17 years and sharing my thoughts on COINBASE:BTCUSD .
🚨
.
NASDAQ:MSFT vs COINBASE:BTCUSD
Do not miss out on COINBASE:BTCUSD as this is a great opportunity. You are still early
Watch video for more details

Could The Stock Market Crash? - WARNING 🚨MartyBoots here , I have been trading for 17 years and sharing my thoughts on SPX .🚨
🚨 SP:SPX Could It Crash?🚨
Lets look into it deeper, very interesting chart but also a dangerous one. Need to see buyers soon or this is could be worse than people expect. 5-10% drop minimum and extreme bear could drop 40% total🚨
Watch video for more details

Bitcoin / Euro Pitchfork experimental ideaDoes Bitcoin / Euro give a new perspective compared to the usual Bitcoin / USD chart?
I drew a Modified Schiff Pitchfork with anchor-points December 2018, November 2021 and November 2022.
It seems to respect the Fib levels and 0.25, 0.5, 0.75, 1.0 levels well. Let´s see how it plays out.

SECRET Indicator Says LINK Will Moon🚨MartyBoots here , I have been trading for 17 years and sharing my thoughts on BINANCE:LINKUSDT here.🚨
.
🚨 BINANCE:LINKUSDT is looking beautiful , very interesting chart for more upside
and is now into support🚨
Do not miss out on BINANCE:LINKUSDT as this is a great opportunity
The SECRET Indicator says it will moon
Watch video for more details

Were To Buy BITCOINMartyBoots here , I have been trading for 17 years and sharing my thoughts on COINBASE:BTCUSD here.
.
BTC is very interesting chart for now that it has dipped 30% and trying to find support.
Do not miss out on BTC at the important levels as this will be a great opportunity
Watch video for more details

BTC ~ MACRO Bounce ZoneBTC has been holding the 80K zone well, but from the macro perspective the bearish cycle should be starting soon.
This is due to simple logic (after such a dramatic ATH) as well as the Wyckoff Method.
Unless we can reclaim 90K, it's likely that this will be the third touch on the parabolic curve - which is usually when the bearish cycle starts.
Previously, BTC retraced and bounced one Fib higher than the price at the start of the bullish cycle. This puts us roughly at 28k, as well as at the neckline of the previous resistance zone before the new ATH:
______________
BINANCE:BTCUSDT
