BTC CME Futures: The Capitulation Buy SetupSimply:
The logic here is simple.
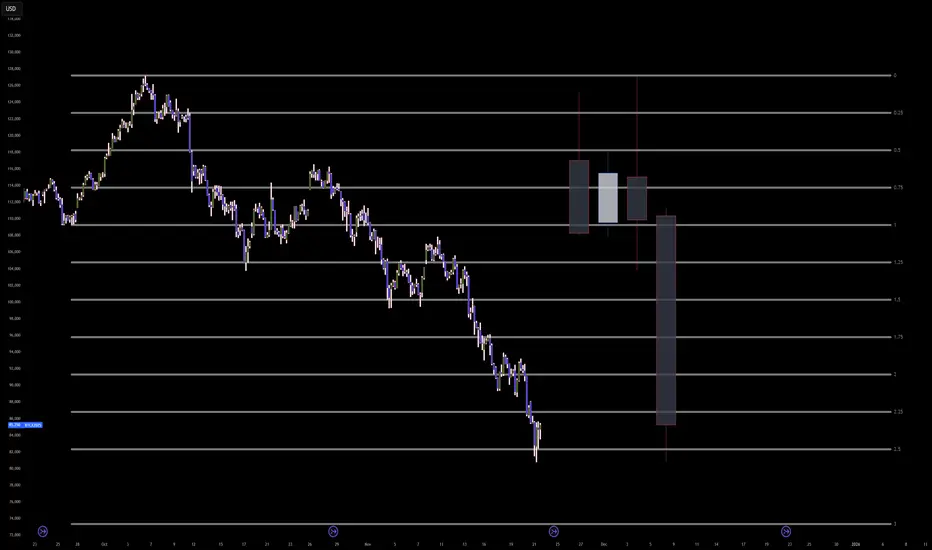
Bitcoin has dropped too far and too fast.
We are currently hitting a major mathematical exhaustion point (the 2.5 Standard Deviation line).
At the same time, we are entering that big blue support box between 78k and 82k where the massive rally started earlier this year.
This is not a crash anymore; it is a bear trap.
Retail traders are panic selling right at the bottom, which provides the liquidity for big players to buy.
We are setting a limit order to catch the final wick down before the bounce.
Entry: 81,250 (Buy Limit)
Stop Loss: 77,500 (If it goes below here, the setup is wrong)
Target: 94,000 (The bounce back to equilibrium)
Don't chase the red candles.
Let the price come to you, fill the order, and wait for the squeeze.
____
Advanced:
The algorithm is currently executing a terminal volatility expansion into the 2.5 Standard Deviation extremity to finalize the Macro Sell Model and engineer a generational Smart Money Reversal.
The present liquidation cascade is not a crash but a precise, mathematically ordained delivery of price into the deep discount 'Blue Box' accumulation array to harvest the final sell-side liquidity before the grand repricing event.
Entry: 81,250.00 (Limit Order - 4,000 points below market)
Stop loss: 77,500.00 (3,750 points)
Take profit: 94,000.00 (12,750 points)
Risk to reward ratio: 3.40R
The Opportunity
The Bitcoin algorithm has been running a high-velocity sell program from the 126,000.00 highs, systematically dismantling every bullish PD Array.
However, we have now breached the Event Horizon. The price is magnetically drawn to the confluence of the 2.5 Standard Deviation projection and the historical Accumulation Block (78k-82k) originating from the early 2025 impulse.
This zone represents the 'Algorithmic Floor'—a region of maximum discount where institutional order flow must pivot from distribution to accumulation to close massive short positions and defend the macro bull trend.
The Entry
Do not chase the current candle. The algorithm demands a touch of the 2.5 Standard Deviation level at approximately 80,800.00 - 81,200.00 to complete the fractal expansion.
We place our limit order at 81,250.00 to front-run the absolute mathematical bottom, capitalizing on the 'Capitulation Wick' that will clear the final trailing stops.
This entry is timed for the CME close/open gap or the weekend volatility injection, which often targets these extreme deviation levels to trap late bears before a violent Monday reversal.
The Invalidation
The reversal thesis is ontologically corrupted if price displaces below the 3.0 Standard Deviation level and the bottom of the accumulation block at 74,000.00.
A sustained closure below this level signifies a total failure of the macro structure and a transition into a secular bear market, invalidating the accumulation narrative.
This would shift the probability manifold to the Primary Antithetical Chain, targeting the 60,000.00 liquidity void.
Key Trajectory Waypoints
Target 1: 86,000.00 | Type: Immediate Rebalance (2.25 SD) | Probability: 90% | ETA: 24 Hours
Target 2: 90,500.00 | Type: Internal Bearish Breaker | Probability: 75% | ETA: 3-5 Days
Target 3: 94,000.00 | Type: Equilibrium / FVG Fill | Probability: 60% | ETA: 1-2 Weeks
The Shadow Reality
A 25% probability exists for the antithetical reality: The Abyss Cascade.
In this scenario, the 2.5 SD level fails to provide a reaction, and the algorithm enters a 'Free Fall' discovery mode targeting the 3.0 SD at 74,000.00 immediately.
This reality is confirmed if price slices through 80,000.00 with no wick response.
___
tags: BITSTAMP:BTCUSD COINBASE:BTCUSD INDEX:BTCUSD BINANCE:BTCUSD
Btcfutures
Bitcoin (BTC/USDT) - Support Trendline & Zone Price Test - DailyBitcoin (BTC/USDT) price recently rejected down from $107000 on May 19th, 2025.
The yellow Support Trendline below is currently being tested ($103000 price level).
Several candle body closes below the Support Trendline could signal weakness in the daily price trend (potential rising wedge pattern).
The April inverse head-and-shoulders price pattern and targets have been completed (+12% and +24%).
note: Breaking news, government law changes, corporate announcements, and crypto crime could affect the Bitcoin price and charts.

Bitcoin Futures
Another week concludes for the Bitcoin futures market without closing above the all-time high. The RSI is in overbought territory, showing a bearish divergence. It might be prudent to close the futures gap and look for a bullish divergence before expecting further upward movement. The price might revert to the high of the RSI for support, which was around the 49k area.

Bitcoin and green November? BINANCE:BTCUSDT
✅Before we start to discuss, I would be glad if you share your opinion on this post's comment section and hit the like button if you enjoyed it.
Thank you.
Bitcoin made retested downtrend line on D1. According to my "Take profit" indicator we bounced at real value price in June. Usually when we touch this line we going to test take profit line on D1 timeframe. Marked this zone on a chart. Also my indicator "Direction" showed signal to buy, so now im waiting Bitcoin around 25-29K in this range and signals to take profit on this both indicators and others.
Possible Targets
➡️After retest trend line and fundamental value line - 25000 - 29000
➡️When we touch take profit line in this ill looking to open local short
➡️Watching on FOMC rate at the beginning November and continuation local uptrend.
In December Ill expect test 20K again
Hope you enjoyed the content I created, You can support with your likes and comments this idea so more people can watch!
✅Disclaimer: Please be aware of the risks involved in trading. This idea was made for educational purposes only not for financial Investment Purposes.
* Look at my ideas about interesting altcoins in the related section down below ↓
* For more ideas please hit "Like" and "Follow"!

BTC Futures Analysis: Key Levels, and Potential ScenariosBig Picture:
BTC Futures reached a new high at 108,960 last Tuesday Dec 17, 2024. FED rate decision and 2025 rate cut projections tampered down from 4 to 2 resulted in market sell-off. BTC futures were also down reaching a low of 92,355 on Friday and closing at 96,600.
CME Futures halt early tomorrow and are closed on Wednesday Dec 25th, 2024 for Christmas holiday. We also have a very light economic calendar. Lower liquidity during the holiday period may push prices in either direction.
Key Levels to Watch:
Nov 18th Week Hi: 101,110
Dec 10th Low: 94,785
Last Week Low: 92,355
LIS (Line in Sand) for short-term bulls: 92000- 90,000 support zone.
Scenario 1: Consolidation Above Key Support
BTC futures further consolidate between Dec 10th Low and Nov 18th Week Hi at 101,110. Price did not close below LIS last week. As long as this support holds, price holding above 94,785 may provide a setup towards 100,000- 101,110.
Scenario: 2: Breakdown below LIS
Break down of LIS will see a deeper pull back towards 78,000. Here it will be a wait and see approach for BTC futures to hold below 90,000 mark and expect further downside if buyers fail to push prices back above.
Disclaimer: The views expressed are opinions and should not be interpreted as financial advice. Derivatives involve a substantial risk of loss and are not suitable for all investors.

Btc1!/UsdtCME:BTC1!
Simple to understand market going to fill this gap soon i am not moving my Spot position when market give a opportunity then i am going to buy some spot bags...
Disclaimer : Not Financial Advice

BTC/USDT.P - SHORTi am looking forward to see btc taking out the left over liquidity below before heading upward lets see if the FVG gets filled, aiming for the lows mentioned below

BTCUSDT.P - LONGHere we go again shifted structure again with a great displacement thats my trigger plan we long with a retest if we get filled, Cheers!

BTC1! - HARD TO BUY AT THE TOP? - BUY AT THE RED LINE - WEEKLYBTC Future price is ranging at the top of his historical price range zone.
We feel that there is a potential for the price to just leave earth and go beyond easily and at the same time deception can occur with possibility to see the price squeeze down buyers before going in its potential historical run up to new highs.
This is when DCA or Entry could potentially be done at the RED LINE zone. Long Entry to not miss history!
Who still believe that it could go to zero? here fundamental analysis is necessary depending on how regulation is going to evolve in the next years....

BTC – Weekly Perspective – 02/25 to 03/03As reported in a previous analysis, the crypto finally managed to overcome and remain above an important resistance band, 44.9K. A beautiful victory for the bulls and, with that, the path seems to be clear for prices to seek the historical top region at 65K and, consequently, scare away once and for all the ABC corrective pattern of ELLIOTT's final sequence. (12345ABC).
Based on this premise, don't be surprised if there is a drop to the 40K range, as a drop like that is within the corrective script for any steeper climb. If this corrective process takes place, we can think of new levels of increase in the following values: 55.4K and finally, 65K.
And now, is it possible to dream of this bullish pattern for crypto? This pattern usually happens at high times, demonstrating that the asset in question is the hot ticket. If this bullish pattern holds true, it will closely resemble the pattern of the true protective asset. Click here and find out what this protective asset is. Below is an image of the possible pattern that could emerge, as well as the upward pivot on the weekly chart.
Do your analysis and good business.
Be aware, if you buy, use stop loss.
See other graphical analyzes below.

$BTC Daily updateCRYPTOCAP:BTC #BTC Called it almost 6 hours before, bearish divergence played out on 4H and given support at $48,644 came in effect, $49,734 resistance testing as of now, RSI back below overbought thanks to the correction here and managed to keep the progress nicely, Bullish pin bar on previous daily close if followed thru next S/R area expected at $50,579 / $51,630, some resistance at $52,932-$53,672.

btc short trade idea Simple price action trade but make sure to check the market news
Breakdown - Retest fake breakout - AGAING FALLING
Good risk reward ratio.

Crypto Spring Beckons As Regulatory Fog ClearsAI hot; Crypto not! That’s set to change. Bitcoin prices have bounced back even as AI hype hogs the newsfeed.
Crypto was disregarded as a product of inflated bull market fuelled by easy money last year. “Risk-on” assets like Bitcoin (BTC) plunged sharply. Subsequent recovery has been refreshingly consistent suggesting a potential resurgence.
BTC stands 80% higher YTD, outperforming the S&P-500, Nasdaq-100, and Gold.
The collapse of Luna, and FTX, among others resulted in much-needed deleveraging and separated the wheat from the chaff.
Some regulatory guardrails are justifiably necessary for investor protection and responsible industry growth. With a positive resolution of Ripple Labs’ lawsuit against the SEC, a more disciplined regulatory approach appears to prevail.
The improving regulatory landscape, rising institutional adoption, and falling US inflation are likely to drive BTC prices higher this year into the next halving cycle.
This paper posits a long position in Micro BTC futures with an entry at 29,750 combined with a target of 36,000 hedged by a stop at 26,400, yielding a reward-to-risk ratio of 1.85x.
UNPARALLELED BTC OUTPERFORMANCE
YTD, BTC has significantly outperformed even the sizzling Nasdaq-100 index which has rallied thanks to large AI-driven gains. Interestingly, the correlation between them indicate that each had unique driving forces.
Like Gold, BTC rally this year was driven by crisis in US regional banks. The collapse of SVB and Credit Suisse drove higher demand for alternative assets.
More bullish drivers await for BTC. First, clarity in regulatory landscape. Second, rising institutional adoption. Third, BTC Halving next year. Finally, falling inflation.
REGULATORY CLARITY
A major ruling in the lawsuit between the SEC and Ripple Labs has lent much needed clarity. The ruling highlighted that XRP’s programmatic and exchange sales did not constitute investment contracts. Though, sales to institutional buyers did constitute a contract.
Though the lawsuit is far from complete, the ruling did indicate that cryptocurrencies are not securities by default. This highlighted that new regulations are warranted and the heavy-handed SEC enforcement in recent months may need to be tempered.
Regulation of digital assets is also progressing well elsewhere. The EU’s MiCA regulation is already in effect. Several other countries are developing regulatory frameworks.
Although this ruling does not have a direct impact on Bitcoin, which was already considered by the SEC and CFTC as a commodity, it does provide much-needed clarity to the larger crypto industry which Bitcoin will benefit from.
RISING INSTITUTIONAL ADOPTION
New and growing institutional entrants in the space have spurred hopes of greater adoption.
A spot Bitcoin ETF has been in the works for the last two years. Grayscale’s initial application was rejected by the SEC citing that the underlying asset lacked adequate security measures for investors.
Since then, new spot BTC ETF applications have popped up, most notably from Blackrock and Fidelity.
Blackrock is the world’s largest asset manager and their entry in the space has revived hopes. Though these initial applications were rejected, they have filed amendments that include a surveillance sharing agreement with Coinbase which is currently under review.
The launch of EDX markets, a crypto exchange created by US financial majors Charles Schwab, Citadel and Fidelity offers investors a much needed trusted and reliable digital asset exchange. This addresses one of the major concerns from last year - Operational and Liquidity risks.
BTC HALVING
Halving is the periodic reduction in block rewards for mining BTC. Every ~4 years, the rewards for mining BTC are halved effectively reducing the available and future supply. This has previously led to a rally in BTC prices.
Currently, BTC trades 2.5x its price at its last halving. At its peak in November 2021, price was 7x the price at last halving.
The next halving is expected around April 2024, coinciding with the expected start of Fed rate cuts. Price gains witnessed during previous halving’s are unlikely as BTC’s market capitalisation grows.
FALLING INFLATION
Finally, falling US inflation foretells the end of the Fed’s rate hiking cycle. CME’s FedWatch tool forecasts one last rate hike this month with rate cuts expected at the end of January 2024.
Loose monetary policy will act like a tailwind for bitcoin prices.
BULLISH POSITIONING ON CME BTC DERIVATIVES
OI in CME Bitcoin futures has increased sharply over the past month as have the total traders
More of this OI is also positioned long. Asset managers have increased their net long positioning by 40% over the past month highlighting bullish sentiment.
Interestingly, leveraged funds have increased their net short positioning in the same period indicating bearish sentiment.
Contango in BTC futures term structure has steepened increasing the likelihood of higher prices in future.
TRADE SET UP
CME’s cryptocurrency suite offers robust index methodology, and regulated exposure to digital assets. CME cryptocurrency futures are also cash settled, removing the hassle of managing private keys or dealing with unregulated exchanges.
Full-size BTC contracts offer exposure to 5 BTC while micro futures allow for more granular exposure with contract size of 0.1 BTC.
Micro BTC contracts have a margin requirement of just USD 760 which translates to built-in leverage of 4x at current prices.
• Entry: 29,750
• Target: 36,000
• Stop Loss: 26,400
• Profit at Target: USD 625
• Loss at Stop: USD 335
• Reward to Risk: 1.85x
MARKET DATA
CME Real-time Market Data helps identify trading set-ups and express market views better. If you have futures in your trading portfolio, you can check out on CME Group data plans available that suit your trading needs www.tradingview.com
DISCLAIMER
This case study is for educational purposes only and does not constitute investment recommendations or advice. Nor are they used to promote any specific products, or services.
Trading or investment ideas cited here are for illustration only, as an integral part of a case study to demonstrate the fundamental concepts in risk management or trading under the market scenarios being discussed. Please read the FULL DISCLAIMER the link to which is provided in our profile description.

Potential BTC move towards CME GAP Hello Guys,
Short update on my tradingplan. I think the CEM Future GAP between $27400 - 28800 wil get filled before we make a move to the downside.
Lets see how this plan is gonna work out before or maybe after the weekend.
****Its my tradingplan and its not financial advise!
Good luck brothers :)
Cryptodjens

Amazing BTC Futures run to close out last Fridays actionCME:BTC1!
Once the 1H triggers, time to scalp the lower TimeFrames...
Amazing entry Long on the BTC futures....
Ready for this upcoming week?
Trade well...

Comment your View !!comment your view !!
I'm expecting a big up-move in few days.
US CPI Data news Tomorrow !
Market will be volatile.

BTC short trade Plan Waiting for trendline breakdown for Short trade
Price Action Trade
Wait for perfect entry


Long trade Plan (SL hunting trade)
Too many shorts are open at Resistance Level.
If we get this entry will ride in SL hinting Candle...
Coz of Weekend market will be in Range so will book our profit in SL hunting Move

Trendline Fake Breakout Trade Trendline Fake Breakout Trade.
Reason of trade
1. Fake Breakout
2. Inviting Buyers
3. Retailers Looking for Long

Simple Price Action Trade !!Simple Price Action Trade !! ( No indicator required when you are a Price Action based Trader.)
Simple Breakdown retest trade with small SL.
1 Min TF trade !
I'm in this trade with small SL 13X leverage.

BTCPERP NEAR FUTURE ANALYSIS (4H Chart)Technical Analysis Summary
BTC/USDT
TREND ANALYSIS
We have 1 Downtrend in red color (Short Term).
Be careful trends need to be modified when broken to the new peaks (Downtrend) and lows (Uptrend).
FUTURE PREDICTIONS
We have many resistance and support levels that I have mentioned above.
I use thickness as an indicator of strength of levels (ONLY FOR VISUALS).
White levels Levels are very tight stop losses that could be used in high leverage future trading.
Good luck everyone, stay safe!
If you need help don't hesitate to send me a message or comment
If you find this content beneficial please don't forget to LIKE and FOLLOW
Trading Involves High Risk
Not Financial Advice
Exercise Proper Risk Management

BTC/USDT 4HOUR UPDATEHello, welcome to this BTC /USDT chart update by CRYPTO SANDERS.
I have tried to bring the best possible outcome to this chart.
CHART ANALYSIS:-Bitcoin respecting the channel trendlines. Still, there is no movement in the market. Bitcoin CME trading is closed till 3rd January so we may not see much movement in the market. Some volatility is expected in the second week of January.
This is not a piece of financial advice.
Hit the like button if you like it and share your charts in the comments section.
Thank you
