BTC Getting Ready For Another Leg Up ?Following the recent crash, Bitcoin effectively swept all available liquidity around the $70K region, clearing out weak hands and stop orders. With that liquidity now taken, price action is beginning to stabilize, suggesting the market may be preparing for its next significant move. BYBIT:BTCUSDT.P reclaims structure and builds MOMENTUM, this phase could mark the transition from distribution into a new expansion or continuation leg, depending on volume and confirmation.
Btclong

BTCUSDT 442% profits potential 15X leverage —LONG tradeMarket conditions changed but just a tiny bit, so I have to give you new numbers. A new set of trade-numbers that reflect the updated market conditions.
The relief rally is still on, it has two phases. It is an ABC correction. The zero is the 21-November 2025 low, the starting point. Wave A is the high around $98,000 on 14-January. Wave B came in today, a low of $81,118. And, Wave C, the final up-move before the major 2026 crash and long-term bearish cycle, should end somewhere between $100,000 - $110,000.
We have a higher low, etc. Bitcoin is bullish short-term.
Full trade-numbers below:
_____
LONG BTCUSDT
Leverage: 15X
Potential: 442%
Allocation: 3%
Entry zone: $79,000 - $84,200
Targets:
1) $88,000
2) $93,000
3) $98,000
4) $104,400
5) $108,780
Stop: Close weekly below $78,800
_____
Thank you for reading, your continued support is highly appreciated.
This is a high risk trade-setup based on the high leverage but the chart-setup is low risk based on the market cycle and chart signals. This is a high probability trade.
Namaste.

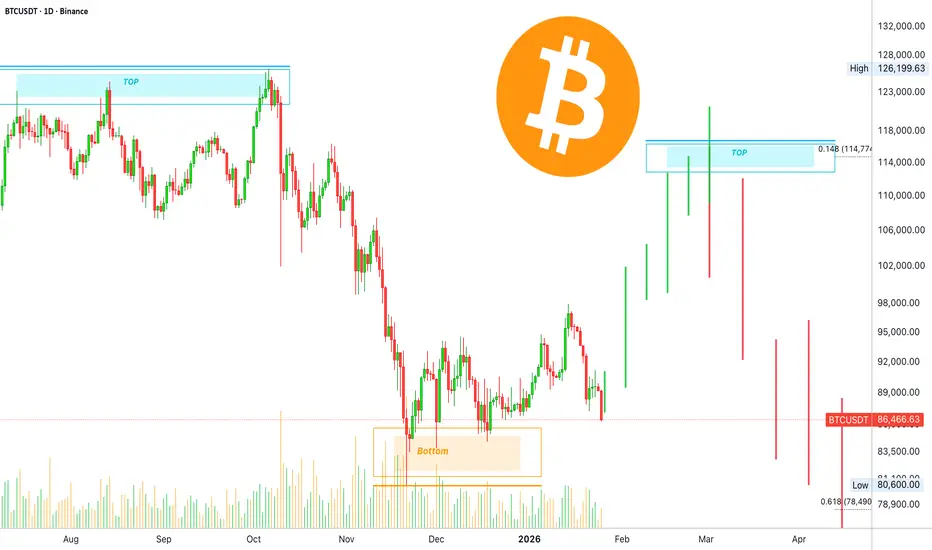
Bitcoin: The relief rally has been cancelled? Is it over?Bitcoin's bear market bottom can easily hit a range between $40,000 to $50,000. It can happen a bit higher but not likely to go lower than 40K. This would be a worst case scenario.
The question I am getting from my followers and readers is related to the short-term: What about the relief rally, is it over? No!
It is true that Bitcoin is set to move lower in the latter part of 2026 but this is still far away. The bearish cycle continuation is a process that is set to start in March or after March 2026, which means we still have some, or plenty, of time left. The relief rally is still on! Bitcoin is going up next.
Bitcoin's 2026 relief rally
We can divide the action that started in November 2021 in two parts: 1) The move from $80,600 toward $98,000, and 2) the retrace from $98,000 toward $81,118, today's low. So far, we continue to be at, and we are at, a classic higher low.
The volume 21-November 2025, the previous low, was 72.26K. Volume yesterday (today is not yet over) was 30.43K. So you can see how volume is lower. Today can result in higher volume than yesterday but it isn't likely to be higher than 21-November. It can also happen that the day closes green but this we do not know.
Market conditions changed, a tiny bit.
A rise from $82,550 toward $116,441 would mean 41% total growth. This is a lot for a relief rally. The previous move peaked around 21%. Normally, we would expect a relief rally to end with total growth around 30-40%. This is to say that we need to update our final target, we need to be a bit more conservative.
For the last bullish move before the major bearish climax, the 2026 Bitcoin market crash, we are going to be aiming at a range between $108,000 to $110,000. This is our updated target for the last leg up of the relief rally.
The altcoins are a completely different game and should be considered individually. It seems many will work as a safe haven as the global financial markets crash. Money will flow from conventional markets to the altcoins, yet, there will still be strong bearish action when Bitcoin moves down.
Thanks a lot for your continued support.
Namaste.

BTC recovery - above 90kBTC Daily (D1) – Short Analysis
Bitcoin is in a corrective phase after being rejected from the 95,000–96,000 resistance zone.
Price is trading below the daily EMAs (34/89/200) → EMAs now act as resistance.
Market structure shows a lower high, keeping the short-term bias bearish to neutral.
Key Levels
Support: 88,500 – 89,000
→ Breakdown may lead to 86,000 – 85,500
Resistance: 91,300 – 92,000
→ Stronger resistance at 93,800 – 95,300
Bias
Below 92K: bearish / consolidation
Daily close above 93.8K: bullish recovery toward 96K+
Conclusion: BTC is at a decision zone. The next daily breakout will define the next major move.

BTCUSDT (Weekly) – Long-term Chart Update. BTCUSDT (Weekly) – Long-term Chart Update.
BTC is still inside a rising channel (higher highs & higher lows intact).
Price is holding the lower trendline support of the channel — a key bullish area.
The weekly MA (~87.5k) is acting as dynamic support.
Current price: ~88.7k
This is a make-or-break support region.
As long as weekly closes stay above the lower channel + MA, the bullish structure remains valid.
Consolidation above 85k–90k.
100k psychological-
120k–125k (channel mid/upper area)
Extended cycle target 140k–150k+ (as projected)
Weekly close below ~85k.
Break of channel support → deeper correction toward 75k–70k.
short-term consolidation
Buy the dip mindset while structure holds.

BTCUSDT 341% profits potential with 10X leverage —LONG tradeGood afternoon my fellow Cryptocurrency trader, I hope you are having a wonderful afternoon.
I found another chart setup that looks great for a 10X LONG. It is Bitcoin, the top, the biggest, the #1 crypto.
Let's look at this chart setup from a different perspective, let's go with the classic saying; buy when the market is red.
Bitcoin has been in a retrace for nine days and trading volume is really low. The action continues to happen as a higher low... Below the full trade-numbers:
___
LONG BTCUSDT
Leverage: 10X
Potential: 341%
Allocation: 10%
Entry zone: $83,000 - $88,000
Targets:
1) $98,000
2) $104,400
3) $108,780
4) $116,441
Stop: $82,800
_____
Thanks a lot for your continued support.
This trade can start moving the next day. It is a high probability chart setup. It has a good potential for reward. All targets can be reached "short-term," within 30 days.
Thank you for reading.
Namaste.
BTCUSD – 1H Long Setup AnalysisBTCUSD – 1H Long Setup Analysis
Educational purpose only
Market Context
Price formed a weak low near 87,300 and is showing a short-term recovery.
Structure indicates a possible corrective bounce after the recent sell-off.
Price is trying to hold above short-term EMAs, suggesting early bullish strength, but higher resistance remains overhead.
Long Setup (Bullish Scenario)
Entry zone (pullback / hold area): 87,600 – 87,800
This area aligns with short-term support and recovery structure.
Stop Loss (SL)
Stop Loss: 87,200
Below the recent swing low and invalidation of the bullish idea.
Targets
Target 1: 88,450 – 88,650
Target 2: 89,400 – 89,700
Extended Target: 90,300 (previous supply / resistance zone)
Invalidation
A strong 1H close below 87,200 would invalidate the long setup and may open further downside.
Summary
Long idea is counter-trend / recovery-based.
Works best with confirmation and support hold.
Conservative approach: partial profits near first resistance.
For educational purposes only.

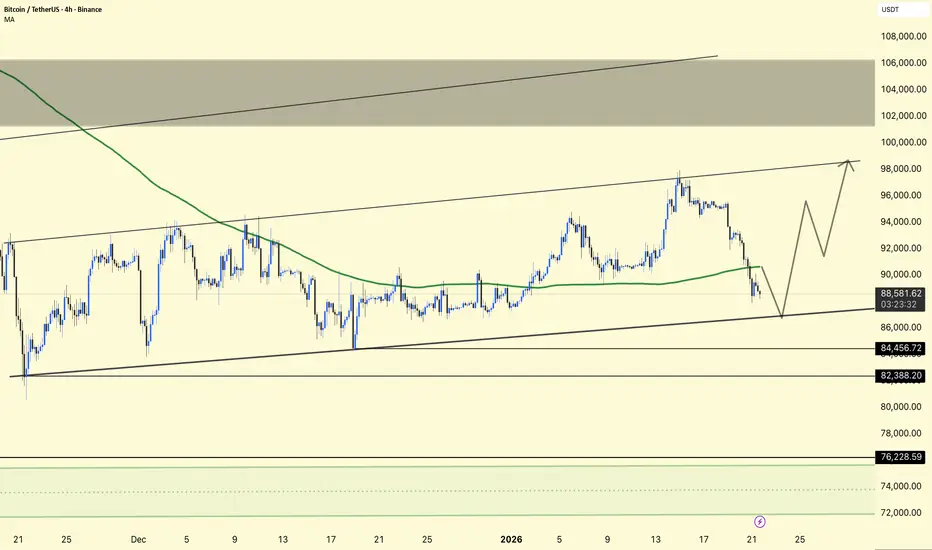
BTCUSDT – 4H Chart Update. BTCUSDT – 4H Chart Update.
Price is moving inside a rising channel.
BTC is currently testing the lower trendline support.
This area looks like a potential bounce zone.
If support holds, a move back toward 92k → 96k → 98–100k is possible.
A clear breakdown below 86k can lead to an 84k–82k support test.
Cautiously bullish while above channel support.
⚠️ Wait for confirmation and manage risk.

BTC/USDT – 4H Small Chart Update. BTC/USDT – 4H Small Chart Update.
Price is moving inside a rising parallel channel (upper & lower trendlines respected).
BTC is currently pulling back toward the lower channel support and the moving average zone.
The green MA is acting as dynamic support on dips.
Support: 88,000 – 86,500 (channel base + MA confluence)
Major Support: 84,500 → 82,300 (breakdown risk zone)
Resistance: 94,000 – 98,000 (upper channel/supply)
Hold above lower trendline → bounce → retest 95K–98K
Breakdown below 84.5K → deeper correction likely
The structure remains bullish while it is inside the channel. This looks like a healthy pullback, not trend failure—unless the lower trendline is lost on strong volume.
Not financial advice. Manage risk.
BTC/USDT – 4H Chart Update. BTC/USDT – 4H Chart Update
Price is pulling back into a major demand zone (92,000–93,500)
Price remains above the 4H moving average, which is acting as dynamic support
The long-term rising trendline remains unbroken, keeping the macro bias bullish
Immediate Support: 92,000 – 93,000
Support: 90,200
Strong Support: 84,400 (HTF Demand)
Resistance: 95,500 → 97,800 → 99,000
If BTC holds above 92K and reclaims 93.5K, further upside is likely
Targets:
95,500
97,800
99,000+
A break below 92K with high volume could lead to a larger pullback towards the 90K MA support
The structure only weakens below 90,200
BTC is in a healthy pullback within an overall uptrend. As long as the price remains above the moving average and the rising trendline, dips remain buying opportunities rather than trend reversal signals.
⚠️ This is not financial advice. Trade with proper risk management.

BTC/USDT Chart Update. BTC/USDT Chart Update
Overall bullish structure remains intact
25 MA (Moving Average)
Price is holding strongly above the 25 MA
25 MA is acting as a dynamic support zone
94,000 – 94,300 → major demand + MA support
As long as this zone holds, any pullback is considered healthy
99,700 – 100,000 → immediate resistance
A confirmed breakout can open the path toward 102K – 104K
Ichimoku Cloud is providing support, confirming trend strength
A 4H close below the 25 MA may signal short-term weakness
In that case, the price could retest the 90,200 area
The trend is still bullish. Dips may be viewed as buying opportunities as long as the price holds above the 25 MA.
Market involves risk — use proper risk management.

BTC/USDT (4H) – Chart UpdateBTC/USDT (4H) – Chart Update
Trend: Bullish structure intact
Price Action: Higher highs & higher lows continue
Ichimoku: Price holding above the cloud → strength remains
Bitcoin has successfully reclaimed the key demand zone (~94K) and is respecting the rising trendline. This pullback looks healthy, not a trend reversal.
As long as BTC holds above 93.5K–94K, upside momentum stays active
A clean push above 96K can open the path toward the 100K–102K liquidity zone (marked area)
Loss of the 94K support may lead to a deeper retest near 90K before continuation.
Structure favors continuation to the upside. Patience and proper risk management are key.

BTC/USDT – 4H Chart Update. BTC/USDT – 4H Chart Update
The price is still trading within a descending triangle/wedge, with clear compression visible.
BTC is trading just below a major horizontal supply area (≈ 94K).
Trendline support + moving averages are holding around the 90K–91K area.
Bounce from the trendline: Could trigger a short-term move towards the supply zone.
Clear breakout and close above the upper trendline: Confirms bullish continuation and opens the way for higher levels.
Rejection from supply again: Could lead to another pullback towards the trendline support.
The market is in a decision phase. The bias will only turn bullish upon a confirmed breakout. Until then, expect range-bound volatility and respect the key levels.

Bitcoin Update. Bitcoin Update.
Bitcoin is reacting to a strong supply zone, resulting in a short-term rejection. Despite this, the price remains above the ascending support trendline, maintaining the bullish structure.
A bounce off the trendline could initiate a new upward move. However, a clean breakout with confirmation from the current pattern would be the key signal for a strong continuation of the bullish trend in the market.
⚠️ Until then, expect consolidation with volatility—patience and confirmation are crucial.

BTC/USDT – 4H Chart UpdateBTC/USDT – 4H Chart Update
Bitcoin is trading inside a rising wedge / ascending structure and has just made a strong bullish push from the lower trendline.
Price holding above short-term MAs
Higher lows structure intact
Bullish momentum is building near the resistance
Current Price: ~92.5K
Immediate Resistance: 94.5K – 95K
Major Resistance: 96.8K
Support Zone: 89K – 90K
Trendline Support: ~88K
Above 90K: Bullish continuation possible
Break & hold above 95K: Momentum could accelerate toward 96.8K+
Rejection near resistance: Expect a healthy pullback to trendline support
A 4H close below 88K would weaken the bullish structure.
Bullish while above key support
Trade with discipline & proper risk management

BTC - Let Him CookShared a quick thoughts on BTC and what to expect soon.
Let me know if you agree, disagree or what you thinking in comment below.
Cheers!

BTCUSDT – 4H Chart Update. BTCUSDT – 4H Chart Update
BTC is showing strength after holding the $84.6K–$85.8K demand zone multiple times (strong buy interest visible).
Price is now moving higher with short-term bullish momentum.
🔹 Support: 85.8K / 84.6K
🔹 Resistance: 93.5K–94K zone
🔹 Bias: Bullish above support, pullbacks are buy-on-dips
As long as BTC holds above the marked support, upside continuation remains likely.
Risk management is key ⚠️

Quick Bitcoin analyseBitcoin is testing the $90.3k S/R level again, but this time we're seeing 4h candles closing above the EMA200. If this level holds, I expect a clean break toward $95k and $100k after (local high of HTF trading area). Once $90.3k is confirmed as support, everything will pump.
CRYPTOCAP:ETH 4h time frame:
ETH moved into a new trading area between ~$3050 and ~$3250 and is around the mid of the range atm...
No fomo... Wait for confirmations to scalp around the mid... But when it comes back to the lower range around ~$3050 (and bounce on EMA200 on the 4h), Major Highcaps will pump... Keep an eye on that level... ✍️

BTCUSDT UPDATE#BTC
UPDATE
BTC Technical Setup
Pattern: Falling Wedge Pattern
Current Price: 90,000$
Target Price: 104,109.59$
Target % Gain: 15.80%
Technical Analysis: BTC is breaking out of a falling wedge pattern on the 1D chart, indicating bullish potential. The price has recently pushed above the wedge resistance, showing early signs of trend reversal. Volume expansion on the breakout adds confirmation, and the structure suggests a measured move toward the highlighted target zone.
Time Frame: 1D
Risk Management Tip: Always use proper risk management.

BTCUSDT – Chart Update. BTCUSDT – Chart Update
Price compressing inside an ascending triangle
Higher lows holding → bullish structure intact
Key resistance: 89.5K–90K
Break & hold above = momentum move toward 92K–95K
Support: 87K–86K zone
👉 Patience here. Expansion coming after the breakout.
Not financial advice

Bitcoin vs Gold : The Hidden Bullish TriggerIn this analysis I shared my thought on why I believe INDEX:BTCUSD bull market cycle haven't started yet, and why 2026 will be a bull market against the 4-year narrative of expected bear market.
Watch, Listen and share your thoughts below.
Cheers!

BTCUSDT – 4H | Chart Update. BTCUSDT – 4H | Chart Update.
BTC is compressing inside a symmetrical triangle (lower highs + higher lows). This is a classic volatility squeeze before expansion.
Strong buyer reaction seen multiple times near 85.8k – 84.6k (green circles)
Rising trendline support is still respected.
93.5k – 94k remains a heavy rejection area
Price needs a clean breakout to unlock upside
Price is trying to reclaim short-term MA
Sustained hold above trendline + MA = bullish confirmation
Above 89–90k → breakout attempt toward 93k+
Below 85.8k → deeper pullback toward 82.2k
This is a decision zone. Structure favors upside only after confirmation.
Small update • Big move loading
DYOR | NFA

BTCUSDT –Chart Analysis (4H)BTCUSDT –Chart Analysis (4H)
BTC is coiling inside a tightening range — lower highs vs higher lows. This type of compression usually leads to a sharp directional move.
Price is respecting the rising base around 85k
Every dip into the green zones shows buyer absorption
Sellers are active below 89k, keeping pressure from above
Support: 85,800 – 84,600
Major Support: 82,200
Resistance: 88,800 – 89,500
Supply Zone: 93,500 – 94,000
When price holds support during Extreme Fear, it often means weak hands are exiting while stronger players accumulate quietly.
DYOR | NFA
