Short-term analysis of Bitcoin (12H)After the heavy drops | which we had already identified in previous analyses () | Bitcoin is now approaching a strong supportive order block.
From the point where we marked the red arrow, Bitcoin entered a bearish phase, and it is expected that wave C of this phase will complete around the green zone.
We will see whether the price reaches the green area or not.
The initial target for this bounce can be the 95K to 96K range.
For any reason, the closing of a daily candle below the invalidation level will break the structure and invalidate this upward correction
For risk management, please don't forget stop loss and capital management
When we reach the first target, save some profit and then change the stop to entry
Comment if you have any questions
Thank You
Btcroadmap

Is it really possible for Bitcoin to reach 1 million dollars?Is it really possible for Bitcoin to reach one million dollars?
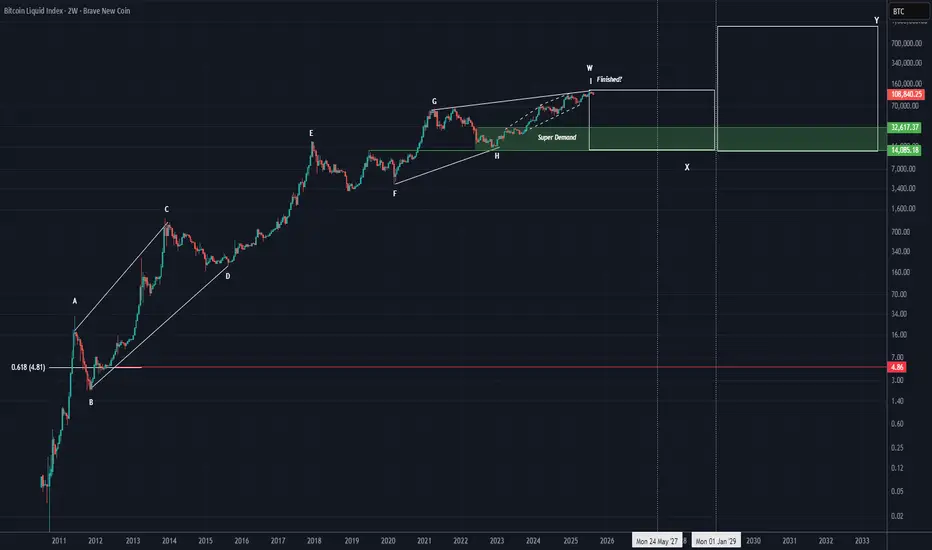
This is the complete Bitcoin data | from when it was $0.01 up to the last all-time high of $125K. Whether we like it or not, a large-degree pattern on Bitcoin is reaching completion, and we are looking at the chart without bias, purely through wave theory.
The symmetrical pattern you see on the chart is on the monthly or 2-week timeframe.
We are currently in the final wave, wave i of W. Wave i of W itself is a diagonal or symmetrical pattern (which we discussed in THIS POST () |this post only concerns branch i of W of this pattern).
When such a large pattern completes, there are two possibilities:
A counter cycle of the same degree begins , or
An X wave forms.
First scenario: forming a new pattern is very unlikely because if it happens, the Fibonacci 0.618 target of this pattern would be reached | around $4–$10 for Bitcoin. If this happens, the entire crypto market would effectively become a scam. This scenario is highly improbable and currently illogical.
Second scenario: the formation of an X wave. It’s worth explaining X waves: X waves connect patterns of the same degree without requiring large time-price corrections relative to the previous pattern, allowing a phase | whether bullish or bearish | to extend. Here, since the first phase is bullish, the pattern after the X wave will also be bullish.
For Bitcoin, if an X wave forms, the best range for it to end is $32K–$14K, and the X wave could last until 2027–2028. The two time lines indicate where the X wave could end.
When a new cycle begins, it is of the same degree as the previous pattern. This means we will have years of bullish phases with corrections, similar to the first phase W, which is represented on the chart from wave A to I.
The target of the second pattern, Y, after the X wave, can realistically reach $1 million! The estimated time frame for reaching this target is 2031–2039, but why the 8-year tolerance? This accounts for the pattern type: if it’s a triangle, these targets could be reached faster, but if it’s another multi-branch pattern, the timing may extend.
From a technical and wave-theory perspective, this is indeed possible. This is our broad 10-year outlook on Bitcoin.
❤️ Stay with us updates will be provided in the future with support and resistance zones plotted on the chart. Do you really think Bitcoin can reach $1 million?
BTC ROAD MAPHey everyone, I've got an exciting BTC roadmap to share with you all. Based on my analysis, Bitcoin is set to experience a bull run from the FWB:17K -$19K range all the way up to a high of FWB:65K -$66K. It's a fantastic opportunity for those looking to invest and make some profit.
However, it's not all smooth sailing. After the bull run, my analysis indicates that there's a big short coming, which will cause the Bitcoin price to drop sharply to $4K-$5K. It's important to be aware of this potential risk and make informed decisions about your investments.
Overall, my BTC roadmap highlights both the risks and rewards of investing in Bitcoin. So make sure to keep an eye out for these trends, do your research, and consult with financial experts before making any investment decisions. STAY TUNED FOR THE JOCKPOT!

BTC ROADMAP BTC has made gain great bullish momentum since we have taken the 58K resistance.
on the BIG crash chart, the last all-time high predicted here 👇🏻
On the Big crash chart, we labeled the Golden zone which starts from 58k to 65118.
securing the golden zone prior to the Bull run is a must.
let's take a look at DXY and see its reaction here on the magnificent UNCLE SAM chart below.
Remaining below R2 on DXY long-term analysis here ☝🏻 can lead to BTC remaining bullish.
Here is a look at BTC dominance 👇🏻
Before ...
After...

BTC ROADMAPpreviously ...
Top-coins that are rising as well:
1.XRP
2.ETH
3.LTC
Thanks to Gold we are here!!
apparently your likes makes me the best lol


BTC RoadmapBTC has been in an uptrend channel since dec 18th when it made a reversal.
on jan 29th it broke to the bullish channel which has been highlighted with the purple dotted line leaving us with two scenarios after a pullback on the 5th of February .
scenario #1 is a correction which will come shortly as we are facing a bearish divergence right below the resistance to the bottom of the green channel highlighted on the chart before retesting the resistance again.
scenario#2 is a breakdown of the green channel which in that case we are in a head and shoulder formation set up with the main support being the 8187 green support zone.
the safe range for alt-coins has been highlighted on the chart as and parabolic behavior will set any alt trades in decline or breaking below the purple dotted channel.
the best recommended Alts for this set up has to be TRX,VET, NEO, XRP ,ADA.
Don't forget to drop your likes, and for more amazing alt trades join our free telegram channel posted in the bio.

BTC ROADMAPBTC is currently trying to break out of a bullish bat for the second time.
At the moment under the Ichi cloud making an attempt to enter the Ichi cloud resistance.
The miner zone is the ultimate support holding BTC from the depression cycle to repeat again. However, the miners are manipulating the market so they don't have to fight the bears in their backyard.
A nice bullish divergence confirming the reversal. Now BTC has to go through the Ichi cloud successfully to find itself at 9/10K zone and bring ETH at 145/150, LTC at 75.
Cheers
