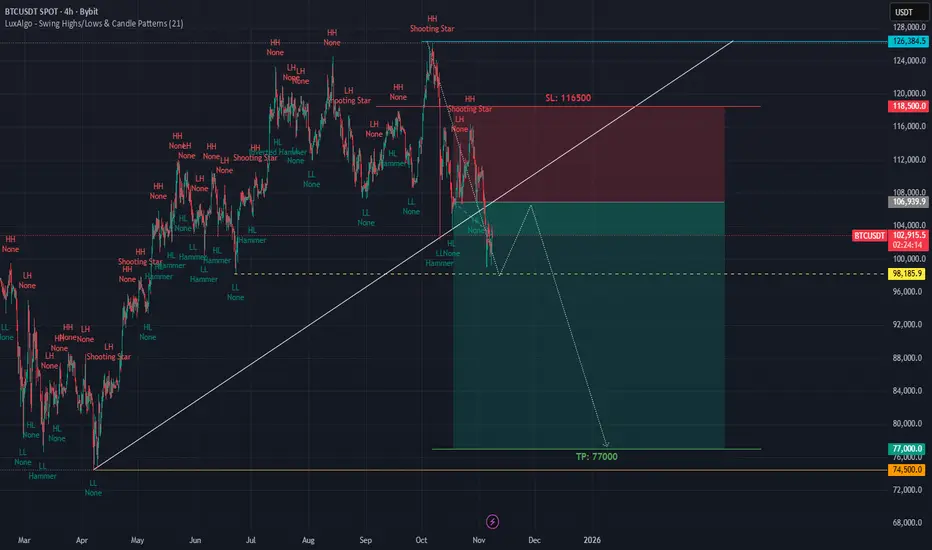
Selling pressure on BTC - 2026Bitcoin (BTC/USD) – End-of-Year Outlook (D1)
As we move toward the end of the year, Bitcoin is showing a clear shift from uptrend to corrective / bearish structure on the daily timeframe.
1. Market Structure
BTC has broken below the rising channel and failed to reclaim it, confirming a loss of bullish control.
Price is now trading below EMA 34 and EMA 89, while EMA 200 remains far above — a classic sign of a medium-term downtrend.
2. Key Resistance Zone
The 95,000–96,000 area (purple zone) is a strong supply / sell zone, aligned with:
Previous support turned resistance
EMA confluence
Any pullback into this zone is likely to attract sellers rather than buyers.
3. Support & Downside Scenarios
First downside target: ~76,700
This is a major demand zone and the 1.618 Fibonacci extension.
If this level breaks:
Price could extend further toward 52,000–53,000, which is a long-term demand area and strong historical support.
4. Year-End Expectation
Without a strong reclaim above 96,000, BTC is more likely to:
Continue sideways to bearish movement, or
Form a bearish pullback before another leg down
Btcsell

BTCUSDT 4H Analysis – Liquidity Sweep & FVG Reaction4-hour BTCUSDT chart highlights a potential bullish setup following a liquidity sweep below SSL and a Change of Character (Choch). Key zones include Buy Side Liquidity (BSL), Sell Side Liquidity (SSL), and a 4H Fair Value Gap (FVG) where price may react. The trade setup shows an entry around 87,810.5, stop-loss near 80,665.8, and take-profit targeting 89,564.9. Price action suggests a possible retracement into the FVG before continuation, with liquidity dynamics and structural shifts guiding the bias.

Bitcoin Technical Outlook | Bearish Scenario in FocusBitcoin is trading inside a clear descending consolidation structure after a strong bearish impulse from the 116k area. Price has repeatedly failed to reclaim the resistance zone 102,600–98,400 and is now compressing inside a bearish triangle showing weak momentum and lower highs. Multiple BOS and CHoCH signals confirm sellers remain in control. The broader structure is still bearish while price stays below the descending trendline and the 95k–100k supply zone. This consolidation suggests a continuation move lower, with downside liquidity resting below the 73k and 69k levels.
🔻 Trade Plan:
Bias: Bearish continuation
- Sell Zone: 92,500 – 95,000 (trendline + structure resistance)
- Sell Confirmation: Rejection / bearish candle inside the triangle or at resistance
- Targets: TP1: 80,500, TP2: 73,800 (strong low), TP3: 69,000 – 66,800 (major liquidity & fib extension)
- Invalidation: Daily close above 100,000 – 102,600
Note
Please risk management in trading is a Key so use your money accordingly. If you like the idea then please like and boost. Thank you and Good Luck!

BTC recovers ahead of interest rate announcementBTC Daily Chart – Short Analysis
Bitcoin is still trading inside a bearish structure, staying below key moving averages and the descending trendline.
Main resistance: $100,000 – $102,000
This zone aligns with the 0.5 Fibonacci level and previous support turned resistance → high probability of rejection.
Current move: Price is bouncing, but no bullish confirmation as long as it stays under $102k.
Expected scenario:
BTC may retest the $100k–$102k zone, fail to break it, and continue downward.
Downside target: $83,700 – $84,000
This level matches liquidity and trendline confluence.
Conclusion:
Trend remains bearish unless BTC breaks and closes above $102k.

BTC pressure and downtrend continueBTC H4 Chart Analysis
Bitcoin on the H4 timeframe is currently showing a corrective pullback after reaching a key resistance zone around 95,500–96,300, which aligns with the descending trendline, previous supply zone, and EMA confluence (200 EMA + 300 EMA). This rejection indicates strong selling pressure and confirms the zone as a major resistance area.
Key Technical Points:
🔹 Strong Rejection at Major Resistance:
Price reacted sharply from the supply zone and failed to break above the descending structure, signaling sellers are still active.
🔹 Break of Short-Term Bullish Structure:
The recent drop has broken the ascending trendline, showing weakness from buyers and a potential shift back to a bearish correction.
🔹 EMA Dynamic Resistance:
Price remains below the 200 EMA (red) and the long-term moving average (white) — suggesting bulls still lack full control and the broader trend remains under pressure.
🔹 Volume Profile Confirmation:
Most liquidity sits below current price levels, hinting the market may revisit demand zones before attempting another move higher.

BTC market on fire, sharp dropBTC Daily Timeframe – Short Summary
BTC is forming a bearish 5-wave Elliott structure:
Wave (3) seems to have bottomed around 94,000.
Price is now expected to make a Wave (4) pullback toward 100,000–101,000 (major resistance).
After that, BTC is likely to drop again in Wave (5) toward the 80,000–82,000 zone (1.618 extension).
Technical signals:
BTC is below all EMAs (34/89/200) → trend still bearish.
200 EMA near 104,800 is strong resistance.
Key supports: 94k, then 80k.
Bias: Bearish while below 104k–105k.

BTC will dump to $7600 follow my structure last month Oct 25BINANCE:BTCUSDT BTC I said on Oct 17, 2025 last month will dump to $7600, now new month in November 2025, look like follow my structure
BTC recovers before interest rate announcementBitcoin (BTC/USD) – Daily Chart Analysis
Bitcoin is currently trading around the 114K–115K zone after rebounding from the ascending support trendline near 108K. This reaction confirms that buyers are still defending the broader bullish structure, but significant resistance lies ahead.
Key Observations:
Resistance Zone (117K–118K):
This area has acted as a strong supply zone in the past, where price was previously rejected twice (marked by red arrows). It also aligns with the EMA 89 and volume cluster, making it a critical barrier for bulls.
Support Zone (108K–102K):
The lower trendline and horizontal support near 102K–104K remain vital for the long-term bullish structure. A break below this region would open the door for deeper correction toward 100K.
EMA Confluence:
The short-term moving averages (EMA 34 and 89) are attempting to turn upward, suggesting early signs of recovery—but confirmation requires a daily close above 118K.
Possible Scenarios:
Bullish Case:
If BTC successfully breaks and closes above 118K, momentum could accelerate toward 127K–128K, where the upper trendline and major resistance coincide.
Bearish Case:
If price faces rejection at the 117K–118K zone, a retest of 108K, or even 102K, is likely before the next major move.
Outlook:
Bitcoin remains in a neutral-to-bullish phase short term, but traders should closely monitor the 117K–118K resistance for potential rejection or breakout confirmation.

BITCOIN - Short before the bullish reversalThe volume profile currently aligns with our identified point of interest (POI), which corresponds to an unfilled Fair Value Gap (FVG) on the Daily timeframe.
Price action has recently swept the previous daily high (PDH), indicating a potential liquidity grab.
Hourly candle closures have shown weakness, failing to demonstrate meaningful displacement to the upside.
Given these conditions, we anticipate a possible sweep of the PDH once again, potentially forming equal lows (EQ lows) just beneath our Daily POI (FVG).
From there, price may initiate a liquidity hunt toward the sell-side, targeting the previous daily low (PDL) and previous weekly low (PWL).
A potential rebound could occur from one of our H4 Bullish Imbalance-Support-Interaction (BISI) zones, which may act as a strong area of demand.

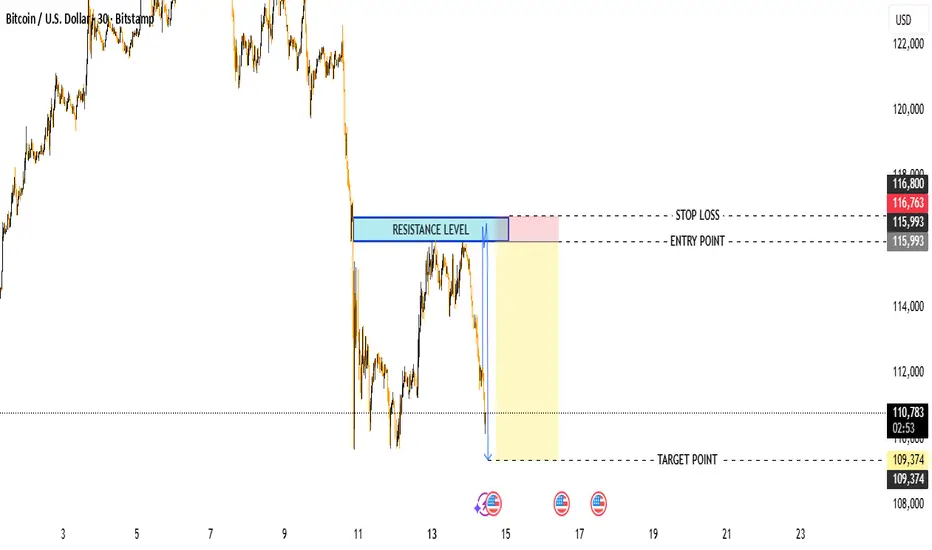
BTC/USD – Resistance Rejection SetupChart Overview
Pair: Bitcoin / U.S. Dollar (BTC/USD)
Timeframe: 30 minutes
Current Price: ≈ 110,706 USD
Resistance Zone: 115,993 – 116,800 USD
Target Point: 109,374 USD
Stop Loss: 116,800 USD
Bias: Bearish
📊 Technical Outlook
Resistance Level:
The highlighted blue zone marks a strong resistance area where BTC has previously rejected multiple times, showing that sellers are active around 116K.
Price Action:
After testing the resistance zone, the price dropped sharply — confirming bearish momentum.
This suggests that the market may continue its downward move as long as it stays below 116,000 USD.
Entry and Target:
Entry Point: around 115,993 USD after a minor pullback or retest.
Target: 109,374 USD, aligning with prior support and measured move projections.
Stop Loss: 116,800 USD to protect against breakout above resistance.
⚖️ Risk/Reward Ratio
Approx. 1 : 3, which is favorable — meaning for every $1 of risk, the potential reward is about $3.
🧠 Summary
Parameter Level (USD) Interpretation
Entry 115,993 Ideal short entry after retest
Stop Loss 116,800 Above resistance zone
Target 109,374 Previous support / projected target
Bias Bearish Sell the rallies below 116K
⚠️ Notes
Watch for bearish confirmation candles (e.g., engulfing or rejection wicks) near resistance before entering.
A break and close above 116,800 will invalidate the short setup.
Momentum favors sellers while below 116K.
BITCOIN (BTC/USD) TECHNICAL ANALYSIS — BEARISH RETEST SETUPPair: Bitcoin (BTC/USD)
Timeframe: 30-Minute
Current Price: 121,200
Trend: Uptrend inside ascending channel, currently showing bearish correction
📊 Chart Analysis
Rising Channel (Pink Zone):
BTC has been trading inside an ascending channel since early October.
The recent movement shows a rejection at the upper boundary, followed by a pullback to the lower boundary of the channel.
Support Level (Blue Zone):
Identified between 126,200 – 127,400, previously acted as resistance, now turned potential support.
Price might retest this zone before confirming the next move.
Bearish Setup:
The projection suggests that price may retest the support, then reverse downwards toward the target zone near 119,800 – 119,700.
Entry Point:
126,238 – 126,254, ideal zone to enter a short position after a pullback.
Stop Loss:
127,435 – 127,446, above the resistance and previous highs — protecting against false breakouts.
Target Point:
119,812 – 119,795, lower channel boundary and next support area.
📈 Expected Price Movement
Current retracement may continue slightly upward to retest the blue resistance zone.
If price fails to break 127,400, a strong bearish rejection is expected.
Target zone sits around 119,800, completing a channel cycle.
✅ Summary
Parameter Level (USD) Notes
Entry 126,238 Short entry near resistance
Stop Loss 127,435 Above resistance
Target 119,812 Next support zone
Bias Bearish Sell on retest
RR Ratio ~3:1 Good short setup

BTC Market Cap – Bearish Channel Reversal Setup (1H Analysis)Chart Context:
The chart shows BTC market cap moving within an ascending parallel channel, with price recently reaching the upper boundary resistance and starting to show signs of weakness.
📊 Key Levels
Entry Point: 2.46T
Stop Loss: 2.49T
Target (LABA TARGET POINT): 2.33T
Current Price: ~2.44T
🔍 Technical Breakdown
Ascending Channel:
The BTC market cap has been trending upward within the blue channel, respecting both upper and lower boundaries.
Rejection at Upper Channel:
The price touched the top boundary near 2.49T and began consolidating — a classic signal for potential downside correction.
Bearish Setup:
The shaded red zone represents a short setup:
Entry near 2.46T (retest of structure resistance).
Stop loss above channel top (2.49T).
Target towards 2.33T (lower channel / support zone).
Risk–Reward Ratio:
Estimated around 1:4, making it a favorable short setup if confirmation (e.g., bearish candle or structure break) appears.
Volume & Momentum:
Momentum seems to be slowing; lower highs and flattening volume often precede corrective moves in such setups.
🧭 Conclusion
Bias: Bearish (short-term correction expected)
Trade Plan:
Wait for a small retracement or retest near 2.46T before entry.
Stop loss: above 2.49T.
Target: 2.33T (LABA zone).
Invalidation: A breakout above 2.49T would invalidate this short setup and could push BTC market cap toward 2.52T+.

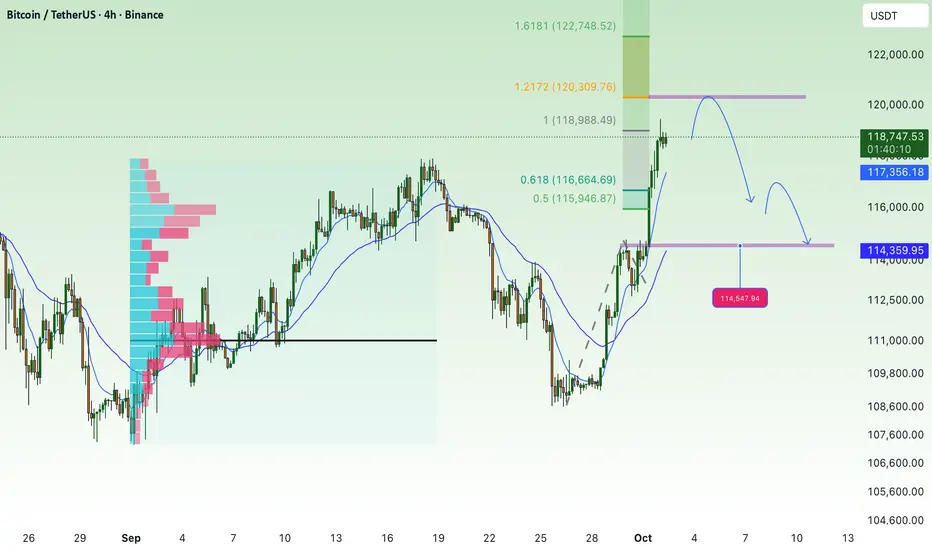
Be careful with the continued downward correction.BTC Plan Analysis
Currently, BTC has rallied strongly toward the 118,700 – 118,800 zone and is testing the 1.0 Fibonacci resistance. This area may trigger short-term profit-taking.
Main outlook: After a sharp rally, the market is likely to see a corrective move.
Key Levels
Resistance:
118,800 – 119,000 (near-term resistance, currently being tested)
120,428 (strong resistance on the higher timeframe)
122,500 (major resistance, extended wave target)
Support:
116,485 (Fibo 0.786, important confluence support)
114,837 (previous resistance turned support + EMA200)
114,150 – 114,050 (lower support, Fibo 0.236)
Possible Scenarios
BTC may face selling pressure at 118,800 – 119,000, leading to a correction back to 116,500.
If 116,500 breaks, the next support zone is 114,800 – 114,000.
If BTC holds above 116,500 and bounces, the market will likely retest the higher resistance at 120,400 – 122,500.
👉 Summary: Price is currently at short-term resistance. It’s better to wait for a reaction before making decisions. The correction toward 116.5K remains the primary scenario before the next clear move.
BTC Accumulates in Downtrend - CorrectionBTC Analysis
BTC is currently moving in line with the broader trend structure. After a strong bearish leg, the price reacted precisely at the 108k demand zone, rebounding sharply by around +4,000 points. This confirms that buyers are still actively defending this critical level.
At present, BTC is trading near 112k, with the next resistance levels to watch at 113,925 – 116,132. A short-term bullish continuation into these zones is possible, but strong selling pressure is expected there.
If the price fails to hold above the 113k – 114k area, a pullback toward the 109k demand zone could follow. A deeper bearish continuation would then likely target 106k – 106.2k, which aligns with the next key Fibonacci extension and a major support area.
Key Notes:
• The broader trend remains intact; buyers successfully defended 108k.
• Watch resistance at 113.9k – 116.1k for potential reversal signals.
• Key support zones: 109k (demand) and 106k (major target).

BTC continues selling pressure, correctionBTC Analysis
1. Trend Structure:
BTC has broken down from its ascending channel after failing to hold above the 115,000 zone, signaling that bearish momentum is in control.
2. Key Resistance Levels:
• 113,925 and 116,132 remain strong resistance zones where sellers are likely to defend.
• Price action is currently trading below major moving averages, further supporting the bearish outlook.
3. Support & Downside Targets:
• Immediate support lies at 111,722 (Fibo 1.618).
• If selling continues, the next downside levels are 108,937 and 106,298.
4. Expectation:
A short-term bounce toward 113,900 – 114,000 is possible, but the broader structure favors further downside, with likely moves toward 109,000 – 106,000.
⸻
✅ Conclusion:
BTC remains in a bearish phase after the channel breakdown. Unless buyers reclaim 116,000+, selling pressure is expected to dominate.

UPDATES ON BITCOIN.As previously stated, Bitcoin is respecting structure and direction based on previous analysis, which suggests sellers are still in control, but in the short term, as we are headed further downwards, keep watching! {Not Financial Advice, trade responsibly}

Is BTC affected by SELL the news?Analysis of BTC:
BTC is fluctuating around the 114k – 115k range, which is an important equilibrium zone. If buying pressure holds strong, the price could move toward the 118k resistance area – a key level that will determine the upcoming trend.
• Scenario 1: If BTC successfully breaks above 118k, the uptrend will be reinforced, with the next target at 123k – 124k.
• Scenario 2: If rejected at 118k, the price will likely retest 112k – 110k before recovering.
Summary: The overall trend still leans bullish, but 118k is the crucial resistance zone to watch closely in order to confirm the next direction.

Who's ready to lose money (again) on BTC?The ups and downs are becoming just to obvious at this point. BTC struggling to make substantial progress on the price moves now that major whales have moved on due to buying at the TOP. What could go wrong? Diminishing YoY returns, high transaction cost, doesn't solve any real problems, and ultra high volatility. Historically, we are due very soon for a major correction and BTC will very likely come down substantially (next support levels before 100k is around 70k). Not anti-tech or BTC! Just calling out technicals, fundamentals, and historical behavior with tulip-type of hype and have seen many many people lose money from BTC and digital assets (remember NFTs, FTX, Trump's coin that was rugged etc...). Proceed with caution, if you're up on BTC, just sell and park for a breather. There is no escaping macro trends and a big one is coming. We are not at levels not seen since the dot.com bubble, and this one will be harder.

BTC Accumulates and Recovers, Rate Cut Near💎 BTC PLAN UPDATE – Early Week (09/08 )
BTC Analysis (D1 timeframe)
Main trend:
BTC is in a recovery phase after breaking out of the downtrend channel (blue).
Currently, the price is hovering around 112K–113K, approaching a key resistance zone.
Key levels:
• Near resistance: 113,590 – 114,124 (confluence of Fib 0.382 and EMA 34).
• Stronger resistance: 116,150 – 117,600.
• Near support: 111,200 (Fib 0.5) and the rising trendline.
• Deeper support: 108,400 – 104,800 (previous lows + Fib 0.618–0.786).
Possible scenarios:
• Scenario 1 (preferred): Price tests resistance at 113,590 → pulls back to 111K–110K → then bounces upward again.
• Scenario 2: If strong buying pushes through 113,590 and holds above 114K, the next target will be 116K–117K.
Overall outlook:
The short-term trend is leaning towards recovery.
However, the 113K–114K resistance zone will determine whether BTC continues higher toward 116K–117K, or drops back to retest supports below 111K.
👉 In summary: BTC is recovering, but 113K–114K is the key zone. A successful breakout could open the way to 116K–117K. A rejection could bring price back to test 111K or even deeper at 108K.

Bitcoin on the road to ZEROCycles and HSI (week 97 today) work alone says CRYPTOCAP:BTC has topped for this cycle and is set to lose at minimum 80%. There is always a clear 5 up, 3 down wave count for BTC and it has completed now. All the massive ETF and Ponzi Treasury Buys couldn't even muster up BTC price to $150k. Its totally cooked.. In my view, its going much lower since the absolute inherent value of all crypto is ZERO. No major central bank will touch it and wants to kill it as BTC presents a threat to the member banks. Come on guys, 2.1 TRILLION UNITS of something makes it rare and scarce. The GENIUS act was the final nail in the coffin for crypto. They will kill it for good soon. The whole coinmarketcap will deflate in the 2026-2031 Greatest Depression. Nobody will have any money and everything will be sold off. The pain will be intolerable for many. Jobs are going away (not because of AI) and crypto will be the last thing people need to survive. This was the final hurrah for Bitcoin. A symbol of the massive speculative excess liquity will be drained in short order shortly...

BTC adjusts down, market suspects interest rate cut💎 BTC PLAN UPDATE – Early Week (08 / 25 )
🔎 BTC Analysis
After retesting the 117k resistance zone (117,566 USD), the price reacted with a sharp drop. This indicates that the selling pressure in this area remains very strong.
Currently, the price is falling near the EMA200 (red line ~111,664) – which is a key short-term support level.
📌 Key Reaction Zones
111k – 110k:
This is the confluence of EMA200 + Fib 0.5.
If the price holds, there’s potential for a rebound back to 113k–115k.
109k – 108k:
Next strong support.
If 111k breaks, this zone will be the next critical reaction point.
105k – 104k:
Major long-term support (confluence of Fib extension + old demand zone).
In a bearish scenario, the price could test this zone before bouncing back up.
🌐 Market Sentiment & Expectations
After BTC was rejected at 117k, market sentiment has turned cautious and somewhat bearish in the short term.
However, many traders still expect BTC to hold above the EMA200 to trigger a rebound → if this level holds, sentiment may shift back to bullish, targeting 115k–117k again.
On the contrary, if the price breaks deep below 110k, the market may enter short-term panic and shift focus toward the strong support at 104k.

Will a Fed Rate Cut Cause Bitcoin to Fall? A Look at the Market'As September approaches, the financial world is on high alert for the next Federal Reserve meeting. After a period of high inflation, the Fed has been holding interest rates steady, but recent comments from Fed Chair Jerome Powell have raised expectations for a rate cut. While many might think a rate cut is great news for risky assets like Bitcoin, the reality is more complex. The market's reaction could be a classic case of "buy the rumor, sell the news."
The "Buy the Rumor, Sell the News" Effect
For months, traders have been speculating that the Fed would eventually cut rates. This anticipation has already been a major factor in the recent rally of Bitcoin and other cryptocurrencies. When investors believe that borrowing money is about to get cheaper, they are more willing to move their money out of safe investments, like government bonds, and into riskier assets that have the potential for bigger gains. This is a key reason why Bitcoin has been performing well.
However, this is where the risk lies. The market has likely already "priced in" a September rate cut. This means that the current high price of Bitcoin already reflects the expectation of this event. When the Fed actually announces the cut, there may not be a new reason for the price to go up. In fact, many traders who bought in anticipation of the news might decide to sell their holdings to lock in their profits, causing a short-term drop in price. This is a common pattern in all financial markets.
Looking at the Broader Picture
While a rate cut is generally seen as a positive for Bitcoin in the long run, the short-term impact is not guaranteed to be a straight shot up. The Fed's decision is just one piece of the puzzle. Other factors that could influence Bitcoin's price include:
Inflation: The Fed's main job is to control inflation. If inflation remains stubbornly high, the Fed might signal that this is the only rate cut for a while, which could dampen market enthusiasm.
Economic Outlook: If the Fed cuts rates because the economy is showing signs of weakness, investors might pull back from all risky assets, including Bitcoin, out of fear of a recession.
Regulatory News: Any new regulations or statements from governments about cryptocurrencies could also cause a significant market reaction, regardless of what the Fed does.
⬇️ Sell now or sell on 115669.0
⭕️SL @ 116080.0
🔵TP1 @ 113449.0
🔵TP2 @ 111600.0
Risk Warning
Trading Forex, CFDs, Crypto, Futures, and Stocks involve a risk of loss. Please consider carefully if such trading is appropriate for you. Past performance is not indicative of future results.
Conclusion: Caution is Key
For traders and investors, the key takeaway is to approach the upcoming Fed meeting with a healthy dose of caution. While a rate cut is widely expected, it's not a guaranteed path to higher prices. The smart move is to understand the different scenarios and not to get caught up in the hype. Bitcoin's price has already been influenced by the rumors of a rate cut. The actual announcement could very well lead to a period of volatility and even a temporary pullback as traders take profits.
If you liked our ideas, please support us with your likes 👍 and comments.

BTC Accumulates and Adjusts Slightly💎 BTC WEEKEND PLAN UPDATE (15/08)
BTC Analysis After PPI
Trading Highlights
After the PPI release, BTC completed its bullish wave and reached a peak of 123.2K, exactly at the 2.618 Fibonacci Extension level – a strong resistance zone that had been anticipated.
Afterward, the price sharply reversed, dropping to the 117K support area – aligning with the main uptrend line and the 0.236 Fibonacci retracement of the most recent bullish wave → this was where we successfully executed a bottom-picking buy.
Current Price Action
The price is now recovering from 117K toward the 120.7K – 121K resistance area (a confluence of the 0.618 Fibonacci retracement, a previous supply zone, and the H4 EMA).
The short-term trend remains a technical rebound after a sharp drop, with no confirmed sustained bullish reversal yet.
Scenarios & Next Trend
• Main Scenario: Price rebounds to 120.7K – 121K → faces selling pressure → sharply reverses downward following a corrective wave toward 116K – 115K (strong support).
• Alternative Scenario: If 121K is broken with high volume, BTC could revisit the 122.9K – 123.2K zone.
Key Levels
• Resistance: 120.7K – 121K / 122.9K – 123.2K
• Support: 117K / 116K – 115K”
