Bitcoin Christmas Rally? $90K/More in SightBitcoin ( BINANCE:BTCUSDT ), as I previously expected , has risen to its initial target and has broken above the important level of $88,200, which is a positive sign for continued bullish momentum.
At the moment, Bitcoin is striving to break through the resistance zone($89,230-$87,720).
From an Elliott Wave perspective, it seems that Bitcoin is completing microwave B of the main wave Y.
I expect that after breaking the resistance zone($89,230-$87,720), Bitcoin could rise at least up to the significant level of $90,300, approaching the Cumulative Short Liquidation Leverage and the 50_SMA(Daily). If BTC breaks above the 50_SMA(Daily), we can anticipate even further gains for Bitcoin.
The question is: do you think Bitcoin will hold above $90,000, or will it begin to decline again?
And finally, a little note about Christmas: I hope you enjoy a wonderful holiday season with your loved ones, and let’s see how Bitcoin performs as we head into the new year!
Cumulative Long Liquidation Leverage: $86,690-$85,990
First Target: $90,161
Second Target: $90,721
Third Target: 50_SMA(Daily)
Stop Loss(SL): $86,850
Points may shift as the market evolves
💡 Please respect each other's opinions and express agreement or disagreement politely.
📌Bitcoin Analysis (BTCUSDT), 1-hour time frame.
🛑 Always set a Stop Loss(SL) for every position you open.
✅ This is just my idea; I’d love to see your thoughts too!
🔥 If you find it helpful, please BOOST this post and share it with your friends.
Btcsignal

Bitcoin Tries to break Key Resistance—New Weekly Rally Starting?Bitcoin ( BINANCE:BTCUSDT ), exactly as expected in my previous idea , started to decline from the resistance zone($89,230-$87,720) and successfully reached its downside target.
Currently, despite the low trading volume during the weekend, Bitcoin appears to have broken above the resistance lines and is now actively attempting to confirm a breakout above the key resistance zone($89,230-$87,720).
From an Elliott Wave perspective, Bitcoin seems to have completed the main wave B within the support zone($85,400-$83,900). The structure of this main wave B appears to be an Expanding Flat(ABC/3-3-5), which aligns well with the current price behavior.
Considering Bitcoin’s strong correlation with the S&P 500 index ( SP:SPX ), and given that my outlook on the S&P 500 index remains bullish , the probability of another upward move in Bitcoin increases as we approach the start of the new trading week.
Based on this confluence, I expect Bitcoin to successfully break above the resistance zone($89,230-$87,720) and potentially move higher toward the $90,217 level as a minimum upside target.
Cumulative Long Liquidation Leverage: $86,800-$85,580
Cumulative Long Liquidation Leverage: $84,400-$82,900
Cumulative Short Liquidation Leverage: $91,870-$90,700
Cumulative Short Liquidation Leverage: $98,400-$97,000
First Target: $90,217
Second Target: $91,177
Third Target: 50_SMA(Daily)
Stop Loss(SL): $85,517Worst)
Points may shift as the market evolves
What is your view on Bitcoin at this stage?
Do you think Bitcoin can sustain a move above $90,000, or will it face rejection again?
💡 Please respect each other's opinions and express agreement or disagreement politely.
📌Bitcoin Analysis (BTCUSDT), 4-hour time frame.
🛑 Always set a Stop Loss(SL) for every position you open.
✅ This is just my idea; I’d love to see your thoughts too!
🔥 If you find it helpful, please BOOST this post and share it with your friends.

Bitcoin at Critical Resistance — Bull Trap!?Over the past couple of hours, Bitcoin ( BINANCE:BTCUSDT ) has surprised many traders—including myself—with its sharp movements. The potential reason behind this could be an anticipated interest rate cut tomorrow. However, the recent JOLTS Job Openings did not fully align with that expectation.
With our technical analysis tools, we can delve deeper into Bitcoin’s next moves. The key question is whether Bitcoin will maintain its recent bullish momentum or if a reversal is imminent.
It’s important to note that in the next 24 to 48 hours, we may see increased volatility in the financial markets, particularly in crypto. Therefore, it’s wise to practice good risk management—or even consider staying on the sidelines until the market settles.
At the moment, Bitcoin has managed to break through resistance lines, but the volume of this breakout hasn’t been particularly high. Bitcoin is also near a resistance zone($94,850-$93,000), monthly pivot points, and significant levels of Cumulative Short Liquidation Leverage($98,260-$94,600), all of which add to the complexity.
High sell orders: $96,000-$94,800
From a classical technical standpoint, there’s potential for a bearish flag pattern forming. As long as Bitcoin remains below $100,000, this scenario remains plausible.
From an Elliott Wave perspective, it seems that the main Wave B has completed, and we’re likely looking at a ZigZag correction(ABC/5-3-5). This correction might complete either at the resistance zone($94,850-$93,000) or near the daily 50_SMA(Daily).
Considering that the S&P 500 index ( SP:SPX ) is also showing a bearish trend, it’s more likely that Bitcoin’s main corrective Wave C will complete within these resistance levels.
Also, the USDT.D% ( CRYPTOCAP:USDT.D ) remains a crucial factor. Until it hits around 5.49%, the overall crypto market is likely to remain bearish.
In conclusion, I expect that Bitcoin will continue its downward movement, potentially testing $89,000 and even dropping below $85,000. This could represent a significant bearish phase for Bitcoin.
What are your thoughts? Do you think Bitcoin will maintain this bullish momentum, or are we headed for more downside?
Cumulative Long Liquidation Leverage: $89,430-$88,750
Cumulative Long Liquidation Leverage: $83,900-$82,400
First Target: $90,300
Second Target: $87,503
Stop Loss(SL): $100,020(Worst)
Points may shift as the market evolves
💡 Please respect each other's opinions and express agreement or disagreement politely.
📌Bitcoin Analysis (BTCUSDT), 4-hour time frame.
🛑 Always set a Stop Loss(SL) for every position you open.
✅ This is just my idea; I’d love to see your thoughts too!
🔥 If you find it helpful, please BOOST this post and share it with your friends.

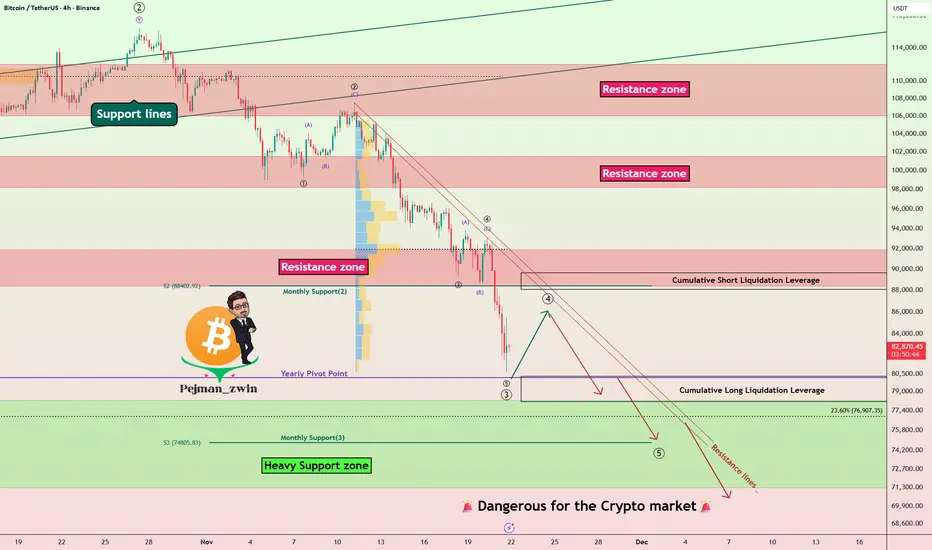
BTC Isn’t Bottoming — It’s Bargaining: Why 75k Still Makes SenseAs I mentioned in my previous analysis, the idea that “BTC has bottomed” simply doesn’t convince me.
And let’s be honest: when a true bottom forms, you won’t see every account on social media announcing it. Markets don’t work that way — especially crypto, where optimism is often weaponized.
From a structural perspective, the entire rise from the 80k zone looks like a textbook corrective move. Yes, we had a perfectly normal rebound into the 94k area, but everything that followed has been classic corrective behavior:
- Mostly ranging price action
- Repeated spikes into 95k that were quickly sold
- Clear overlapping structure
- A bearish flag, which statistically favors continuation lower
If we also consider the four-month distribution phase between 110k–120k, it becomes even harder to justify a bullish reversal narrative. Distribution of that scale rarely resolves into instant trend reversals — instead, it usually marks the beginning of a deeper cycle shift.
So from a psychological standpoint, the crowd is still bargaining — trying to convince themselves the trend is intact, even though the structure keeps printing lower-probability bullish outcomes. That cognitive dissonance is exactly what fuels bear markets.
My view remains unchanged: 75k remains the primary downside target.
And for me, nothing changes unless BTC manages to stabilize above 100k — not just wicks above, but hold with clear buying interest.
Until that happens, selling rallies is the only rational play.

Bitcoin Pumps +10% — Bull Trap or Trend Reversal?Bitcoin( BINANCE:BTCUSDT ) has experienced over a +10% increase in the past two days, which came as a surprise to many analysts considering the previous bearish momentum. In other words, Bitcoin is on something of a roller coaster lately😂.
The question now is whether Bitcoin has started a new bullish trend or if it’s likely to see another decline.
Let’s dive into the 4-hour chart of Bitcoin. Currently, Bitcoin is approaching a resistance zone($94,850-$93,000), a Cumulative Short Liquidation Leverage($94,710-$94,063), and the monthly pivot point. This cluster of resistances, combined with the recent upward momentum, might make it challenging for Bitcoin to break through.
It’s also worth noting that the trading volume during this recent rally hasn’t been particularly high, so Bitcoin could still surprise us. This recent behavior shows that Bitcoin can move sharply both up and down, so it’s crucial to maintain proper risk management.
From an Elliott Wave perspective, considering Bitcoin’s recent decline, I initially expected that Bitcoin might at least test the low of its main wave 3 again. However, the recent rebound suggests that the main wave 5 may be truncated, and the corrective waves could still push Bitcoin lower, potentially even below $75,000.
From a classical technical analysis perspective, Bitcoin might be forming a bearish flag pattern, with the ascending channel acting as the flag’s pole.
In addition, the USDT.D%( CRYPTOCAP:USDT.D ) is still on an upward trend, which indicates that the cryptocurrency market might still face downward pressure.
Moreover, geopolitical tensions, such as those between the U.S. and Venezuela, could also act as a trigger for further Bitcoin declines if they escalate.
Lastly, the S&P 500 index( SP:SPX ), despite its recent bullish trend, doesn’t show the same positive correlation with Bitcoin. In fact, a decline in the S&P 500 could amplify Bitcoin’s downward movement.
Considering all these factors, I expect Bitcoin to continue its bearish trend and potentially test the heavy support zone. If these support levels break, we could see even more significant declines in the crypto market.
Based on the above explanation, I expect Bitcoin to have at least a correction to the targets I specified on the chart, and then depending on the momentum, we can expect a continuation of the decline or a resurgence.
Note: In general, with the opening of the US markets, financial market movements have become more intense these days than before, and it is better to be prepared for any scenario at that time.
What do you think? Do you believe Bitcoin will dip below $75,000, or will it bounce back?
Cumulative Short Liquidation Leverage: $98,591-$96,688
Cumulative Long Liquidation Leverage: $91,860-$90,960
Stop Loss(SL): $96,200
Points may shift as the market evolves
💡 Please respect each other's opinions and express agreement or disagreement politely.
📌Bitcoin Analysis (BTCUSDT), 4-hour time frame.
🛑 Always set a Stop Loss(SL) for every position you open.
✅ This is just my idea; I’d love to see your thoughts too!
🔥 If you find it helpful, please BOOST this post and share it with your friends.

Bitcoin: Final Pump Before the Fall?Over the past five to six days, Bitcoin ( BINANCE:BTCUSDT ) has been attempting to recover from previous weekly declines, and it still appears to be in a corrective phase. This analysis builds on my previous idea, and if you’d like a deeper look at Bitcoin’s mid-term chart, you can check out the 4-hour timeframe in that previous analysis .
Now, a key point for Bitcoin traders is that, despite the recent rally in the S&P 500 ( SP:SPX ) over the past few days, Bitcoin hasn’t been able to keep pace. While it had a good correlation with the S&P 500 in the past, it didn’t experience a similar upward movement this time. Therefore, once the S&P 500 corrects, we may also see Bitcoin resume its downward trend.
Currently, Bitcoin seems to be near a resistance zone($92,200-$88,400) and Cumulative Short Liquidation Leverage($91,570-$89,660). It also appears to be forming an ascending channel over the past few days, indicating a corrective structure.
From an Elliott Wave perspective, Bitcoin seems to be completing microwave C of the microwave Y of the main wave 4, and we can expect this corrective phase to end soon, leading to another downward move. A break of the lower line of the ascending channel would confirm the end of this Wave 4.
I expect that after the Cumulative Short Liquidation Leverage($91,570-$89,660), Bitcoin will resume its decline and move towards the Support zone($86,200-$85,130).
Cumulative Long Liquidation Leverage: $86,000-$85,000
Cumulative Long Liquidation Leverage: $83,249-$81,840
Cumulative Long Liquidation Leverage: $80,263-$78,131
First Target: $86,290
Second Target: $83,800
Stop Loss(SL): $92,229
Points may shift as the market evolves
Note: At lower price levels, Bitcoin’s price includes several Cumulative Short Liquidation Leverages, each potentially causing further price drops. However, if the S&P 500 starts another correction, these levels may break more easily.
Note: Overall, trading in crypto has become a bit challenging lately, with less volatility, so it’s wise to be cautious and manage your capital carefully.
Note: If Bitcoin breaks through the resistance zone($92,200-$88,400) around $92,229, we can expect a renewed upward trend and hope for a bullish movement.
💡 Please respect each other's opinions and express agreement or disagreement politely.
📌Bitcoin Analysis (BTCUSDT), 1-hour time frame.
🛑 Always set a Stop Loss(SL) for every position you open.
✅ This is just my idea; I’d love to see your thoughts too!
🔥 If you find it helpful, please BOOST this post and share it with your friends.

Bitcoin Hits Heavy Support Zone — Is the Next Big Crash Coming?Recently, Bitcoin ( BINANCE:BTCUSDT ) experienced another decline of over -10%, largely due to the sudden drop in the S&P 500( SP:SPX ). As I mentioned in previous ideas, in recent weeks, Bitcoin and the crypto market, especially Bitcoin, have shown a strong correlation with U.S. indices, particularly the S&P 500. This means that even technically sound analyses for Bitcoin can fail if we don’t consider these external factors, which is quite normal. Therefore, it’s crucial to incorporate all parameters—news, fundamentals, on-chain data, and relevant indices—to get an accurate Bitcoin analysis. This complexity can make things a bit challenging.
Over the past ten days, Bitcoin has swiftly broken through several support levels. Many factors have contributed to Bitcoin’s decline recently, but it’s now approaching a heavy support zone($78,300-$71,280). This zone is crucial because if Bitcoin loses it, we could see even larger declines, affecting altcoins as well. Altcoins, in general, haven’t matched Bitcoin’s gains in recent months, so a significant drop in Bitcoin could lead to severe losses for them. It’s essential to manage your investments carefully and stay alert.
From an Elliott Wave perspective, the recent decline suggests that Bitcoin might be in the midst of a five-wave downward, which isn’t positive news. There’s a chance that the heavy support zone($78,300-$71,280) might be breached. However, considering that weekends typically have lower trading volumes, it’s less likely that the support will break in the next couple of days. Still, we must remain vigilant and prepared for any scenario.
In terms of Elliott Waves, it seems Bitcoin has completed its main wave 3, and we might be looking at the completion of the wave 4 over the weekend, with another push towards the heavy support zone($78,300-$71,280) at the start of next week.
Also, the USDT.D% ( CRYPTOCAP:USDT.D ) chart looks bullish, which could not be good news for Bitcoin.
I expect that after a brief rebound, Bitcoin will resume its decline and test the heavy support zone($78,300-$71,280) again.
Cumulative Short Liquidation Leverage: $89,642-$88,079
Cumulative Long Liquidation Leverage: $80,263-$78,131
First Target: $78,523
Second Target: $75,123
Stop Loss(SL): $92,123(Worst)
Points may shift as the market evolves
Note: The S&P 500 also might face downward pressure in the coming days, which could further impact Bitcoin’s support levels. It’s essential to manage your investments carefully and wait for strong reversal signals in higher timeframes. You might miss out on some short-term gains, but it will allow for more confident entries later on.
Note: Tensions between the U.S. and Venezuela are escalating day by day. Should these tensions intensify to the point of direct confrontation, it could act as a trigger for another Bitcoin decline. It’s important to keep this in mind.
Note: Additionally, there have been some suspicious transfers involving the Mt. Gox exchange recently. It’s worth monitoring these developments closely.
💡 Please respect each other's opinions and express agreement or disagreement politely.
📌Bitcoin Analysis (BTCUSDT), 4-hour time frame.
🛑 Always set a Stop Loss(SL) for every position you open.
✅ This is just my idea; I’d love to see your thoughts too!
🔥 If you find it helpful, please BOOST this post and share it with your friends.
Bitcoin Roadmap => Short-termOver the past few days, Bitcoin ( BINANCE:BTCUSDT ) has been reacting quite sharply to recent news, showing some unexpectedly strong moves. So, first and foremost, it's a good idea to keep risk management in mind and be prepared for various scenarios .
At the moment, Bitcoin is approaching a Support zone($102,000,980-$96,880) , a Potential Reversal Zone (PRZ) , and a Cumulative Long Liquidation Leverage($99,900-$98,188) .
From an Elliott Wave standpoint, it appears that Bitcoin is completing a Zigzag correction(ABC/5-3-5) .
I expect that from this Potential Reversal Zone (PRZ) and the Cumulative Long Liquidation Leverage($99,900-$98,188) , Bitcoin might start rising again and could potentially reach around $105,171(First Target) .
Second Target: $107,291
Stop Loss(SL): $98,797
Cumulative Short Liquidation Leverage: $108,582-$106,850
Cumulative Short Liquidation Leverage: $112,590-$111,459
Please respect each other's ideas and express them politely if you agree or disagree.
Bitcoin Analysis (BTCUSDT), 1-hour time frame.
Be sure to follow the updated ideas.
Do not forget to put a Stop loss for your positions (For every position you want to open).
Please follow your strategy and updates; this is just my Idea, and I will gladly see your ideas in this post.
Please do not forget the ✅' like '✅ button 🙏😊 & Share it with your friends; thanks, and Trade safe.

BTC Sell/Short Setup (1H)Bitcoin appears to be forming a bearish triangle, which is considered a continuation pattern in this timeframe.
We have identified two potential entry zones for a sell/short position.
We are looking to enter within these two areas.
The invalidation level serves as our stop; if it’s hit, this setup will be invalidated.
Targets are marked on the chart.
For risk management, please don't forget stop loss and capital management
When we reach the first target, save some profit and then change the stop to entry
Comment if you have any questions
Thank You

Big Catalysts Behind Bitcoin’s Pump – Can BTC Hit $110K?Bitcoin ( BINANCE:BTCUSDT ) started pumping yesterday as I expected in my previous idea . Let's take a look at the fundamental reasons for Bitcoin .
Why the sudden BTC pump? Here are the 3 BIG catalysts hitting at once:
1-US Government Shutdown officially ending tomorrow (Nov 12)
Senate finally reached a budget deal. Treasury General Account (TGA) will start draining → hundreds of billions in fresh liquidity flooding markets. Same thing that ignited the 2020-2021 bull run.
2-Trump’s “Tariff Dividend”
President promised every American adult at least $2,000 from tariff revenue (potentially $400B+ total). Last time we got $1,200 stimulus checks, BTC went from $7K → $69K. Do the math.
3-Short squeeze + ETF flow reversal
Despite last week’s $1.22B ETF outflows, today we’re seeing fresh bids stacking. Bears who shorted the dip are now fuel for the rocket.
------------------------------------------------------------------------------
Let's take a look at Bitcoin’s technical analysis on the 1-hour timeframe .
Right now, Bitcoin is trading around a Resistance zone($107,600,980-$106,100) , and it looks like it might be forming a potential ascending channel , though the second top of that channel isn’t confirmed yet.
My expectation is that after a brief pullback to the Support zone($104,840-$103,600) —where there’s also Cumulative Long Liquidation Leverage($105,311-$104,111) —Bitcoin could start rising again and attempt to break through the Resistance lines. If BTC manages to break above those Resistance lines, then the next target could be around $110,000 .
Cumulative Long Liquidation Leverage: $99,865-$98,168
Cumulative Short Liquidation Leverage: $112,590-$111,459
New CME Gap: $104,565-$104,160
So what do you think? Can Bitcoin push up to $110,000, or will it turn back down again?
Note: These days, the market can be pretty volatile and unpredictable, so always remember to manage your risk and stick to your risk management strategy.
Please respect each other's ideas and express them politely if you agree or disagree.
Bitcoin Analysis (BTCUSDT), 1-hour time frame.
Be sure to follow the updated ideas.
Do not forget to put a Stop loss for your positions (For every position you want to open).
Please follow your strategy and updates; this is just my Idea, and I will gladly see your ideas in this post.
Please do not forget the ✅' like '✅ button 🙏😊 & Share it with your friends; thanks, and Trade safe.

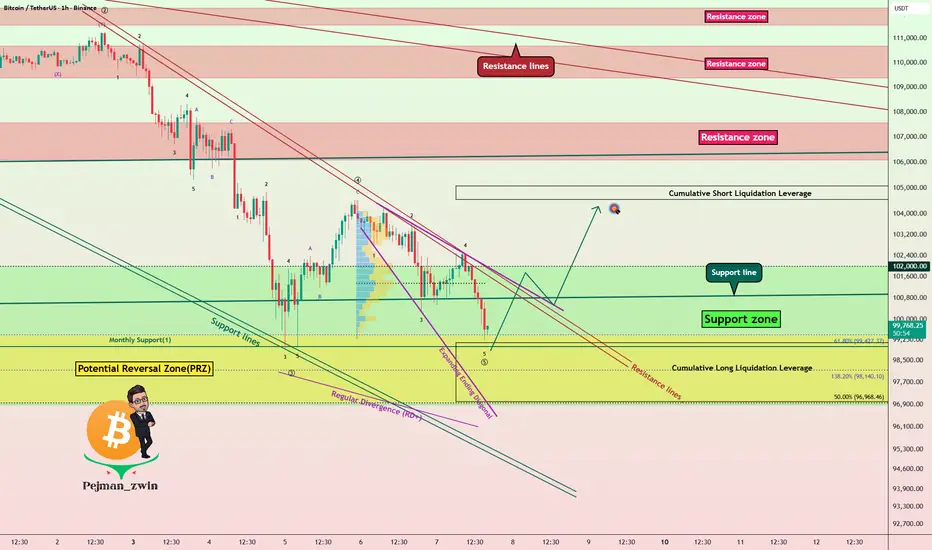
Bitcoin Bulls Defending $97K – Reversal Loading!Before diving into the Bitcoin analysis , it’s worth noting that Bitcoin has had a strong correlation with the SPX500 index ( SP:SPX ) in recent weeks. So, alongside analyzing Bitcoin, it’s a good idea to keep an eye on the SPX500 chart these days.
Currently, Bitcoin( BINANCE:BTCUSDT ) is moving in a Support zone($10200,980-$96,880) near a Potential Reversal Zone(PRZ) and a Cumulative Long Liquidation Leverage($99,145-$97,208) .
From an Elliott Wave perspective, it looks like Bitcoin is forming an Expanding Ending Diagonal to complete the microwave 5 of the main wave 5 .
Also, we can see a Regular Divergence(RD+) , which is a good sign of a potential reversal.
Given my expectation that the SPX500 Index will start to rise again, I also expect that Bitcoin will follow suit and could climb at least to around $104,200 .
Cumulative Short Liquidation Leverage: $105,074-$104,551
Stop Loss: $96,178
Please respect each other's ideas and express them politely if you agree or disagree.
Bitcoin Analysis (BTCUSDT), 1-hour time frame.
Be sure to follow the updated ideas.
Do not forget to put a Stop loss for your positions (For every position you want to open).
Please follow your strategy and updates; this is just my Idea, and I will gladly see your ideas in this post.
Bitcoin At Make-or-Break Zone – Long Setup Ahead?Bitcoin ( BINANCE:BTCUSDT ) is currently moving near a Heavy Support zone($111,980-$105,820) , Support lines , Potential Reversal Zone(PRZ) , and Cumulative Long Liquidation Leverage($106,432-$104,513) .
From an Elliott Wave perspective , it seems that Bitcoin might be completing the microwave 5 of the main wave C .
As long as Bitcoin does not break below that Heavy Support zone($111,980-$105,820) , we can still be hopeful about long positions . There's a chance of a fake break of the support lines, and then Bitcoin might bounce back from the PRZ and start rising again.
I expect that after touching the PRZ , Bitcoin could rise back up and move toward the Resistance zone($110,700-$109,380) .
Note: If the support lines break with high momentum, please do not enter a long position.
Cumulative Short Liquidation Leverage: $113,085-$111,444
Stop Loss: $104,420
Please respect each other's ideas and express them politely if you agree or disagree.
Bitcoin Analysis (BTCUSDT), 1-hour time frame.
Be sure to follow the updated ideas.
Do not forget to put a Stop loss for your positions (For every position you want to open).
Please follow your strategy and updates; this is just my Idea, and I will gladly see your ideas in this post.
Please do not forget the ✅' like '✅ button 🙏😊 & Share it with your friends; thanks, and Trade safe.

BITCOIN HIGH PROBABILITY SETUP SOON!!!🚨 BTCUSD HIGH PROBABILITY BUY SETUP 🚨
* Here We Can See Clearly The Next Potential Moves For BTC Coming Hours/Days.
* Keep Your Eyes Close On Your Trading Positions.
* Happy PIP Hunting Traders.
FXKILLA.

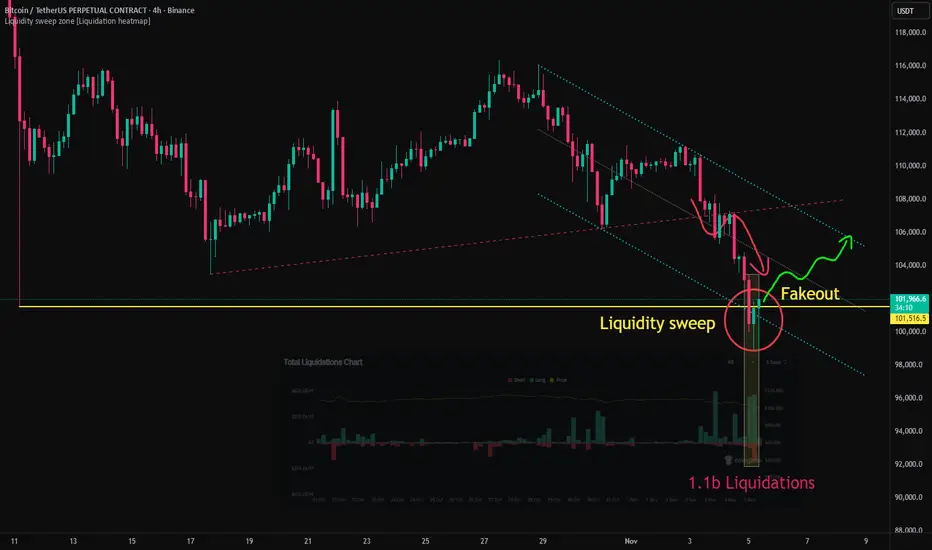
Bitcoin Drops Below 100K, Reversal Signal EmergingAfter breaking below the 107K support level, Bitcoin retested the area and then extended its decline.
As the downtrend intensified, the price broke through 102K, which was the low recorded during the large-scale liquidation event on October 11, and subsequently lost the psychological support level at 100K.
During the eight-hour period of this decline, approximately 1.1 billion USD worth of long positions were liquidated, accompanied by both a liquidity sweep and a fakeout pattern.
The simultaneous occurrence of large-scale liquidations, increased trading volume, a fakeout pattern, and the process of filling the CME gap indicates that multiple short-term reversal signals emerged in this zone.
From a technical standpoint, there is an increasing likelihood of two consecutive bullish candles with long lower wicks forming on the 4-hour chart, while the 12-hour chart also shows a high probability of developing a bullish candle with a long lower shadow.
This suggests a growing possibility of a short-term rebound, with the potential upside target near the upper boundary of the descending parallel channel.
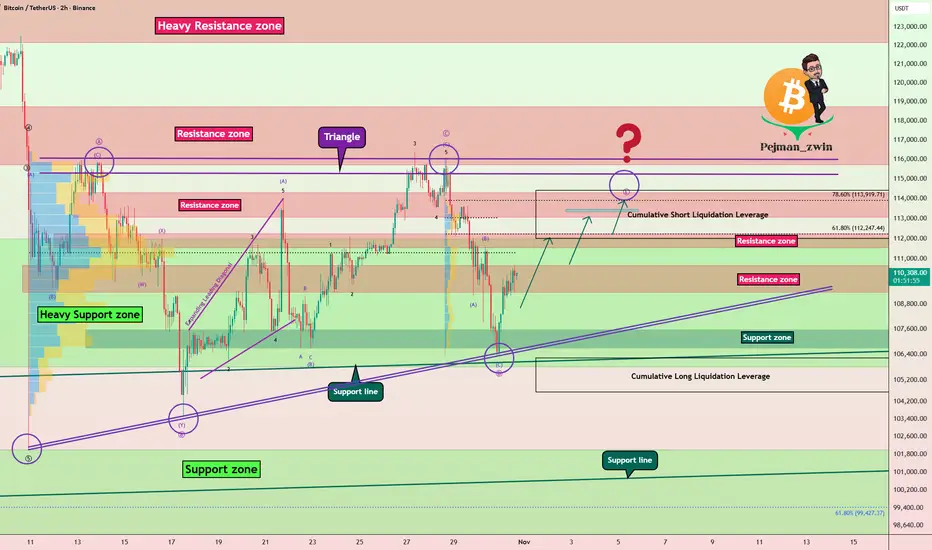
Bitcoin Correction Forming a Triangle – Which Way Next?Bitcoin ( BINANCE:BTCUSDT ), just as I expected in the previous idea , started to decline and reached its full target .
Over the past 20 days , Bitcoin has been moving in a ranging pattern that seems to be forming into a triangle shape .
From an Elliott Wave perspective , this corrective structure also appears to be a triangle , with its wave E potentially completing around the Resistance zone($114,300-$113,000) and the Cumulative Short Liquidation Leverage($114,424-$112,000) .
I expect that in the coming hours, Bitcoin can rise at least up to about $112,800 . If the upward momentum is strong enough , we might even see it reach the upper lines of the triangle .
Cumulative Long Liquidation Leverage: $106,231-$104,648
Please respect each other's ideas and express them politely if you agree or disagree.
Bitcoin Analysis (BTCUSDT), 2-hour time frame.
Be sure to follow the updated ideas.
Do not forget to put a Stop loss for your positions (For every position you want to open).
Please follow your strategy and updates; this is just my Idea, and I will gladly see your ideas in this post.
Please do not forget the ✅' like '✅ button 🙏😊 & Share it with your friends; thanks, and Trade safe.
Bitcoin Rally Heating Up – Watch This Zone Carefully!As the new week kicked off, Bitcoin ( BINANCE:BTCUSDT ) started to climb, fueled by a pump in the S&P500 index ( SP:SPX ) and the creation of a gap in the S&P500 index.
It seems Bitcoin has successfully broken above the 100_SMA(Daily) and 50_SMA(Daily) , as well as a Resistance zone($114,300-$113,000) .
In fact, Bitcoin has also formed a new CME Gap($113,495-$110,990) due to this S&P500 Index -driven surge.
Right now, Bitcoin is approaching the next key Resistance zone($118,740-$115,740) , Potential Reversal Zone(PRZ) , the Cumulative Short Liquidation Leverage($117,577-$116,731) , and the upper line of an ascending channel .
From an Elliott Wave perspective , by breaking this Resistance zone($114,300-$113,000) , Bitcoin has entered a new phase of wave counting. It appears to be completing microwave 4 of the main wave C . Overall, the corrective structure seems to be a Zigzag Correction(ABC/5-3-5) with an expanding leading diagonal in main wave A .
I expect that in the coming hours, after a pullback to the broken Resistance zone($114,300-$113,000) and those moving averages , Bitcoin might rise again at least up to the Potential Reversal Zone(PRZ) . There's a possibility of forming a larger ascending channel, but since we haven't confirmed a second top, we can't rely on that channel just yet.
Note: In general, the crypto market in the past couple of weeks has been heavily influenced by news around U.S.-China tariffs. Any headline can cause Bitcoin and other tokens to swing up or down, so keep an eye on those geopolitical headlines.
Cumulative Long Liquidation Leverage: $113,625-$112,175
Cumulative Long Liquidation Leverage: $106,033-$104,090
Note: If Bitcoin falls below the moving averages and the Resistance zone($114,300-$113,000) again, we can expect further declines.
Please respect each other's ideas and express them politely if you agree or disagree.
Bitcoin Analysis (BTCUSDT), 2-hour time frame.
Be sure to follow the updated ideas.
Do not forget to put a Stop loss for your positions (For every position you want to open).
Please follow your strategy and updates; this is just my Idea, and I will gladly see your ideas in this post.
Please do not forget the ✅' like '✅ button 🙏😊 & Share it with your friends; thanks, and Trade safe.

Bitcoin Roadmap– Next Move Down Incoming?As I expected yesterday , Bitcoin ( BINANCE:BTCUSDT ) started rising from the Support zone($107,580-$106,700) and has now hit its Target at the Resistance zone($110,430-$109,380) .
Now the question is: will Bitcoin continue its short-term uptrend in the next few hours, or is it going to drop again? Stay with me to find out.
Bitcoin is trading near the Resistance zone($110,430-$109,380) , Potential Reversal Zone(PRZ) , and Cumulative Short Liquidation Leverage($111,613-$110,542) .
From an Elliott Wave perspective , it seems that Bitcoin is completing the wave C of an Expanding Flat Corrective Pattern(ABC/3-3-5) .
Given that the S&P 500 ( SP:SPX ) ( which has recently been correlated with Bitcoin ) is likely to drop when the U.S. market opens , I expect Bitcoin to resume its decline . This next drop might be the final push to break the Heavy Support zone($111,980-$105,820) .
What do you think? Can Bitcoin break that Heavy Support zone($111,980-$105,820) in the end or not? Let me know your thoughts!
Cumulative Long Liquidation Leverage: $106,606-$105,463
Please respect each other's ideas and express them politely if you agree or disagree.
Bitcoin Analysis (BTCUSDT), 15-minute time frame.
Be sure to follow the updated ideas.
Do not forget to put a Stop loss for your positions (For every position you want to open).
Please follow your strategy and updates; this is just my Idea, and I will gladly see your ideas in this post.
Please do not forget the ✅' like '✅ button 🙏😊 & Share it with your friends; thanks, and Trade safe.

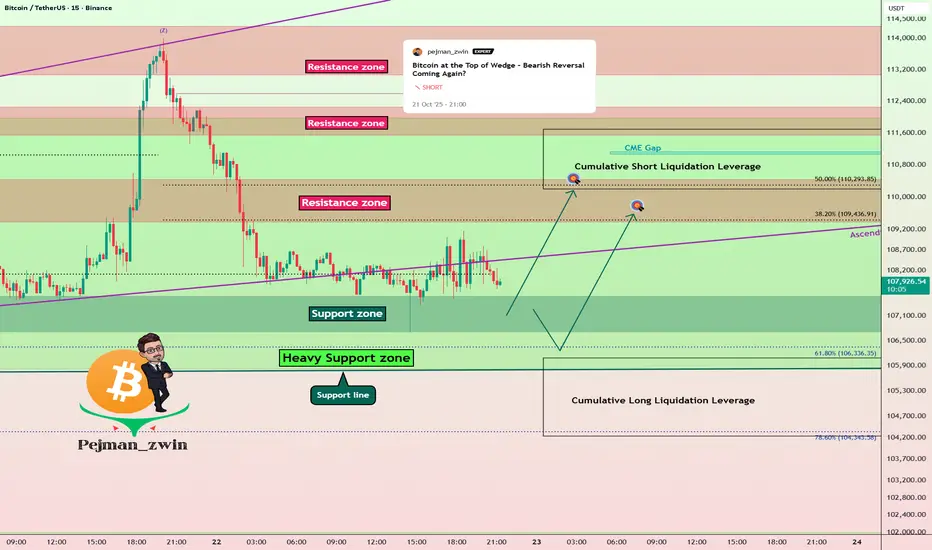
Bitcoin Short Term Setup – One More Push Before Fall?As I expected in yesterday’s idea , Bitcoin( BINANCE:BTCUSDT ) dropped down into the lower ranges of the Heavy Support zone($111,980-$105,820) .
Today, I want to share a quick 15-minute timeframe analysis with you.
Currently, Bitcoin is moving near that Support zone($107,580-$106,700) , but it hasn’t managed to break the lower line of the ascending broadening wedge pattern with strong momentum .
So I expect Bitcoin might at least make another move up to the Resistance zone($110,430-$109,380) . If BTC finds a Short Trigger near the Resistance zone and Cumulative Short Liquidation Leverage($111,687-$110,198) , it could drop sharply afterward, potentially breaking the Heavy Support zone eventually.
Cumulative Long Liquidation Leverage: $106,090-$104,234
Stop Loss(SL): $104,077
Please respect each other's ideas and express them politely if you agree or disagree.
Bitcoin Analysis (BTCUSDT), 15-minute time frame.
Be sure to follow the updated ideas.
Do not forget to put a Stop loss for your positions (For every position you want to open).
Please follow your strategy and updates; this is just my Idea, and I will gladly see your ideas in this post.
Please do not forget the ✅' like '✅ button 🙏😊 & Share it with your friends; thanks, and Trade safe.
Inverse Head & Shoulders on Bitcoin – Breakout or Bull Trap?Right now, Bitcoin ( BINANCE:BTCUSDT ) is moving within its Heavy Support zone($111,980-$105,820) .
Over the past couple of days, it tried twice to break this area but couldn’t. One big reason is that recently, there was news that Japan is considering allowing banks to invest in crypto . Also, yesterday, Trump confirmed he’ll meet with China’s president on October 31st , which the market took as a positive sign that US-China tensions might ease. Previously, the market dropped on news of potential tariffs, and now it’s reacting to the possible easing of those tensions.
In the last 24-48 hours , Bitcoin has formed an inverse head and shoulders pattern , which could signal a short-term bullish reversal. However, there are still important resistance levels and cumulative short liquidation areas overhead. We need to see if Bitcoin can break through those.
From an Elliott Wave perspective, Bitcoin still seems to be in a corrective structure, and until it gets above around $116,000 , there’s still a risk of further downside. So we shouldn’t get too excited about the recent 48-hour bounce.
In short, I expect Bitcoin might push up to those Resistance lines , the Resistance zone($114,300-$113,000) , and Cumulative Short Liquidation($115,241-$113,454) , thanks to the inverse head and shoulders, but it could face resistance there and possibly drop again.
Note: It seems that we may see an increase in Bitcoin with the opening of the US market, but because the SPX500 index( SP:SPX ) is in a correction situation, we can expect Bitcoin to fall again.
Note: Crypto market conditions depend on many parameters these days, and be sure to observe capital management.
New CME Gap: $107,690-$107,220
Cumulative Long Liquidation: $107,000-$105,782
Cumulative Short Liquidation: $112,241-$111,398
Please respect each other's ideas and express them politely if you agree or disagree.
Bitcoin Analysis (BTCUSDT), 1-hour time frame.
Be sure to follow the updated ideas.
Do not forget to put a Stop loss for your positions (For every position you want to open).
Please follow your strategy and updates; this is just my Idea, and I will gladly see your ideas in this post.
Please do not forget the ✅' like '✅ button 🙏😊 & Share it with your friends; thanks, and Trade safe.

Bitcoin at Heavy Supports – Time to Go Long?As I expected in my previous idea , Bitcoin ( BINANCE:BTCUSDT ) completed both its bullish and bearish moves and hit its Long and Short targets .
Bitcoin can still see some upside as long as it holds this Heavy Support zone($111,980-$105,820) . However, given the recent momentum and the wick down to around $102K a few days ago, any further rally depends on breaking the Resistance zone($118,750-$115,730) and touching around $117,220 , which is the high of that significant bearish candle .
Currently, Bitcoin is sitting in a Heavy Support zone($111,980-$105,820) near the 200_SMA(Daily) and a Cumulative Long Liquidation($108,415-$107,156) . It's basically hovering between key weekly support lines, so this is a pretty strong supports .
In terms of Elliott Wave theory , it looks like Bitcoin is still completing its wave 4 . This wave 4 might have formed a Double Three Correction(WXY) , and now we can expect a potential upward move .
I expect that in the next few hours, Bitcoin may start a short-term bullish move up to around $115,000 or to the Cumulative Short Liquidation Leverage($114,973-$113,435) .
Note: Overall, it's better to look for Long positions right now, considering Bitcoin's position. But if it breaks the 200_SMA(Daily) and the Heavy Support zone($111,980-$105,820), we could see a broader crypto market drop.
Note: Around the $108,000 level, we have huge buy orders stacked up, which might act as a significant support zone.
Please respect each other's ideas and express them politely if you agree or disagree.
Bitcoin Analysis (BTCUSDT), 4-hour time frame.
Be sure to follow the updated ideas.
Do not forget to put a Stop loss for your positions (For every position you want to open).
Please follow your strategy and updates; this is just my Idea, and I will gladly see your ideas in this post.
Please do not forget the ✅' like '✅ button 🙏😊 & Share it with your friends; thanks, and Trade safe.

BTC (SHORT)BINANCE:BTCUSDT
SHORT
Entry 123 900
SL 126 300
T1 117 500
Golden Advices.
********************
* Please calculate your losses before the entry.
* Do not enter any trade you find it not suitable for you.
* No FOMO - No Rush , it is a long journey.

Bitcoin Roadmap Before FOMC Minutes – Correction or New ATH?Today, we have one of the most important macro events — the FOMC Meeting Minutes
Let’s quickly understand what it is and why it could shake the crypto market
What are FOMC Minutes?
They’re the detailed notes from the last Federal Reserve meeting, showing what members discussed about interest rates, inflation, and the economy.
Markets carefully read every line to find hints about future rate cuts or continued tightening.
Why does it matter for Bitcoin?
When the Fed turns dovish (hinting at lower rates), risk assets like Bitcoin usually rally But when the tone is hawkish (worried about inflation), investors move to cash or bonds, causing crypto to dip.
Let’s take a look at Bitcoin ( BINANCE:BTCUSDT ) on the 4-hour timeframe .
Before analyzing the chart, let’s quickly review what defines a strong uptrend :
1-Higher Lows(HL):
Each new low should form above the previous one, showing that buyers are stepping in earlier each time.
2-Higher Highs(HH):
Each new high should be higher than the last, confirming that bullish momentum is still in control.
3-Structure Respect:
The new low should not break below the previous high — if it does, it doesn’t necessarily mean the trend is over, but it indicates a weakening of the bullish structure.
Based on the points above, Bitcoin failed to form a new Higher Low(HL) during the past 24 hours, and the previous high was retested .
These signals indicate a loss of bullish momentum, suggesting that we might see at least a short-term correction from a technical perspective.
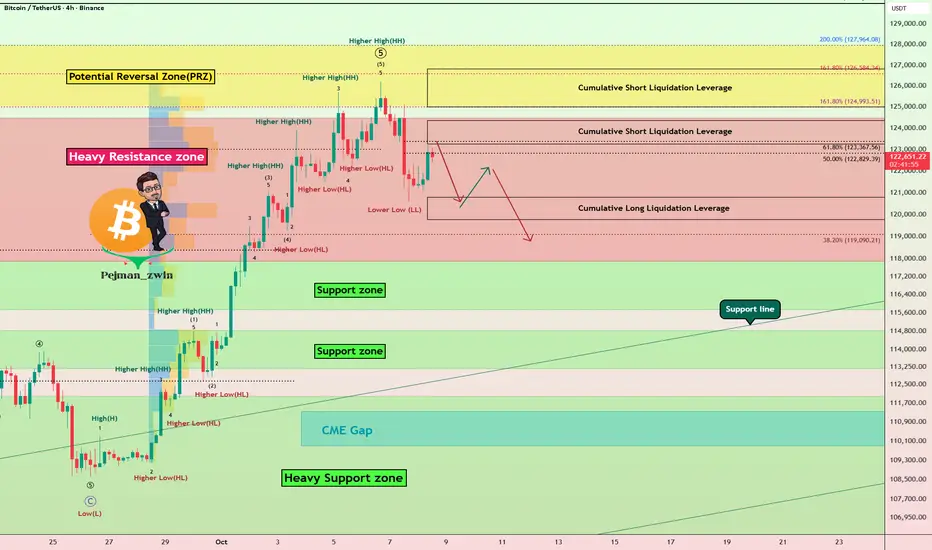
Bitcoin has already started to bounce back nicely from the Potential Reversal Zone (PRZ) and is currently trading in a Heavy Resistance zone($124,474-$117,900) .
In terms of Elliott Wave theory , it seems that with the formation of a Lower Low(LL) , Bitcoin has completed at least a series of impulsive waves , and we can now expect corrective waves .
I expect Bitcoin to drop to at least Cumulative Long Liquidation Leverage($120,779-$119,957) before the FOMC Meeting Minutes start and could continue to rise or correct depending on the tone of the FOMC Meeting Minutes .
Note: You should note that these days, Bitcoin has a higher correlation with the SPX500( SP:SPX ) index than before, so if there is a sudden movement in Bitcoin, one of the reasons could be a sudden movement in the SPX500.
Do you think this bullish move could lead to a new all-time high (ATH) for Bitcoin again!?
Cumulative Short Liquidation Leverage: $124,350-$123,244
Cumulative Short Liquidation Leverage: $126,813-$125,000
CME Gap: $111,355-$109,915
Please respect each other's ideas and express them politely if you agree or disagree.
Bitcoin Analysis (BTCUSDT), 4-hour time frame.
Be sure to follow the updated ideas.
Do not forget to put a Stop loss for your positions (For every position you want to open).
Please follow your strategy and updates; this is just my Idea, and I will gladly see your ideas in this post.
Please do not forget the ✅' like '✅ button 🙏😊 & Share it with your friends; thanks, and Trade safe.
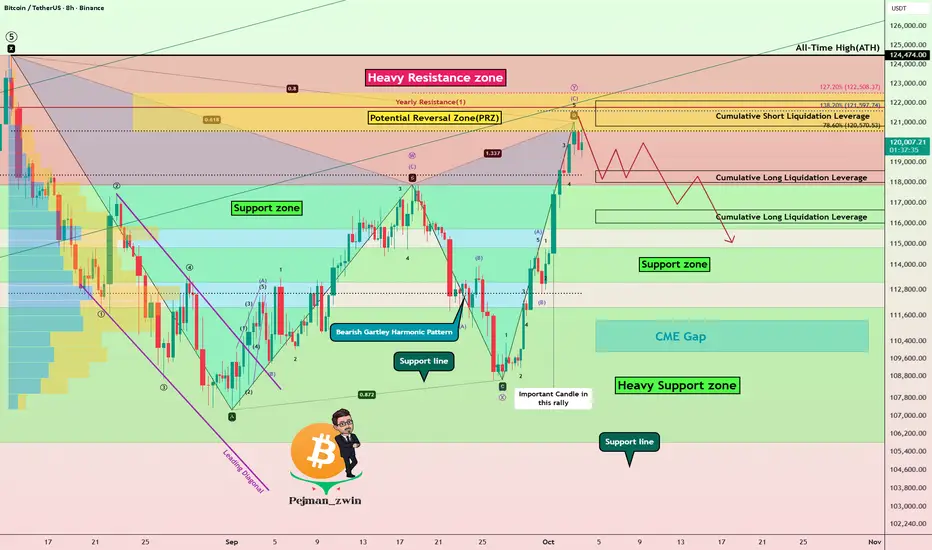
Elliott Wave + Gartley Harmonic: Why Bitcoin May Correct Soon!?Bitcoin( BINANCE:BTCUSDT ) has shown strong bullish momentum over the past week, climbing nearly +10% and testing key resistance zones . Several fundamental and technical factors fueled this rally.
Key Drivers of the Rise:
ETF inflows – Significant net inflows into spot Bitcoin ETFs boosted demand.
Macro uncertainty – U.S. government shutdown risk and weaker job data supported risk assets.
Monetary policy – Expectations of softer Fed policy improved market sentiment.
Derivatives impact – Options expiry, high OI, and short squeezes added upward pressure.
Exchange outflows – Lower BTC supply on exchanges signaled accumulation.
Positive sentiment – “Uptober” narrative and bullish analyst targets lifted confidence.
-------------------------------------------
Now, if we look at the Bitcoin chart in the above timeframes from a technical analysis perspective , we can see the following:
First of all, let me say that the rally that Bitcoin has had over the past 7 days has NOT been accompanied by high volume, and this is not good news for Bitcoin to create a new All-Time High(ATH) .
Bitcoin is entering a Heavy Resistance zone($124,474(ATH)-$117,900) and is moving near the Potential Reversal Zone (PRZ) and Cumulative Short Liquidation Leverage($122,120-$120,823) .
In terms of Elliott Wave theory , Bitcoin appears to be completing a microwave C of the main wave Y . One of the reasons I saw the waves as corrective , other than the microwaves, was the low volume of Bitcoin in the past 7-day rally .
If we look at the Bitcoin chart from a pattern perspective , the important Bearish Gartley Harmonic Pattern is also well and standardly defined on the chart, such that point D in the PRZ can be completed. The Gartley Harmonic Pattern is the most important pattern among the harmonic patterns .
I DO NOT expect a new ATH formation for Bitcoin in this rally due to the above reasons, and I expect it to at least decline to the Support zone($114,820-$113,180) .
Note: Important prices to watch for if Bitcoin reverses (in order of importance of volume): $118,400-$112,700
Note: You should note that these days, Bitcoin has a higher correlation with the SPX500( SP:SPX ) index than before, so if there is a sudden movement in Bitcoin, one of the reasons could be a sudden movement in the SPX500.
Educational Tip : The volume of each candle is considered to be the identity and credibility of that candle, and you can find these candles with the help of volume candle charts.
Cumulative Long Liquidation Leverage: $118,583-$118,000
Cumulative Long Liquidation Leverage: $116,652-$116,000
CME Gap: $111,355-$109,915
Stop Loss(SL): $125,00(Worst)
Please respect each other's ideas and express them politely if you agree or disagree.
Bitcoin Analysis (BTCUSDT), 8-hour time frame.
Be sure to follow the updated ideas.
Do not forget to put a Stop loss for your positions (For every position you want to open).
Please follow your strategy and updates; this is just my Idea, and I will gladly see your ideas in this post.
Please do not forget the ✅' like '✅ button 🙏😊 & Share it with your friends; thanks, and Trade safe.