BTC Bulls in Control: 140K–150K Next?In my previous BTC analysis, I mentioned that 125K was the next target and that as long as 112K remains intact, bulls have nothing to worry about.
Since then, the price continued its ascent and is now flirting with the all-time high.
________________________________________
1️⃣ Is BTC Going to Make a New ATH?
From my point of view, it’s no longer a question of if , but how high it can go.
The trend is strong, momentum is building, and technically, we’re entering uncharted territory.
________________________________________
2️⃣ T echnical Context
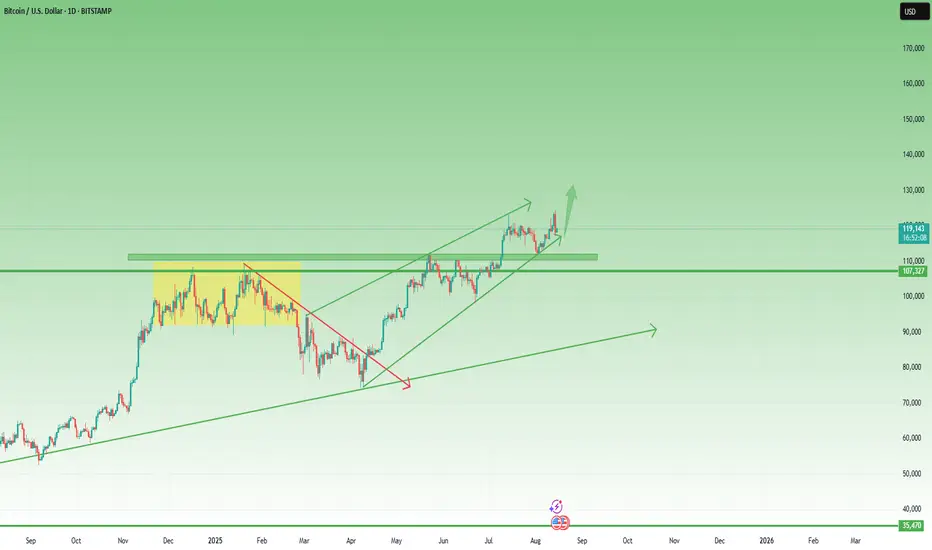
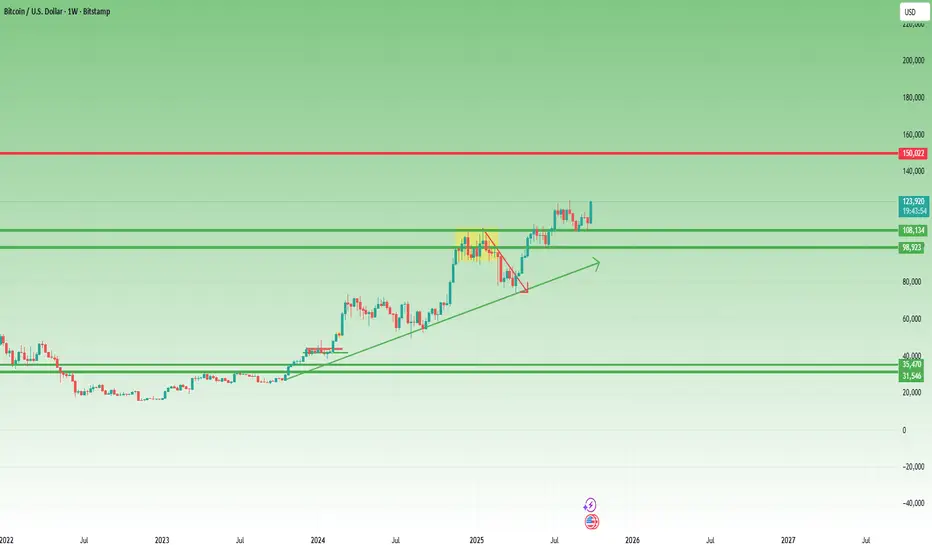
After nearly three months of consolidation, clearly visible on the weekly chart, the breakout above the rectangle pattern gives us a measured target around 140K.
That’s the logical projection based on structure and continuation strength.
________________________________________
3️⃣ Can BTC Reach 150K?
Absolutely possible.
That’s only about a 20% move from current levels, and for Bitcoin, such moves are almost routine.
As long as 112K support holds, bulls remain fully in control.
________________________________________
Conclusion:
BTC seems ready to explore new highs.
Now the only question is — how far can this go? 🚀
Btcsignals
BTC Market Cap – Bearish Channel Reversal Setup (1H Analysis)Chart Context:
The chart shows BTC market cap moving within an ascending parallel channel, with price recently reaching the upper boundary resistance and starting to show signs of weakness.
📊 Key Levels
Entry Point: 2.46T
Stop Loss: 2.49T
Target (LABA TARGET POINT): 2.33T
Current Price: ~2.44T
🔍 Technical Breakdown
Ascending Channel:
The BTC market cap has been trending upward within the blue channel, respecting both upper and lower boundaries.
Rejection at Upper Channel:
The price touched the top boundary near 2.49T and began consolidating — a classic signal for potential downside correction.
Bearish Setup:
The shaded red zone represents a short setup:
Entry near 2.46T (retest of structure resistance).
Stop loss above channel top (2.49T).
Target towards 2.33T (lower channel / support zone).
Risk–Reward Ratio:
Estimated around 1:4, making it a favorable short setup if confirmation (e.g., bearish candle or structure break) appears.
Volume & Momentum:
Momentum seems to be slowing; lower highs and flattening volume often precede corrective moves in such setups.
🧭 Conclusion
Bias: Bearish (short-term correction expected)
Trade Plan:
Wait for a small retracement or retest near 2.46T before entry.
Stop loss: above 2.49T.
Target: 2.33T (LABA zone).
Invalidation: A breakout above 2.49T would invalidate this short setup and could push BTC market cap toward 2.52T+.

BTC (LONG)BINANCE:BTCUSDT
Entry range (111600- 113000)
SL 109977
T1 124 900
T2 131 600
Extra Target is optional 139000
_______________________________________________________
Golden Advices.
********************
* collect the coin slowly in the entry range.
* Please calculate your losses before the entry.
* Do not enter any trade you find it not suitable for you.
* No FOMO - No Rush , it is a long journey.

Bitcoin: Third Time’s a Charm at 120k?Two days ago, in my last BTC analysis, I mentioned that bulls had to defend 112k at all costs. Losing it would have opened the gates toward 100k.
Fortunately for the bullish camp, the defense worked. Bitcoin didn’t just hold the line—it pushed higher and broke through the 115k resistance, which had been reinforced by a falling trendline.
Now, with price trading around 118,600, the market is once again staring at the critical 120k barrier.
________________________________________
Why 120k Is So Important
• BTC has already tested this level twice this year, only to be rejected both times.
• Each failure sparked corrections, making 120k not just a number but a milestone for sentiment and structure.
• If bulls can finally conquer and hold above it, the door to new all-time highs swings open.
________________________________________
Technical Structure
• 108k: A solid support.
• 112k: The battleground of the past few months—resistance, support, resistance, etc is now reconquered.
• Trendline Break: The falling trendline gave way, giving bulls the momentum they needed.
The chart is building constructively, with strong supports.
________________________________________
Third Time’s a Charm?
Markets don’t often give three chances at the same key level. The third test usually decides the story.
My stance: buy dips. As long as 112k remains intact, I expect BTC to break 120k and head toward a new ATH.
So, will 120k finally fall on the third attempt? My conviction is stronger than before. 🚀
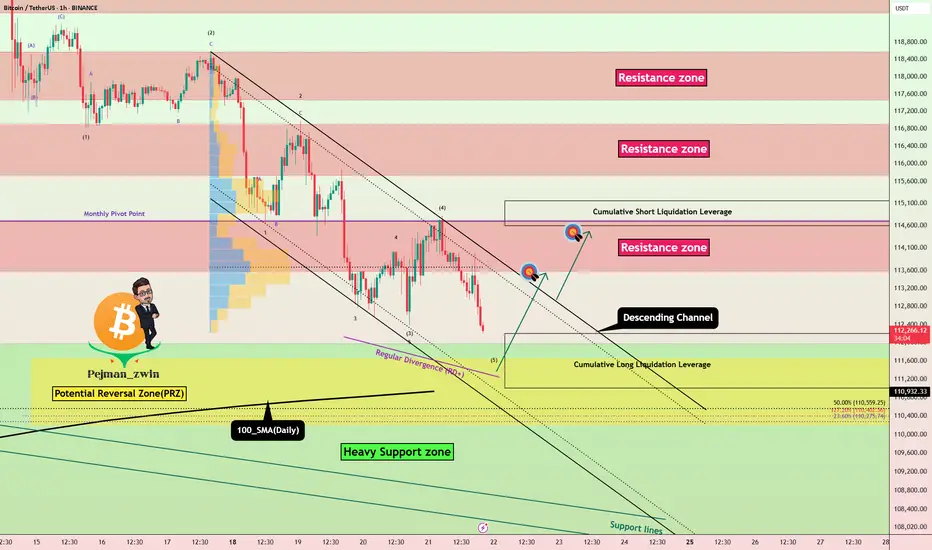
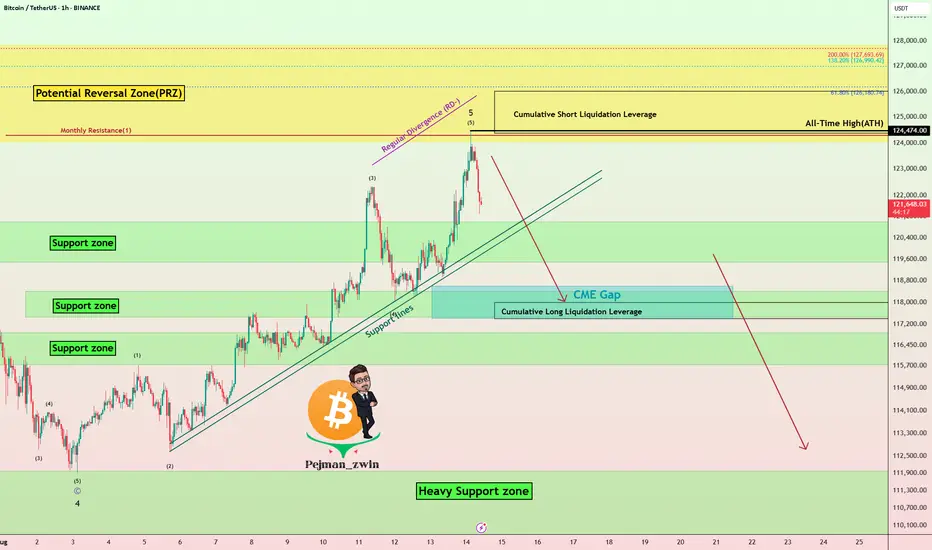
Bitcoin Faces $120K Resistance – Bull Trap or Breakout?Bitcoin ( BINANCE:BTCUSDT ) continued its uptrend of the last 2-3 days as I expected in my previous idea . Today, the announcement of the ADP Non-Farm Employment Change index worked like a catalyst for Bitcoin .
Bitcoin is currently surrounded by Resistance zones and a Potential Reversal Zone (PRZ) , and is near the important price of $118,400(Volumetric importance) and the $120,000(Round Number) .
From the perspective of Elliott Wave theory , it seems that Bitcoin could be in corrective waves and that the increase of the last few days could only serve as a Bull Trap .
I expect Bitcoin to decline at least to the Support lines .
Cumulative Long Liquidation Leverage: $113,590-$111,900
Cumulative Long Liquidation Leverage: $115,823-$115,087
Cumulative Short Liquidation Leverage: $120,000-$118,000
Note: If Bitcoin falls below the Support zone($114,820-$113,180), we should expect further declines.
CME Gap: $111,355-$109,915
Stop Loss(SL): $120,103
Please respect each other's ideas and express them politely if you agree or disagree.
Bitcoin Analysis (BTCUSDT), 1-hour time frame.
Be sure to follow the updated ideas.
Do not forget to put a Stop loss for your positions (For every position you want to open).
Please follow your strategy and updates; this is just my Idea, and I will gladly see your ideas in this post.
Please do not forget the ✅' like '✅ button 🙏😊 & Share it with your friends; thanks, and Trade safe.

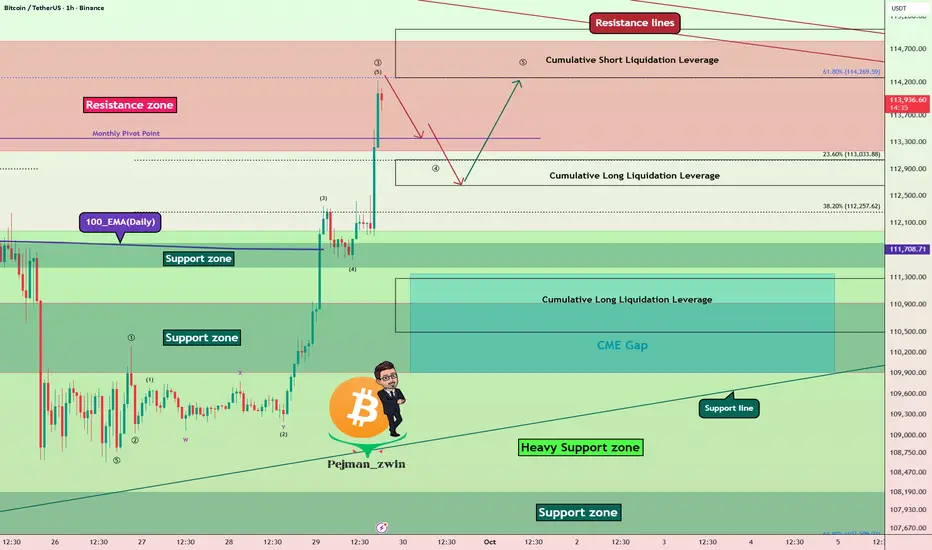
Bitcoin Resistance Zone Battle – ATH or Fakeout?Bitcoin ( BINANCE:BTCUSDT ) has shown strong momentum over the past 5 days , liquidating many traders in both Long and Short positions .
Bitcoin has now entered the Resistance zone($114,820-$113,170) and is moving near the Cumulative Short Liquidation Leverage($115,000-$114,272) and Resistance lines .
From an Elliott Wave Theory perspective, given Bitcoin’s strong bullish momentum over the past 24 hours, it appears to be completing Wave 3. This Wave 3 seems to be of the extended type.
I expect Bitcoin , after a correction , to make another attempt toward the Resistance zone($114,820-$113,170) and potentially test the Resistance lines .
Do you think this bullish move could lead to a new all-time high (ATH) for Bitcoin?
Cumulative Long Liquidation Leverage($113,037-$112,650) + Near Monthly Pivot Point($113,356): An area where Bitcoin could start rising again (if there is a correction, of course).
Cumulative Long Liquidation Leverage: $111,100-$110,500
CME Gap: $111,355-$109,915
Note: Also, Bitcoin approaching the 61.8% golden Fibonacci level could lead to a Bitcoin correction.
Please respect each other's ideas and express them politely if you agree or disagree.
Bitcoin Analysis (BTCUSDT), 1-hour time frame.
Be sure to follow the updated ideas.
Do not forget to put a Stop loss for your positions (For every position you want to open).
Please follow your strategy and updates; this is just my Idea, and I will gladly see your ideas in this post.
Please do not forget the ✅' like'✅ button 🙏😊 & Share it with your friends; thanks, and Trade safe.
BTCUSD REMAINS BEARISH TREND | BTC PLAN SEP.26 📊 BTC/USD – M45 Analysis
Market Structure:
The overall structure remains bearish, confirmed by multiple Break of Structure (BOS) to the downside.
The downtrend line is intact, showing sellers are still in control.
Recent price action is consolidating just below the FVG (Fair Value Gap) and the fib retracement zone.
🎯 Trading Plan (Intraday, M45)
Bearish Scenario (Higher Probability):
If price retraces to the 111,000 – 111,200 FVG/supply zone, look for rejection signals → potential short entries targeting 109,000 and then 108,000.
Bullish Scenario (Countertrend):
If price breaks and closes strongly above 111,200, it would invalidate the bearish trendline and shift short-term momentum upward. In that case, target would be the next supply around 113,000 – 114,000.

BTC – Key Supports Breaking, Bears Gaining ControlAfter reaching a local high around 118K in mid-September, Bitcoin turned lower and yesterday broke decisively below the important 112K support.
The break accelerated the selloff, sending price tumbling into the next key zone around 108,500 – 109,000.
With a clear lower high now in place compared to the 124,500 ATH, the structure doesn’t look favorable for the bulls. On the contrary, there are strong chances of continued downside pressure, with the 100K level standing out as the next major magnet for price.
Trading Plan:
• As long as 112,000 – 112,500 holds as resistance, I maintain a bearish bias.
• The strategy remains to sell rallies into resistance, keeping targets toward 105K and potentially 100K.
• Only a decisive reclaim above 112.5K would weaken the bearish case and force me to reassess.

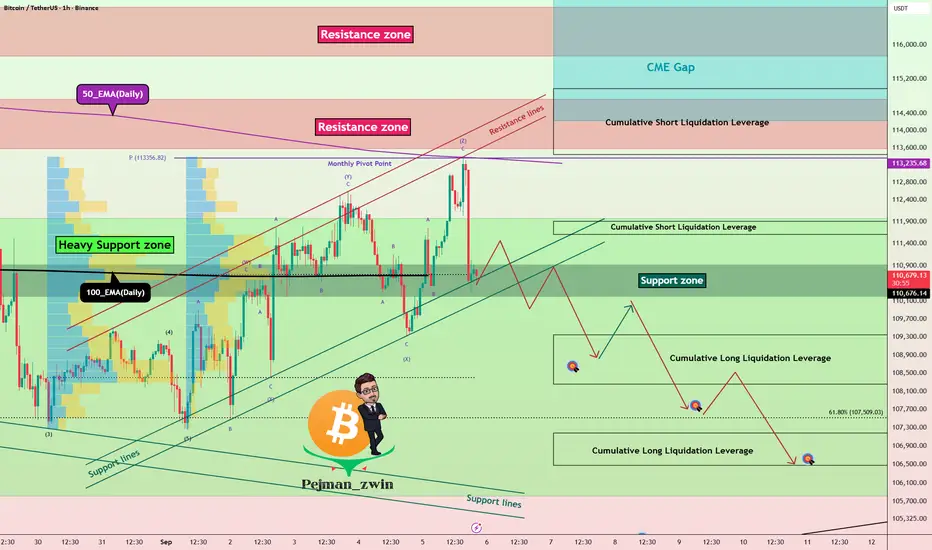
Bitcoin Setup: Eyeing CME Gap at $113KBitcoin( BINANCE:BTCUSDT ) is currently trading in a Heavy Support zone($112,000-$105,800) and near the Support zone($110,920-$109,900), Support lines, Potential Reversal Zone(PRZ) , and Cumulative Long Liquidation Leverage($110,430-$109,660).
In terms of Elliott Wave theory, Bitcoin seems to have completed a microwave 5, the reason for today's drop was the correction in the SPX500 index( SP:SPX ) and the release of US indices(Final GDP q/q, Unemployment Claims).
Also, we can see the Regular Divergence(RD+) between Consecutive Valleys.
I expect Bitcoin to move back above 100_EMA(Daily) because the breakout volume was not enough, and attack the Resistance lines. If the Resistance lines are broken we can expect the CME Gap($113,380-$113,275) to fill.
First Target: $112,600
Second Target: $113,280
Stop Loss(SL): $109,280
Cumulative Short Liquidation Leverage: $114,866-$113,720
Please respect each other's ideas and express them politely if you agree or disagree.
Bitcoin Analysis (BTCUSDT), 1-hour time frame.
Be sure to follow the updated ideas.
Do not forget to put a Stop loss for your positions (For every position you want to open).
Please follow your strategy and updates; this is just my Idea, and I will gladly see your ideas in this post.
Please do not forget the ✅' like '✅ button 🙏😊 & Share it with your friends; thanks, and Trade safe.

Bearish Setup in Bitcoin – Correction Before Deeper Drop?Bitcoin ( BINANCE:BTCUSDT ) started to decline and broke the ascending channel and Support zone($114,820-$113,170) with the help of the Bearish Flag Pattern , as I expected in the previous idea update .
Do you think Bitcoin can go below $105,000 !?
Bitcoin is once again approaching 100_EMA(Daily) and the Heavy Support zone($112,000-$105,800) .
From the perspective of Elliott Wave theory , Bitcoin appears to have completed the Zigzag Correction(ABC/5-3-5) in the ascending channel, and now it seems that we should expect bearish waves .
I expect Bitcoin to FAIL to break the 100_EMA(Daily) with one attack and have an upward correction to Fibonacci levels and Cumulative Short Liquidation Leverage($114,098-$113,229) , and then re-attack the Heavy Support zone($112,000-$105,800) and 100_EMA(Daily) .
Cumulative Long Liquidation Leverage: $111,850-$110,421
Note: If Bitcoin goes above $115,000, we should expect Bitcoin to rise again.
Note: There is also a possibility that the SPX500 index( SP:SPX ) will also correct and, given Bitcoin's correlation with this index, cause Bitcoin to correct further.
Please respect each other's ideas and express them politely if you agree or disagree.
Bitcoin Analysis (BTCUSDT), 4-hour time frame.
Be sure to follow the updated ideas.
Do not forget to put a Stop loss for your positions (For every position you want to open).
Please follow your strategy and updates; this is just my Idea, and I will gladly see your ideas in this post.
Please do not forget the ✅' like '✅ button 🙏😊 & Share it with your friends; thanks, and Trade safe.

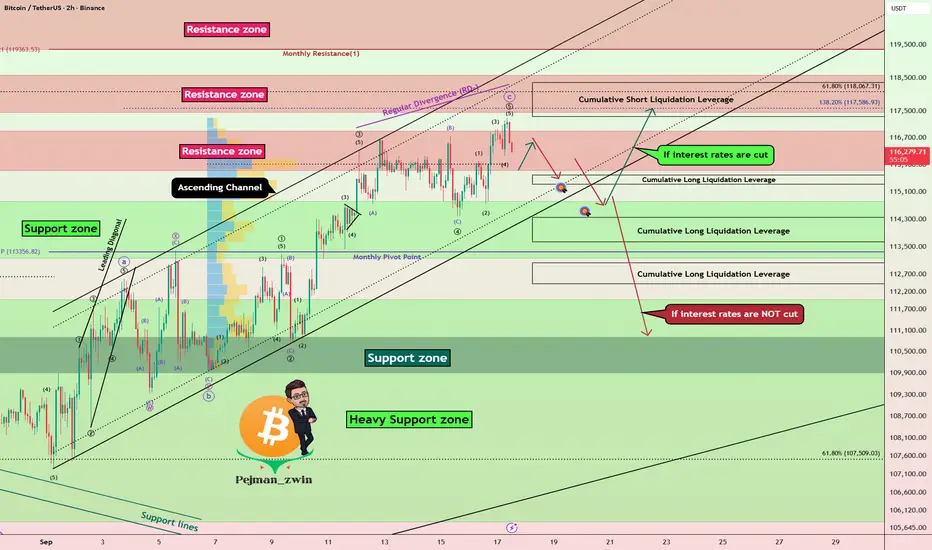
FOMC Day: Prepare for Potential Bitcoin Volatility!Today is a big day for the markets – the US Federal Funds Rate decision and the FOMC Press Conference are scheduled, events that could potentially change the game for Bitcoin ( BINANCE:BTCUSDT ) and other assets .
But until the meeting begins , we still have time to analyze the charts and prepare.
Keep in mind : as we get closer to the announcement and especially during the release, the market could turn highly volatile. Manage your positions wisely and don’t forget your stop-loss levels .
-------------------------------------------
Bitcoin rose about +2% yesterday on the news that " Trump Family's American Bitcoin just went public on the Nasdaq ."
Bitcoin is currently trading in an ascending channel and Resistance zone($116,900-$115,730) near the Cumulative Short Liquidation Leverage($118,354-$117,329) .
In terms of Elliott Wave theory , if interest rates cut , Bitcoin could be completing wave 4 and then rising again and possibly forming a new All-Time High(ATH) . On the other hand, if interest rates do NOT cut , Bitcoin appears to have completed wave C of the Zigzag Correction structure(ABC/5-3-5) .
Also, we can see the Regular Divergence(RD-) between Consecutive Peaks .
I expect Bitcoin to drop to at least $114,860(First Target) before the Fed meeting starts , and if interest rates are not cut , we will see a further and more sudden drop in Bitcoin . And if interest rates CUT , there is a high probability of a Bitcoin pump, so stick to the first target($114,860) for now.
Second Target: $114,470
Cumulative Long Liquidation Leverage: $115,597-$115,330
Cumulative Long Liquidation Leverage: $114,351-$113,640
Cumulative Long Liquidation Leverage: $113,031-$112,430
Do you think the Federal Reserve will cut interest rates?
Please respect each other's ideas and express them politely if you agree or disagree.
Bitcoin Analysis (BTCUSDT), 2-hour time frame.
Be sure to follow the updated ideas.
Do not forget to put a Stop loss for your positions (For every position you want to open).
Please follow your strategy and updates; this is just my Idea, and I will gladly see your ideas in this post.
Please do not forget the ✅' like '✅ button 🙏😊 & Share it with your friends; thanks, and Trade safe.
PPI Shock Pushes Bitcoin Higher – Fake Pump Before Drop?Bitcoin ( BINANCE:BTCUSDT ) has been making high momentum Sharpe moves over the last few days , which has made it a little difficult to trade, which is why I am still sticking to my previous analysis , and this analysis is an update of targets and even new entry points .
Bitcoin is currently moving near the Resistance zone($114,720-$113,580) , Reversal Zone(PRZ) , Cumulative Short Liquidation Leverage($114,510-$113,771) , Monthly Pivot Point , and Resistance lines = a set of Resistances
A few minutes ago, the US Core PPI m/m and PPI m/m data were released, which triggered a pump in Bitcoin . In my view, we should wait for Bitcoin to digest this shock and then continue its real trend .
Do you agree with me?
In terms of Elliott Wave theory , it seems that Bitcoin has completed microwave 5 of microwave C of the main wave Y , and we can expect a downtrend .
I expect Bitcoin to drop again to at least $111,600(First Target) .
Second Target: $110,883
Third Target: $110,000 and more dumps.
Stop Loss(SL): $114,923(Worst)
CME Gap: $117,235-$113,800
Cumulative Long Liquidation Leverage: $110,822-$109,752
Note: Be sure to follow capital management and do not take risks.
Please respect each other's ideas and express them politely if you agree or disagree.
Bitcoin Analysis (BTCUSDT), 1-hour time frame.
Be sure to follow the updated ideas.
Do not forget to put a Stop loss for your positions (For every position you want to open).
Please follow your strategy and updates; this is just my Idea, and I will gladly see your ideas in this post.
Please do not forget the ✅' like '✅ button 🙏😊 & Share it with your friends; thanks, and Trade safe.

Bitcoin Roadmap – Breakdown Toward $107K or Bounce?Bitcoin ( BINANCE:BTCUSDT ) has been moving with high momentum this week , with the US indexes and Gold ( OANDA:XAUUSD ) bullish .
Bitcoin is currently trying to break the Support lines , Support zone($110,920-$110,200) and 100_EMA(Daily) .
In terms of Elliott Wave theory , it seems that the waves that Bitcoin has made this week have been in the form of a Triple Three Correction(WXYXZ) .
I expect Bitcoin to decline to at least $109,133(First Target) AFTER the Supports are broken.
Second Target: $107,740
Third Target: $106,660
Stop Loss(SL): $114,108(Worst)
Note: As I said at the beginning of this analysis, the financial markets have been a bit emotional and sudden with their movements this week, so always be prepared for any scenario and pay more attention to capital management.
Note: Generally, trading volume is low on Saturdays and Sundays. Perhaps it is a bit far-fetched to expect a break of the Heavy Support zone($111,980-$105,820) during the weekend. What do you think?
Cumulative Short Liquidation Leverage: $114,976-$113,440
Cumulative Short Liquidation Leverage: $111,907-$111,607
Cumulative Long Liquidation Leverage: $109,346-$108,259
Cumulative Long Liquidation Leverage: $107,181-$106,479
CME Gap: $117,235-$113,800
Please respect each other's ideas and express them politely if you agree or disagree.
Bitcoin Analysis (BTCUSDT), 1-hour time frame.
Be sure to follow the updated ideas.
Do not forget to put a Stop loss for your positions (For every position you want to open).
Please follow your strategy and updates; this is just my Idea, and I will gladly see your ideas in this post.
Please do not forget the ✅' like '✅ button 🙏😊 & Share it with your friends; thanks, and Trade safe.
$BTC Daily UpdateCRYPTOCAP:BTC #BTC Very good bullish pin bar on 4h off of $107,461 support, put bullish engulfing following it. $110,423 resistance being tested, $109,022 support in effect and tested, Bullish engulfing on previous daily close too, time to see if it can follow thru. Decline in volume on last 4h close, weakening climb, we gonna be here for a while, support at $107,461 to watch with resistance remaining at $110,423 and key resistance at $115,753.
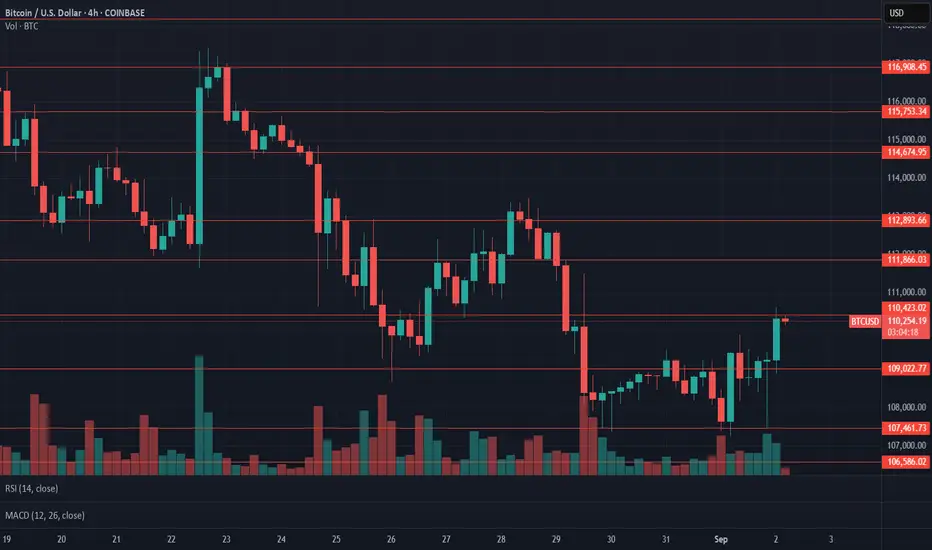
$BTC Daily UpdateCRYPTOCAP:BTC #BTC on $110,423 support, $112,893 current resistance. Bearish engulfing on last 4h close - expect support test if followed thru. Previous Daily close with Bullish engulfing but lack of volume on current with weak buyers show no sign of follow thru, RSI dropping, $109,022 key support from here and then $106,586. $115,753 key resistance from here.

Bitcoin May Correct – Critical Support at $110K📊 Market Developments
Bitcoin is currently trading around $110,154, with intraday movement between $108,951 – $112,820.
The minor pullback follows a decline from the $112K–$113K support zone, triggering $44M outflows on Aug 26.
📈 Technical Analysis
🔹 Key Resistance: ~$113,800 → breakout above this may trigger strong recovery.
🔹 Nearest Support: ~$110K → holding here could lead to bounce; breakdown targets $108K – $106.2K.
📌 EMA09: Not specified, but price near support suggests buying pressure being tested.
📉 Candlestick / Momentum: BTC broke below its multi-month upward channel, showing a CHoCH → short-term bearish control.
🧐 Outlook
Bitcoin may continue to correct short-term if $110K support fails.
However, a rebound above $113.8K could revive bullish momentum toward $120K+.
💡 Suggested Trading Strategy
🔺 BUY BTC/USD: 108,500 – 109,000
🎯 TP: 40/80/200 pips
🛑 SL: 107,900
🔻 SELL BTC/USD: 113,800 (if bearish reversal confirmed)
🎯 TP: 40/80/200 pips
🛑 SL: 114,300

Bitcoin back at 112k: Bullish Illusion or Bearish Truth?1. What happened lately
In my previous BTC analysis, I mentioned that as long as the 110k zone holds, the bullish structure technically remains intact.
On Friday, Powell’s speech lifted the market precisely from that zone, as the possibility of rate cuts injected optimism across risk assets, including crypto.
2. The psychological trap
But here’s the question I keep asking myself: is this genuine strength, or just wishful thinking? I’ve said it many times — trade what you see, not what you hope for . And what the charts are showing right now is not as promising as the initial bounce might suggest.
3. Technical signals
- BTC quickly returned to the 112k support level, erasing the Friday rally.
- Price remains under the trendline that started in April.
- The bounce looks more like a retest of broken levels than a new impulsive leg.
- Structurally, we can even identify a head and shoulders pattern with the neckline around the 110k zone, although not perfectly shaped.
4. Reading between the lines
It’s hard for me to believe that Bitcoin came back to the same support just to give latecomers another easy buying opportunity. More likely, the “rate cut euphoria” was dead cat bounce, and the market is telling us something different than the headlines.
5. Conclusion
At this moment, I remain neutral in my positioning but leaning bearish in my outlook. Optimism is tempting, but discipline requires us to trust the charts, not our hopes.
And... if it looks like a duck, walks like a duck, and quacks like a duck… it’s probably a duck. 🦆

Bitcoin Long Setup: PRZ + Heavy Supports in Action!Bitcoin ( BINANCE:BTCUSDT ), as I expected in the previous idea , fell to at least $112,640 and is completing the second target (Full Target) .
Bitcoin is approaching the Heavy Support zone($111,980-$105,820) and 100_SMA(Daily) , Potential Reversal Zone(PRZ) , and Cumulative Long Liquidation Leverage($112,200-$111,000) , generally , heavy supports and resistances are NOT broken with the first attack , so I am publishing this analysis with the label ''LONG'' .
In terms of Elliott Wave theory , Bitcoin is completing a main wave 5 , as the main wave 3 was an extended wave .
Also, we can see the Regular Divergence(RD+) between Consecutive Valleys .
I expect Bitcoin to start rising from the Potential Reversal Zone(PRZ) and Cumulative Long Liquidation Leverage($112,200-$111,000) and increase to at least $113,617 .
Second Target: $114,391
Cumulative Short Liquidation Leverage: $115,157-$114,599
Note: Stop Loss(SL): $110,100
Please respect each other's ideas and express them politely if you agree or disagree.
Bitcoin Analyze (BTCUSDT), 1-hour time frame.
Be sure to follow the updated ideas.
Do not forget to put a Stop loss for your positions (For every position you want to open).
Please follow your strategy and updates; this is just my Idea, and I will gladly see your ideas in this post.
Please do not forget the ✅' like '✅ button 🙏😊 & Share it with your friends; thanks, and Trade safe.
Bitcoin Short Setup _ Short-termBitcoin ( BINANCE:BTCUSDT ) has managed to break the Support zone($114,720-$113,570)/Now=Resistance zone and 50_EMA(Daily) , as I expected in the previous idea . And now it seems that Bitcoin is completing a pullback .
Also, on the 1-hour time frame , if you look closely, Bitcoin seems to be moving inside a descending channel .
In terms of Elliott wave theory , Bitcoin seems to be completing microwave 4 of the main wave 3 , so that microwave 4 could have an Expanding Flat structure(ABC/3-3-5) .
I expect Bitcoin to drop to at least $112,640 after completing the pullback ( microwave 4 of the main wave 3 ).
Second Target: $112,323
Cumulative Short Liquidation Leverage: $116,755-$115,778
Cumulative Short Liquidation Leverage: $114,500-$114,077
Cumulative Long Liquidation Leverage: $112,615-$111,743
Note: From today until Friday, important indexes will be released from the US, which can create excitement in financial markets, especially crypto, and even change the market trend when released.
Note: Most likely, after Bitcoin touches the Heavy Support zone($111,980-$105,820) and 100_SMA(Daily), we should wait for Bitcoin to bounce back (you might be able to look for a long position trigger in that zone).
Note: Stop Loss(SL): $114,823
Please respect each other's ideas and express them politely if you agree or disagree.
Bitcoin Analyze (BTCUSDT), 15-minute time frame.
Be sure to follow the updated ideas.
Do not forget to put a Stop loss for your positions (For every position you want to open).
Please follow your strategy and updates; this is just my Idea, and I will gladly see your ideas in this post.
Please do not forget the ✅' like '✅ button 🙏😊 & Share it with your friends; thanks, and Trade safe.
Bitcoin Moves Cautiously Below $118K📊 Market Overview:
Bitcoin is trading around $115,800, slightly lower as investors await the Jackson Hole Symposium, where the Fed may signal rate policy shifts. A stronger USD is adding short-term pressure on BTC.
📉 Technical Analysis:
• Key resistance: $118,500 – $119,000
• Next resistance: $120,000 – $121,500
• Nearest support: $115,000 – $114,500
• Stronger support: $112,500 – $113,000
• EMA: Price is still just below the EMA-09 → short-term bias remains corrective.
• Momentum: Lower volume, narrow candles → market in consolidation.
📌 Outlook:
Bitcoin is likely to consolidate between $115K – $118K, with a clear breakout above or below this range needed to define the next trend.
💡 Suggested Trading Strategy:
• SELL BTC/USD near $118,000
🎯 TP: $116,000
❌ SL: $119,500
• BUY BTC/USD near $115,000
🎯 TP: $117,000
❌ SL: $113,500

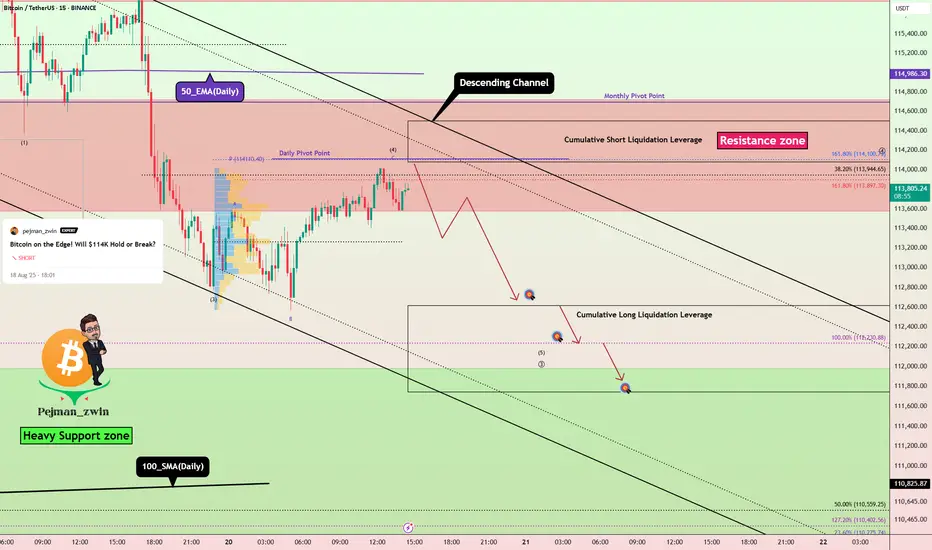
Bitcoin on the Edge! Will $114K Hold or Break?Bitcoin ( BINANCE:BTCUSDT ) started to decline from the Potential Reversal Zone(PRZ) as I expected in the previous idea .
Bitcoin currently appears to have managed to break the Support zone($116,900-$115,730) and is currently trading near the Support zone($114,720-$113,570) , 50_EMA(Daily) , Monthly Pivot Point , and Cumulative Long Liquidation Leverage($114,300-$113,841) .
In terms of Elliott Wave theory , it appears that Bitcoin is completing microwave 4 of the main wave 3 (probably), and we should expect a re-attack on the Support zone($114,720-$113,570) in the coming hours .
I expect Bitcoin to attack the Support zone($114,720-$113,570) at least once more after completing the pullback to the Support zone($116,900-$115,730) from Cumulative Short Liquidation Leverage($116,411-$115,760) and if it breaks , we should expect a drop to the Heavy Support zone($111,980-$105,820) .
Cumulative Short Liquidation Leverage: $120,115-$118,751
Note: Stop Loss(SL): $117,320
Please respect each other's ideas and express them politely if you agree or disagree.
Bitcoin Analyze (BTCUSDT), 1-hour time frame.
Be sure to follow the updated ideas.
Do not forget to put a Stop loss for your positions (For every position you want to open).
Please follow your strategy and updates; this is just my Idea, and I will gladly see your ideas in this post.
Please do not forget the ✅' like '✅ button 🙏😊 & Share it with your friends; thanks, and Trade safe.

Bitcoin Hits New ATH – Is This the Final Pump Before a Crash?Bitcoin ( BINANCE:BTCUSDT ) reacted well to the Potential Reversal Zone(PRZ) that I told you about in the previous idea and started to decline, but Bitcoin managed to create a new All-Time High(ATH=$124,474) in this rally.
Do you think Bitcoin can create a new All-Time High(ATH) again in the coming hours or should we wait for a main correction?
In terms of Elliott Wave theory , Bitcoin appears to have completed the main wave 5 in the Potential Reversal Zone(PRZ) , and we should expect corrective waves .
Also, we can see the Regular Divergence(RD-) between Consecutive Peaks .
Looking at the USDT.D% ( CRYPTOCAP:USDT.D ) chart, it also seems that with the breaking of the upper line of the descending channel, we can expect an increase in USDT.D% , which could cause a decrease in the price of Bitcoin .
I expect Bitcoin to at least move towards filling the CME Gap($118,600-$117,425) AFTER breaking the Support lines .
Cumulative Short Liquidation Leverage: $126,000-$124,367
Cumulative Long Liquidation Leverage: $118,000-$117,400
Note: Stop Loss(SL): $126,123
Please respect each other's ideas and express them politely if you agree or disagree.
Bitcoin Analyze (BTCUSDT), 1-hour time frame.
Be sure to follow the updated ideas.
Do not forget to put a Stop loss for your positions (For every position you want to open).
Please follow your strategy and updates; this is just my Idea, and I will gladly see your ideas in this post.
Please do not forget the ✅' like '✅ button 🙏😊 & Share it with your friends; thanks, and Trade safe.
This BTC Pullback Doesn’t Break the Bullish StructureYesterday, BTC dropped around 5% from its freshly printed intraday ATH, reaching a low of 117,300. Should bulls be worried?
In my view, this drop can’t be seen as more than just a correction — while it was indeed quite deep, the overall structure remains fully intact.
Price is still comfortably above the ascending trendline that started in April, and even higher than the nearest horizontal support.
Bottom line: As long as BTC stays above the 110–112k zone, there’s no real reason for concern.
For short-term traders, this dip could even be seen as a buying opportunity — anticipating a push towards a new ATH above 125k. 🚀