Eliana | BTCUSD – 30M – Intraday Market ConditionBITSTAMP:BTCUSD COINBASE:BTCUSD
After distribution near the 79,000–78,000 resistance range, BTC experienced a strong impulsive sell-off, confirming bearish dominance. The breakdown below 73,000 accelerated momentum toward the 69,000 liquidity pocket. Current bounce appears corrective rather than a trend reversal. As long as price remains below the broken structure and supply zones, overall bias stays bearish, with only intraday pullback opportunities for buyers.
Key Scenarios
❌ Bearish Case 📉 (Primary Bias) →
Rejection below 72,900 – 73,500 keeps sellers in control.
🎯 Target 1: 69,150
🎯 Target 2: 67,800
🎯 Target 3: 66,500
✅ Bullish Case 🚀 (Relief Bounce Only) →
Strong hold above 69,100 demand may trigger a corrective move.
🎯 Target 1: 72,900
🎯 Target 2: 75,000
🎯 Target 3: 76,800
(Bullish move is corrective unless structure flips)
Current Levels to Watch
Resistance 🔴: 72,900 – 76,800
Support 🟢: 69,100 – 67,800
⚠️ Disclaimer: This analysis is for educational purposes only. Not financial advice.
Btctechnicalanalysis

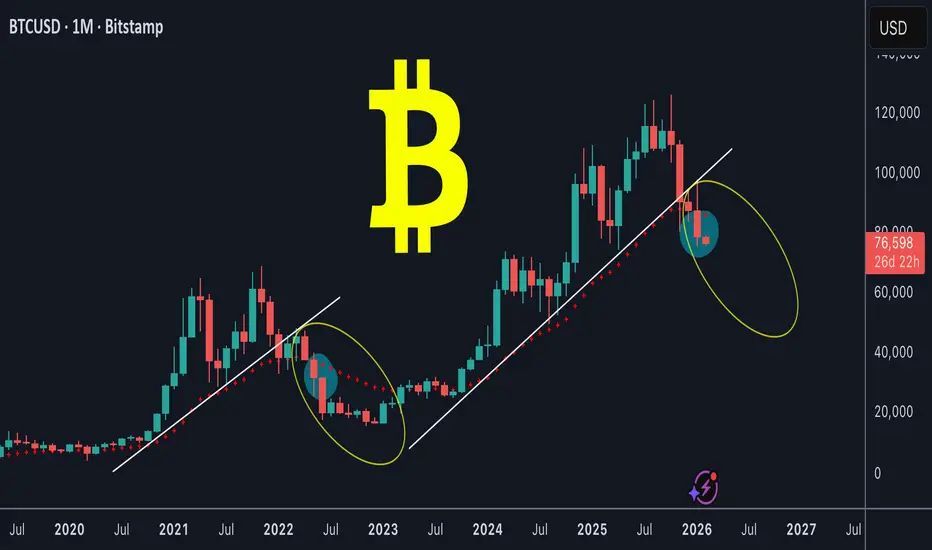
BTC monthly chart is bearishBTC / USD
I've been bearish on Bitcoin for the past 4 months (previous posts are attached below), and today we're seeing the price of Bitcoin continue to decline.
What is the current situation for Bitcoin (monthly chart)?
In short, Bitcoin has broken its upward trendline (white), as well as a very important EMA on the monthly chart (dashed red).
The current situation resembles the end of the bull market at 2022, and you can anticipate what will happen next by looking at my chart
Conclusion:
The current view on HTF is pure bearish
Bitcoin at $70k: Tech selloff, AI fears & the $55k riskBitcoin has dropped to the critical $70,000 psychological support, revisiting this level for the first time since November 2024. Following a massive sell-off in global tech stocks driven by fears over inflated AI valuations, risk sentiment has soured, dragging BTC down as the dollar strengthens.
In this video, we analyse the technical damage and explore two Elliott Wave scenarios that suggest a bounce is imminent—but the long-term implications differ significantly.
Key topics covered :
The trigger : How the route in Alphabet, Qualcomm, and ARM Holdings sparked a risk-off environment, pushing BTC to test the 50% retracement of the entire 2022-2025 bull run.
The bullish structure (Flat pattern): We break down the potential "expanded flat" correction. If the current drop is a 5-wave impulse (Wave C), we may have just completed the structure. However, losing $70k opens the door to the 61.8% extension at $58k.
With the daily RSI at 20 (levels not seen since August 2023) and price hitting a 2-standard-deviation channel support, an oversold bounce is probable.
The bearish structure (Ending Diagonal) : A rejection at $80k–$100k could confirm an Ending Diagonal, signalling a much deeper correction towards $40k later this year.
Critical levels to watch :
Support : $70k is the line in the sand. Below that, we look at $64k and the "Golden Pocket" at $52k-$55k.
Resistance : A bounce needs to clear $80k (previous support) and $98k-$100k to confirm a bullish reversal.
Are we seeing a bottom at $70k, or is this just Wave A of a larger crash? Let us know in the comments!
This content is not directed to residents of the EU or UK. Any opinions, news, research, analyses, prices or other information contained on this website is provided as general market commentary and does not constitute investment advice. ThinkMarkets will not accept liability for any loss or damage including, without limitation, to any loss of profit which may arise directly or indirectly from use of or reliance on such information.

BitcoinBTCUSD
- Bearish Channel as an corrective pattern in Short Time Frame
- Fair Value Gap
- Order Block
- Support Level
- RSI - Divergence

BTCUSD – Bullish Reversal Zone IdentifiedBitcoin is holding above the key demand area and showing signs of a bullish rebound.
As long as price stays above support, upside continuation toward 80,000 remains in focus. Pullback completed Structure forming Upside potential active

You will ask, "how did he know Btc would crash to $60K"?On Saturday January 31st I suggested that Btc would crash (from current price at $78,716) to $60K (+/- $2K). This target at $60K (T2) was hit today.
I expect a significant bounce from here, as I often see when long term WTs are hit. There is another WT target just below at $52,683 (+/- $2K). This target may get hit on this dump, or possibly after a significant pump first. As always, I'm not trying to predict time, but these targets are accurate.
Congrats to everyone that set buy orders at T2, as Btc is already up 8% in the last hour, and we are safely under the trade with stops at break even. If T3 gets hit I'm going in even heavier.
May the trends be with you.

BTC Multi-Timeframe Trading PlanWeekly Timeframe (Macro Bias & Swing Context )
On 17 December 2025, I shared the BTC weekly chart and clearly outlined what was likely to unfold. Congratulations to those who followed the analysis.
Price is mirroring the 2022 breakout pattern → expecting accumulation and breakout by mid-2025, with 2026 as a potential cycle expansion phase.
I’ve now updated the BTC weekly chart with additional confluences, highlighting two key upcoming support zones:
Swing Zone (liquidity Sweep possibilities): 65k – 68k
Retracement Zone: 56k – 60k
Comparison: 2022 vs 2026 setups
The 2022 structure marked on chart shows BTC breaking out from a falling trendline post large retracement, leading to multi-month rally.
The 2026 comparative zone mimics that exact setup — short-term liquidity sweep below support, confluence with OB + retracement zone, then structural breakout.
Key Observations
Trend Bias: Bullish macro cycle — higher highs and higher lows.
Structure: Re-Accumulation phase above 50W EMA & long-term ascending trendline.
Important Levels:
Demand / OB Zone: 55K–60K
Strong Support: 70K–73K
Resistance/FVG: 88K–92K → 110K–125K
Weekly Bias:
→ Bullish Re-Accumulation.
→ Enter dips near 70K–73K; accumulate for 90K+ breakout.
Weekly Swing Route Map
Entry: On Retrace Zone to 68K–73K OR breakout close above 80K.
Stop Loss: Below 65K (key structural invalidation).
Targets:
TP1 = 90K (FVG fill)
TP2 = 110K+ (cycle expansion zone)
Hold Duration: 2–8 weeks.
Integrated Setup (Multi Time Frame)
Example
1️⃣ On 4H: Look for a liquidity sweep under 75K (fake out wick) and bullish engulfing to close back above 75.5K.
→ Enter partial long with tight SL (74.5K).
2️⃣ On 1D: Add position when daily candle closes above 78K (bullish structure confirmation).
3️⃣ On 1W: If weekly closes strong >$80K, hold remaining position for macro target 90K–110K.
Trade with cautious. Trade is involved RISKs. This is not a trading Signal, its pure technical analysis based on many confluences marked.
Follow our page for more updates on GOLD, NASDAQ and BTC
The Quantum Trading Mastery

BTC ANALYSIS CRITICAL ZONE!!!High timeframe: Weekly chart
We have entered the zone of the previous highs of 66700-72500 $. It was here when large volumes entered the BTC before the impulse to $100K. Such areas are rarely left without reaction.Therefore, the probability of that very rebound from here is now increased 🔥 Anyway, I'd recommend everyone to avoid trading crypto futures, but spot? It's a perfect price when you can start accumulating BTC at low prices. I additionally checked USDT.D, one of the main indicators which can tell us about reversals on BTC. The dominance of stables has reached serious resistance, while the BTC is near to a global support zone. Panic and frustration among crypto traders are reaching critical levels. There's a high probability of seeing a reversal at hese levels. We don't have almost any liquidity below $70000... Also, if you apply the Fibonacci retracement on the chart from the lowest level to the highest point, you'll find out that 0,5 level is at $70000 which according to Fibonacci rules is one of the strongest zones for reversal. Furthermore the price touched EMA-200 level on weekly chart where usually most assets bounce back from these zones. We still have three days left in the week, so there’s plenty of time for BTC to recover by at least $4,000–$5,000. Eventually, BTC.D is showing a bearish pattern right now which may indicate about the beginning of rotation of BTC liquidity to altcoins. Personally, I’m still holding the majority of my altcoin positions. I haven’t liquidated my portfolio because I see this phase as structural accumulation, not distribution. My longer-term benchmark remains much higher, I’m not even considering major portfolio exits until I see ETH approaching the $7,000...

BTCUSDHey what do you think about BTCUSD ?
If this post was useful to you, do not forget to like and comment

BTC Most Likely Scenario -- 98K -> 70KBTC Most Likely Scenario -- 98K -> 70K
Probability for BTC next move is to go to 98k-100k level. Then go take the liquidity between 70-74k. We probability will make a bullish divergence on that level. Will see then if we make a LH in upcoming months or another ATH.

Pause, then drop — BTC won’t stop Back in October, I shared my view:
BTC below 81K, with a deeper move toward 60K.
So far, price action is following this path step by step.
After several days of strong selling pressure, Bitcoin is taking a technical pause — a normal cooldown before the next move.
What I’m watching right now 👀
• A short-term push into the 84,000–84,500 area
• This zone looks like a potential resistance
• From there, I expect continuation to the downside and a new local low
My downside targets 🎯
Breaking the move into clear steps:
• 🥇 Target 1: 80,000
• 🥈 Target 2: 78,000
• 🥉 Target 3: 73,000 and potentially lower
Between these levels, short consolidations are possible before the next leg down.
Trade idea (my personal plan) 🧠
• 📍 Short area: 84,000–84,500
• ⛔ Stop: 84,700
A move into this zone does not cancel the bearish structure,
but it defines risk and adjusts positioning.
Invalidation zone ⚠️
• ❌ 84,700
As long as price stays below this level, the bearish structure remains valid.
For now, momentum stays on the downside.
Watching reactions at resistance before the next impulse. 🐻📉

#BTC/USD Sell Trade Scenario.Here’s an up-to-date BTC/USD Sell trade outlook (technical + fundamental) to help you assess whether positioning for a Downside makes sense right now.
Thank You......

Chart Analysis & Trading Idea (Gold / XAUUSD – 15 min)Price is in an overall bearish structure (lower highs & lower lows).
After a strong drop, price made a pullback into the marked upper demand / supply area (actually acting as resistance now).
The highlighted Demand Zone above has already been tested and rejected, showing selling pressure.
Current price action suggests weak bullish momentum and potential trend continuation to the downside.
Trading Idea:
Sell from the upper zone / resistance area if price shows rejection (bearish candle, wick, or structure break).
Targets:
First target: Lower demand zone
Extended target: Below the demand zone if momentum increases
Stop Loss:
Above the upper zone / recent high
Bias:
📉 Bearish – sell on pullback
If you want, I can also:

BTC | Dead Cat Bounce...You know what it is?Hello traders,
They say "even a dead cat will jump one more time if it falls too hard"
If you don’t know what a dead cat bounce is, this is not the environment to learn it the hard way. This is actually a classic bear market behavior.
That bounce feels super bullish. It breaks market structure. It gives all bullish signs. Looks constructive, and traps late longs. But structurally, nothing has changed. The bear market is only beginning.
In bear markets, rallies are designed ONLY to create hope. They exist to rebalance, mitigate liquidity, and offer smart money better short entries.
----------------------------------------------------------------------------------
Take what happened in March, 2022 as an example
Triple resistance rejections, followed by a break of structure, followed by a dead cat bounce. Then, bearish continuation...
----------------------------------------------------------------------------------
I have published an idea here on TV back in Nov, 2025 and it went super viral that everyone now adopts in on X
This dead cat bounce will confirm my thesis. From current prices to ~105-108k are PERFECT swing short entries.
----------------------------------------------------------------------------------
When and ONLY when price breaks $108k and holds, my thesis will change to bullish. But, I dont reckon.
Good Luck!
Please support this idea with a like and share your thoughts down in the comments.

BTC at Daily SBR — Smart Money Trap or Clean Breakdown ?
Most traders panic here.
I don’t.
Bitcoin is reacting exactly from a Daily Supply-to-Break-and-Retest (D1 SBR) zone.
This is not a random sell — this is market structure doing its job.
🧠 What I’m Watching (Not Hoping):
Strong impulsive bearish leg → HTF control confirmed
Pullback into D1 SBR zone → textbook short location
Lower timeframe weakness → distribution, not accumulation
Liquidity taken above minor highs → trap confirmed
🎯 Trade Plan (Clear & Mechanical):
Entry: Rejection + LTF confirmation inside SBR
Stop-Loss: Above D1 structure (invalid idea = exit fast)
TP1: Internal liquidity
TP2: Major demand / imbalance fill
No indicators.
No prediction.
Only structure, liquidity & execution.
📌 If price breaks and holds above the SBR — I’m wrong and I’m out.
That’s how professionals survive.
---
⚠️ Reality Check:
If you trade emotions, this market will humble you.
If you trade structure, the market becomes predictable.
👉 Follow for clean structure-based analysis
👉 Comment if you want the lower-timeframe execution breakdown
Capital protection > Ego.

A map to Bitcoin's short term price action: A thought experimentYesterday I suggested that Btc would soon swipe the local $80K bottom. As anticipated, that happened today. Here's what I expect to happen next. The targets are accurate, yet the arrows (representing time) are simply a thought experiment based on historical price action patterns.
Trade safely and use proper risk management. The way down is designed for us to fall our swords.
May the trends be with you.

You will ask "how did he know Btc would get rejected at $98K"?On Nov 30th 2025 I suggested that Btc had bottomed at 80K & would bounce up to $98-99K and get rejected.
Target hit as anticipated and now Btc is now heading down to swipe the 80K lows as it always does after a long term WT has be hit.
Congrats to all that followed and caught the 22% pump (and was able to get out at 98K).
May the trends be with you.

#BTC/USD Buy Trade Scenario.Here’s an up-to-date BTC/USD Buy trade outlook (technical + fundamental) to help you assess whether positioning for a Upside makes sense right now.
Thank You......

#BTC/USD Sell Trade Scenario.Here’s an up-to-date BTC/USD Sell trade outlook (technical + fundamental) to help you assess whether positioning for a Downside makes sense right now.
Thank You......

BTC analysis 01.26.2026After touching the $95000 level, and even higher a block of liquidity of short traders, we trigerrred their stop-losses, it's noticeable according to how fastly the candle was moving at that moment... Right now, we see a reversal trend from key level and bearish candles on 4-hour timeframe which can lead to break of strong support level on $90000. There's still a lot of liquidity in low levels because if we take a look at higher level, we can see that most short traders were already liquidated... and there's nothing left to clear the market from overleveraged short traders. Funding rate is mostly negative which tells us about the market sentiment, people don't believe in growth and they bet on fall. Also, we can see a huge bearish flag on the 4-hour timeframe that usually is filled in most 90% situations, so it's just a matter of the time when we will reach $82000-$80000 support levels. I'd try to trade from only short zones to catch small moves around $1500-$2000. If you're still not sure about this current setup, you can just wait for a more clearer scenario. Most traders feel dissapointed because of the altseason, and now they started betting against the growth. There are a lot of factors which indicate about upcoming bullish cycle. Trump family is still buying BTC, let alone ETFs inflow started growing also, it's essential to keep an eye on IBIT ETF (BLACKROCK ETF), thanks to this you can find at what moment the growth of entire crypto market might start.

BTCUSD Market Structure Explained. Liquidity Above, Demand BelowHello traders,
I will keep this simple and structural because structure matters the most, right?
On the 6H timeframe, BTC is trading inside an ascending channel. As we see higher lows and consistent demand.
At the same time, price has been rejected multiple times from the channel upper trendline to sweep sell side liquidity.
This creates compression
As long as BTC holds this demand and maintains this bullish structure, this sets the stage for bullish continuation.
I previously stated multiple times that BTC could push toward the 100K+ region. This very chart could be the start of this move.
You should know that price reacts to structure, liquidity, and range expansion.
TL;DR: Overall bearish market 2026 | Short-term: Bullish relief rally
Good Luck!
If you find value in this content, a like supports more than anything🙏📊
Also, leave your comments and thoughts below.

BTC Market AnalysisBitcoin has swept liquidity around the 87,436 support zone, indicating a potential stop-hunt and accumulation by smart money. Price reaction from this area suggests that buyers are still active and defending the zone.
As long as BTC holds above the 85,930 invalidation level, the bias remains bullish. A continuation move is expected from the same demand area, targeting higher liquidity pools.
Trade Plan
Buy Zone: Around 87,436 (post-support sweep)
Stop Loss: 85,930
Targets:
TP1: 89,930
TP2: 91,930
TP3: 93,930
If bullish momentum sustains and higher-timeframe structure remains intact, buyers’ extended target lies near 97,778, where major liquidity is resting.
⚠️ Follow proper risk management and wait for confirmation before entry

#BTC/USD Buy Trade Scenario.Here’s an up-to-date BTC/USD Buy trade outlook (technical + fundamental) to help you assess whether positioning for a Upside makes sense right now.
Thank You......
