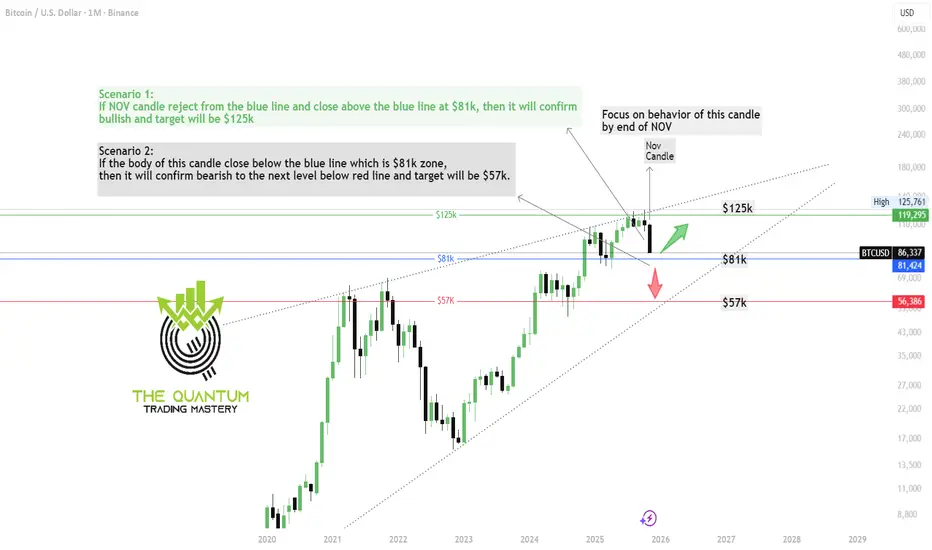
BTC Monthly Chart Technical AnaylsisDear Traders,
As expected from our previous weekly chart analysis, BTC has reached the $80K zone and has now successfully tapped $86K.
At this stage, the monthly candle is extremely important. I’ve shared the November candle—watch the closing carefully, because a major opportunity could be forming.
Trade smart, stay cautious, and if you find this update valuable, please show your support by boosting the post and dropping a comment.
The Quantum Trading Mastery
Btctechnicalanalysis
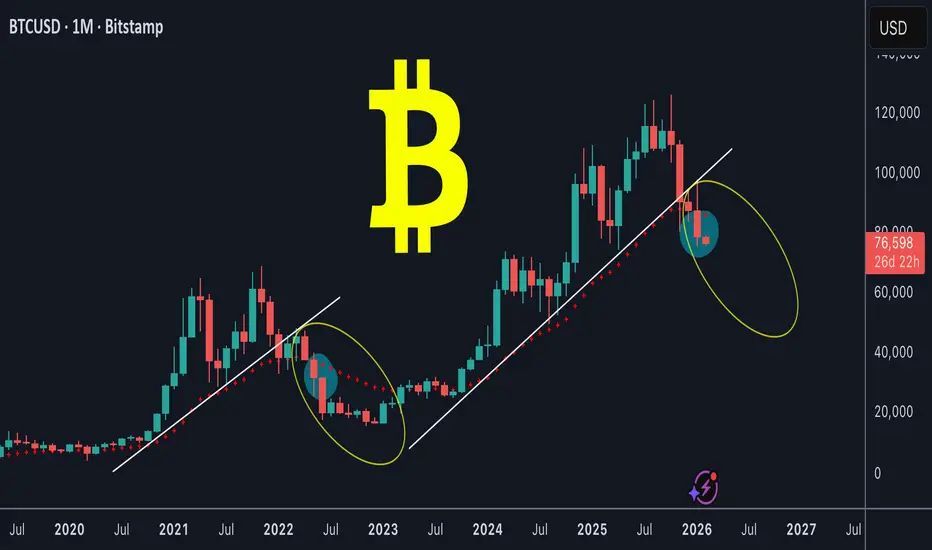
BTC WEEKLY CHART TRADING PLAN ROUTE MAPDear Traders,
Take a look at the BTC weekly chart—I’ve clearly marked all the key areas for you.
As you can see the weekly trendline is already broken which confirms bearish.
It appears that BTC may be repeating a familiar pattern heading into 2026. Compare the area highlighted with the orange circle in 2022 to the orange circle marked for 2026.
In 2022, price retested the trendline and formed a bull trap, where many buyers were likely caught. Price was then rejected from that zone, printed a bearish engulfing candle, the EMA 20 crossed below the EMA 50, and a strong bearish move followed to the downside.
If the EMA 20 crosses below the EMA 50, price is likely to revisit the EMA 200 (shown by the purple line) as a key support zone, where a bounce can be expected. Following that bounce, BTC could potentially break above the previous high around $125K and, if momentum continues, most likely extend toward the $150K region.
This chart is shared to give you a heads-up on potential traps ahead.
On the other hand, if the EMA 20 does not cross below the EMA 50 and candle bar closes above the trendline, it would confirm bullish trend continuation without a deeper pullback.
Its Important to practice patience, and risk management.
The Quantum Trading Mastery

BTC Multi-Timeframe Trading PlanWeekly Timeframe (Macro Bias & Swing Context )
On 17 December 2025, I shared the BTC weekly chart and clearly outlined what was likely to unfold. Congratulations to those who followed the analysis.
Price is mirroring the 2022 breakout pattern → expecting accumulation and breakout by mid-2025, with 2026 as a potential cycle expansion phase.
I’ve now updated the BTC weekly chart with additional confluences, highlighting two key upcoming support zones:
Swing Zone (liquidity Sweep possibilities): 65k – 68k
Retracement Zone: 56k – 60k
Comparison: 2022 vs 2026 setups
The 2022 structure marked on chart shows BTC breaking out from a falling trendline post large retracement, leading to multi-month rally.
The 2026 comparative zone mimics that exact setup — short-term liquidity sweep below support, confluence with OB + retracement zone, then structural breakout.
Key Observations
Trend Bias: Bullish macro cycle — higher highs and higher lows.
Structure: Re-Accumulation phase above 50W EMA & long-term ascending trendline.
Important Levels:
Demand / OB Zone: 55K–60K
Strong Support: 70K–73K
Resistance/FVG: 88K–92K → 110K–125K
Weekly Bias:
→ Bullish Re-Accumulation.
→ Enter dips near 70K–73K; accumulate for 90K+ breakout.
Weekly Swing Route Map
Entry: On Retrace Zone to 68K–73K OR breakout close above 80K.
Stop Loss: Below 65K (key structural invalidation).
Targets:
TP1 = 90K (FVG fill)
TP2 = 110K+ (cycle expansion zone)
Hold Duration: 2–8 weeks.
Integrated Setup (Multi Time Frame)
Example
1️⃣ On 4H: Look for a liquidity sweep under 75K (fake out wick) and bullish engulfing to close back above 75.5K.
→ Enter partial long with tight SL (74.5K).
2️⃣ On 1D: Add position when daily candle closes above 78K (bullish structure confirmation).
3️⃣ On 1W: If weekly closes strong >$80K, hold remaining position for macro target 90K–110K.
Trade with cautious. Trade is involved RISKs. This is not a trading Signal, its pure technical analysis based on many confluences marked.
Follow our page for more updates on GOLD, NASDAQ and BTC
The Quantum Trading Mastery

Bitcoin 30M Ascending Channel | Buy the Pullback SetupStrong impulse from channel support
Break above minor consolidation
Currently sitting near upper channel resistance
No bearish shift yet (no lower low formed)
This is still a bullish continuation environment.
📈 Bullish Scenario (Primary Bias)
✅ Entry Zone
Around 70,050 – 70,150 (your marked entry area)
Best entry = pullback, not chasing highs.
🎯 Targets
TP1: 71,208
TP2: 71,755
If strong breakout above 71,800 → continuation toward 72K+ possible.
Momentum favors upside as long as channel holds.
🛑 Stop Loss
Conservative: below 69,678
Safer structural SL: below 69,622
Full structure invalidation: below 69,500
If price breaks below 69,622 and closes strong, that’s a warning of deeper retracement.
🔵 Key Support Zone
69,600 – 70,000
This is demand + mid-channel support.
If price pulls back into this zone and holds → high-probability continuation.
⚠ Bearish Scenario (Only If)
Rejection at channel top
Strong bearish candle closing below 69,622
Break of ascending structure
If that happens, next downside liquidity sits around:
65,758
65,715 zone
But right now? That’s secondary.
Overall Bias: Buy the Pullback in an Ascending Channel
This is not a breakout chase setup — it’s a structure respect setup.

BTC Stalling Under Resistance — $63K Next?CRYPTOCAP:BTC quick update if you’re watching price right now 👇
#Bitcoin is still stuck under the same downtrend line. Every bounce into it keeps getting sold, which tells me this move is still weak.
We’re going sideways here, but honestly… this looks more like a pause than a real reversal.
If this range gives way, I wouldn’t be surprised to see $65K–$63K next.
For this to flip bullish, BTC needs to break and hold above the trendline. Until that happens, caution makes sense.
Let’s see how this level plays out.
DYOR, NFA

Poor Again” Signal Reloaded? CZ’s Old Tweet, New Cycle & $250k “Poor Again” Signal Reloaded? CZ’s Old Tweet, New Cycle & a $250K Bitcoin Theory ..
When CZ says “Poor again,” the market remembers.
This isn’t hype — it’s pattern recognition.
📅 January 25, 2022
CZ tweeted “Poor again” while BTC traded around $35.7K–$37.5K. Price dipped first, then staged a short rally… before collapsing hard and eventually launching one of the strongest bull runs in history.
📅 February 5, 2026
CZ repeats the same tweet, clearly referencing 2022. BTC had just tapped a local low near $60K.
Last cycle roadmap after the tweet:
➡️ +45% rally in ~2 months
➡️ -67% deep correction over months
➡️ +740% multi-year bull run to $126K
If the fractal rhymes again:
🔹 Phase 1 (next ~2 months): Relief rally to $87K–$90K
🔹 Phase 2 (late 2026): Heavy correction to $27K–$35K — a possible long-term accumulation zone
🔹 Phase 3 (2029): Expansion toward $250K
⚠️ This is fractal analysis, not financial advice.
Markets don’t copy-paste, but history often rhymes.
CZ’s timing has been interesting before — worth keeping these levels on the radar.
Always DYOR. 📊
BINANCE:BTCUSDT

BTCUSD 15M: Accumulation Below 70K – Breakout or Rejection?Price is ranging just under a key resistance zone around 69,800 – 70,000. We can clearly see:
Previous high liquidity sweep (circled top)
Strong sell-off → market structure shift
Now forming a tight consolidation above support
This is classic accumulation below resistance.
🔵 Key Levels
Resistance:
69,800 – 70,000 (major intraday supply)
Above that → 70,800 – 71,200 (next liquidity pool)
Support:
69,300 – 69,350 (current demand zone)
68,950
68,450 (stronger 15M support)
🟢 Bullish Scenario (Preferred for now)
If price holds above 69,300 zone and breaks 69,800 with strong momentum:
Targets:
🎯 TP1: 70,000
🎯 TP2: 70,800
🎯 TP3: 71,200
Stop Loss: Below 68,950 (safer below 68,450 for swing hold)
The structure is slightly bullish because:
Higher lows forming
Price holding above mid MA
Consolidation under resistance usually means breakout pressure building
🔴 Bearish Scenario
If price fails to break 69,800 and loses 69,300 support:
Targets:
🎯 68,950
🎯 68,450
🎯 67,800 (if momentum increases)
That would confirm distribution instead of accumulation.
📌 Overall Bias
Short-term: Bullish above 69,300
Breakdown only if that support flips.
This setup looks like it’s loading energy for a push — but we need confirmation candle above resistance, not just a wick.

BTCUSD Daily – Bearish Breakdown & Sell-the-Retests Setup
Here’s what the chart is saying, clean and to the point:
Market Structure
Clear distribution → breakdown sequence on the daily.
Price topped near the mid-90Ks, rolled over, and lost the 83–84K demand zone (former support marked in blue).
That loss flipped market structure firmly bearish.
Key Levels
Major breakdown level: ~83–84K (prior demand → resistance)
Supply / entry zone: ~72–74K (blue zone labeled “entry”)
Current support: ~67.4K (thin blue line)
Primary target: ~60–62K (grey demand zone)
Price Action Logic
The vertical sell-off into ~67K suggests impulsive bearish strength, not exhaustion.
The projected path shows a dead-cat bounce / consolidation into ~72–74K.
That zone aligns with:
Prior consolidation
Bearish retest logic
Likely supply from trapped longs
Trade Thesis (as illustrated)
Bias: Short
Entry idea: Sell a rejection in the 72–74K zone
Invalidation: Strong daily close back above ~75K
Target: 60–62K demand (first meaningful higher-timeframe support)
Big Picture
Unless BTC reclaims the 80K+ region quickly, this chart favors continuation lower, not a V-shaped recovery. The structure says rallies are for selling, not buying.

Smart Money Is Accumulating Bitcoin — Massive Move IncomingHi Traders ! BTCUSD was in a clear short-term downtrend but has now formed a strong reversal structure after bouncing from a key support zone around 64K–66K. Price is reclaiming momentum and pushing above minor resistance, signaling fresh bullish pressure.
A continuation move toward the next major resistance area is highly probable, marked as the TAKE PROFIT zone at 76,355.
📈 Long Setup
Entry: 70,035
Stop Loss: 64,165
Take Profit: 76,355
Momentum is shifting bullish — buyers are stepping back into the market. Time to go LONG on BTCUSD.
⚠️ This content is for educational purposes only, not financial advice. Trade at your own risk and manage your capital wisely.

BTC actually Bullish IMOI get everyone is bearish on BTC and for all the right reasons. It lost support after support. But if you check supply profit/loss we are in a stage where honestly I really DONT SEE how whales and institutions will not fill their bags at this low prices similar to december 2018. Its common sense IMO. For me, this looks very bullish.

Btc - Btc hits my T1 - bounce (to $71,500) is hitting resistanceHere is more granular look at price action. This is a copy of the 1 Day time frame chart I posted earlier today. But now I'm looking at the hourly now because Btc is moving faster then normal through this historical pattern. This crash from the high, has been one of the fastest moving crashes (through each of the signifiacnt moving averages). Faster then any other cycle.
Same pattern, different velocity, so it may look different then other cycles, but my expectation is the same. Btc is bottoming either at yesterdays low of $60K or possibly swipe the lows down to $48K-$50K (my money is on this lower low).
May the trends be with you.

Bitcoin -Is $60K the bottom...or $48K next...before lift off?On Jan 31st I suggested that Btc would dump to $60K (+/- 2K)...and then possibly to $48K-$52K. I was incorrect in my thought experiment about the typical price action pattern it would take. I did not anticipate a capitulation event. Noone can. Either way, I claimed that the targets (T2 and T3) were accurate bottoms, regardless of the path taken to get there.
Now that T2 was hit at $60K (during a 32% capitulation), I am suggesting that there is a historical price action that is associated with capitulation events at this point in the cycle (based on moving averages). I have calculated these targets carefully, as I believe this could be the low. Whether it's a local low or the market cycle bottom, is yet to be determined. But I'm already all in at T2 with a stop at break even.
*If T3 (48K-52K) gets hit, I'm backing up the money truck and loading up on Btc (and Coinbase stock).
May the trends be with you.

Intraday Long Setup on BTCUSD | 4% Upside PotentialBitcoin formed a sharp V-reversal from the 60K zone and is now moving inside a well-respected rising channel. We’ve got:
Higher highs
Higher lows
Clean bullish momentum
Break above short-term descending resistance
That shift from bearish pressure to structured bullish recovery is important.
🔵 Key Levels
Entry Zone: 66,300 – 67,000
Price is consolidating above this demand block after a breakout retest. This is healthy accumulation behavior.
Stop Loss: 66,399 (below structure + channel support)
If this level breaks cleanly, bullish structure weakens.
Target: 70,800 – 71,000
Measured move from the channel + previous resistance liquidity.
Projected move ≈ 4.3% upside.
🧠 Scenarios
✅ Bullish Continuation (Primary Bias)
Hold above 66,300
Minor consolidation
Break above 68K
Expansion toward 70.8K target
Momentum currently favors buyers.
⚠️ Bearish Risk
Strong rejection near 68K
Break below 66,300
Channel failure
Pullback toward 64K zone
🎯 Bias
Intraday bullish while above 66K structure.
The channel is clean, momentum is controlled, and buyers are defending support properly.

BTC next projected ATHBTC next projected ATH.
BTC probably should see bottom between 56-58k (0.618 fib retracement) as a bear bottom bear of this year. We should go in a parabolic move from here now to 190-194k (-0.618 fib extension).
Let's see

BTCUSD — 0.5 Fibonacci Rejection + 4H FVG | Smart Money Retracem
Bitcoin is currently reacting inside a key premium zone where 0.5 Fibonacci retracement aligns with a 4H Fair Value Gap — a classic area where continuation sellers step back into the market. The recent bounce shows corrective structure, not a confirmed trend reversal.
🧠 Market Structure:
• Strong bearish displacement still intact
• Pullbacks forming weak higher highs
• Price approaching confluence zone (0.5 Fib + 4H FVG)
• Liquidity resting below current range inside demand area
📉 Bearish Plan:
If price taps the premium zone and shows rejection, the probability favors continuation toward the lower demand zone. This move would target resting liquidity and rebalance inefficiencies left by the previous impulse.
⚠️ Invalidation:
Clean acceptance above the FVG zone shifts bias neutral-to-bullish. No confirmation — no trade.
This idea is built on structure, liquidity, and patience — not prediction.
If you’re tracking the same zone, share your view below and let’s compare perspectives.

You will ask, "how did he know Btc would crash to $60K"?On Saturday January 31st I suggested that Btc would crash (from current price at $78,716) to $60K (+/- $2K). This target at $60K (T2) was hit today.
I expect a significant bounce from here, as I often see when long term WTs are hit. There is another WT target just below at $52,683 (+/- $2K). This target may get hit on this dump, or possibly after a significant pump first. As always, I'm not trying to predict time, but these targets are accurate.
Congrats to everyone that set buy orders at T2, as Btc is already up 8% in the last hour, and we are safely under the trade with stops at break even. If T3 gets hit I'm going in even heavier.
May the trends be with you.

BTC ANALYSIS CRITICAL ZONE!!!High timeframe: Weekly chart
We have entered the zone of the previous highs of 66700-72500 $. It was here when large volumes entered the BTC before the impulse to $100K. Such areas are rarely left without reaction.Therefore, the probability of that very rebound from here is now increased 🔥 Anyway, I'd recommend everyone to avoid trading crypto futures, but spot? It's a perfect price when you can start accumulating BTC at low prices. I additionally checked USDT.D, one of the main indicators which can tell us about reversals on BTC. The dominance of stables has reached serious resistance, while the BTC is near to a global support zone. Panic and frustration among crypto traders are reaching critical levels. There's a high probability of seeing a reversal at hese levels. We don't have almost any liquidity below $70000... Also, if you apply the Fibonacci retracement on the chart from the lowest level to the highest point, you'll find out that 0,5 level is at $70000 which according to Fibonacci rules is one of the strongest zones for reversal. Furthermore the price touched EMA-200 level on weekly chart where usually most assets bounce back from these zones. We still have three days left in the week, so there’s plenty of time for BTC to recover by at least $4,000–$5,000. Eventually, BTC.D is showing a bearish pattern right now which may indicate about the beginning of rotation of BTC liquidity to altcoins. Personally, I’m still holding the majority of my altcoin positions. I haven’t liquidated my portfolio because I see this phase as structural accumulation, not distribution. My longer-term benchmark remains much higher, I’m not even considering major portfolio exits until I see ETH approaching the $7,000...

BTCUSDHey what do you think about BTCUSD ?
If this post was useful to you, do not forget to like and comment

BTC monthly chart is bearishBTC / USD
I've been bearish on Bitcoin for the past 4 months (previous posts are attached below), and today we're seeing the price of Bitcoin continue to decline.
What is the current situation for Bitcoin (monthly chart)?
In short, Bitcoin has broken its upward trendline (white), as well as a very important EMA on the monthly chart (dashed red).
The current situation resembles the end of the bull market at 2022, and you can anticipate what will happen next by looking at my chart
Conclusion:
The current view on HTF is pure bearish
BitcoinBTCUSD
- Bearish Channel as an corrective pattern in Short Time Frame
- Fair Value Gap
- Order Block
- Support Level
- RSI - Divergence

Bitcoin at $70k: Tech selloff, AI fears & the $55k riskBitcoin has dropped to the critical $70,000 psychological support, revisiting this level for the first time since November 2024. Following a massive sell-off in global tech stocks driven by fears over inflated AI valuations, risk sentiment has soured, dragging BTC down as the dollar strengthens.
In this video, we analyse the technical damage and explore two Elliott Wave scenarios that suggest a bounce is imminent—but the long-term implications differ significantly.
Key topics covered :
The trigger : How the route in Alphabet, Qualcomm, and ARM Holdings sparked a risk-off environment, pushing BTC to test the 50% retracement of the entire 2022-2025 bull run.
The bullish structure (Flat pattern): We break down the potential "expanded flat" correction. If the current drop is a 5-wave impulse (Wave C), we may have just completed the structure. However, losing $70k opens the door to the 61.8% extension at $58k.
With the daily RSI at 20 (levels not seen since August 2023) and price hitting a 2-standard-deviation channel support, an oversold bounce is probable.
The bearish structure (Ending Diagonal) : A rejection at $80k–$100k could confirm an Ending Diagonal, signalling a much deeper correction towards $40k later this year.
Critical levels to watch :
Support : $70k is the line in the sand. Below that, we look at $64k and the "Golden Pocket" at $52k-$55k.
Resistance : A bounce needs to clear $80k (previous support) and $98k-$100k to confirm a bullish reversal.
Are we seeing a bottom at $70k, or is this just Wave A of a larger crash? Let us know in the comments!
This content is not directed to residents of the EU or UK. Any opinions, news, research, analyses, prices or other information contained on this website is provided as general market commentary and does not constitute investment advice. ThinkMarkets will not accept liability for any loss or damage including, without limitation, to any loss of profit which may arise directly or indirectly from use of or reliance on such information.

BTCUSD – Bullish Reversal Zone IdentifiedBitcoin is holding above the key demand area and showing signs of a bullish rebound.
As long as price stays above support, upside continuation toward 80,000 remains in focus. Pullback completed Structure forming Upside potential active

BTC Most Likely Scenario -- 98K -> 70KBTC Most Likely Scenario -- 98K -> 70K
Probability for BTC next move is to go to 98k-100k level. Then go take the liquidity between 70-74k. We probability will make a bullish divergence on that level. Will see then if we make a LH in upcoming months or another ATH.
