BTC Daily View 17.11Hey friends! How’s your trading week starting off?
In my last Bitcoin post, I shifted my invalidation zone from 96,600 to 95,545 and said that if 95,545 breaks, then 96,600 won’t hold either.
Well… it broke — so I revisited the chart.
Now I think the correction after the drop should be bigger than I first expected.
For now, I’m looking at a move up toward 98,400, and then a possible continuation of the downtrend.
I still see two paths — along the orange and purple arrows.
❌ Invalidation zone: 94,850
⚠️ Not financial advice — just sharing my view.
Trade your own plan, always use stops.
⭐ Follow for updates
💬 Drop a reaction in the comments!
Btctechnicalanalysis

BTC on the brink of explosion: Wave 5 is charged –BTC on the brink of explosion: Wave 5 is charged – those who are not up are late.
🌀 Wave Structure
On the weekly chart, BTC is forming a major impulse, where:
Wave 3 is already complete (characteristic super-sharp rise + volume extremes).
The market is now in the area of wave 4—an extended correction moving sideways.
Wave 5—the next wave in the cycle—is preparing to launch but requires confirmation through a resistance breakout.
The correction looks like this:
A–B–C (flat correction or sideways zigzag)
Wave A—a sharp decline.
Wave B—a rebound without breaking the high.
Wave C—a fading decline/flat.
This is a classic pattern before the start of the final impulse.
📍 Key Resistance Levels
$71,500—the main trigger level for wave 5.
A breakout opens the way for a trend acceleration.
$75,000—the boundary of a new impulse zone. Support
$64,000 is the support zone for wave 4.
Holding it is critical.
$60,500 is the deep support for wave C.
Only a breakout of this support will cancel the bullish scenario.
📈 Weekly Scenarios
🟩 Bullish Scenario (Main)
BTC holds the $64,000–$66,000 range, forming the bottom of wave 4 →
breaks $71,500 →
wave 5 activates.
Wave 5 Fibonacci targets:
$78,000
$82,000
Maximum extension: $89,000
🟥 Bearish Scenario (Alternative)
If the price breaks below $64,000, the structure turns into an extended zigzag. Then wave C could drop to:
$60,500
Extreme: $57,800
From there, there's a high probability of an upward reversal—the start of wave 5 is simply shifted in time.
🎯 Summary
BTC has reached its conclusion:
🔥 Above $71,500—the start of a powerful wave 5 and a new historical impulse.
⚠️ Below $64,000—wave 4 deepens before the final push.
This week promises to be a decision point: either a sharp upward move or a final liquidity boost at the bottom.

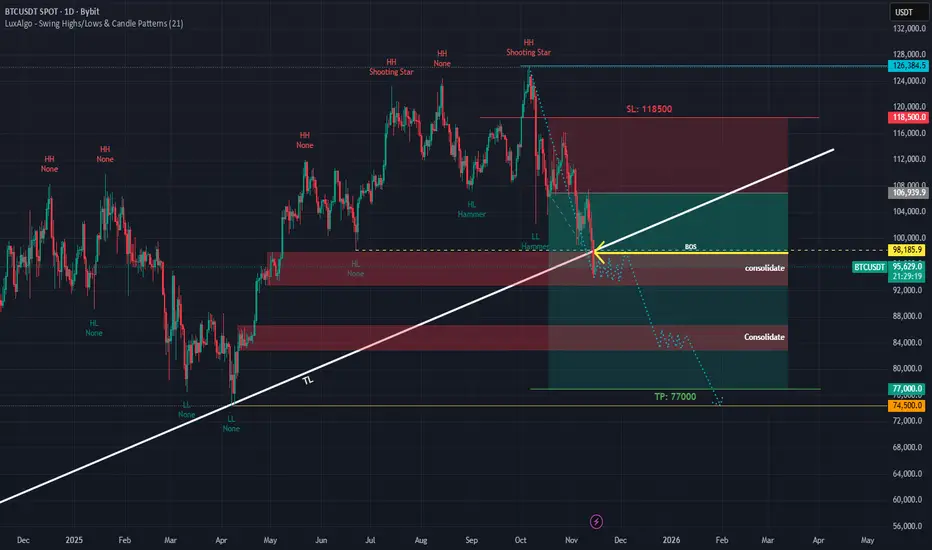
BTC Break of structure (BOS) follow my structure down to $76000✅ 1. Market Structure (1D Timeframe)
My chart shows:
🔹 Lower Low (LL) recently formed
This confirms bearish structure, since before that we had a Higher Low (HL). The LL breaks the bullish trend.
🔹 Multiple Shooting Stars at the top
This shows strong distribution (smart money selling).
The rejection near 126k was the macro top.
🔹 BOS (Break of Structure) at ~98,186
I marked this correctly.
Breaking this level initiates a new bearish cycle.
________________________________________
✅ 2. Trendline Break (Big Signal)
My long-term ascending trendline (TL) was broken decisively with a strong bearish candle.
This is a major indication of:
• Bullish trend ending
• Smart money exiting
• Bearish continuation expected
A retest of the trendline may happen, but usually after a TL break, BTC continues lower for weeks.
________________________________________
✅ 3. Current Price Action (95,447 area)
Price is sitting inside my red supply/consolidation zone, which aligns with:
• Prior HL
• BOS level
• Strong liquidity zone
This is why I see consolidation — market is deciding whether to:
A) Retest the TL again (short-term up)
or
B) Continue dumping toward demand below
Given my structure: B is more likely.
________________________________________
🟥 4. Bearish Scenario (Most Likely)
This follows my dotted projection and makes sense with the chart.
BTC likely does:
1. Small bounce to retest 98,000 – 100,000
o This is BOS retest
o This is supply
o This is also TL retest zone
o This is where sellers reload
2. Failure to break TL → major drop begins
3. First stop:
88,000 – 84,000 Consolidation Zone
This is a major liquidity zone.
4. Final target:
🎯 77,000 (my TP is correct)
or even wick to:
🎯 74,500 (liquidity)
Why 77k target is logical:
• High timeframe demand zone
• Big imbalance to fill
• Previous consolidation
• Measured move from top → aligns perfectly
________________________________________
🟩 5. Bullish Scenario (Low Probability)
For BTC to flip bullish again:
1. Must reclaim 98,186 BOS
2. Must close above 100,000
3. Must break back inside the trendline
Only then bullish continuation to:
📈 106,000
📈 118,500 SL zone
But currently price is below BOS + below TL, so bullish scenario is only 25–30% likely.
________________________________________
⭐ 6. Big Summary (Easy to Read)
✔ Trend: Bearish
✔ Structure: Lower Low (LL) confirmed
✔ Trendline: Broken → Bears in control
✔ BOS: Below 98k → bearish continuation
✔ Short-term: Bounce to 98k possible
✔ Mid-term: Drop to 88k–84k
✔ Final Target: 77k → 74.5k
My TP (77,000) is accurate and realistic.
Start Accumulating BTC!Bitcoin has reached a major demand zone between $91,000–$97,000, an area that has consistently acted as a strong support throughout 2024–2025.
Price has now tapped the bottom of this accumulation zone, where buyers previously stepped in aggressively.
Key Points:
BTC is sitting inside a high-probability bounce zone.
Historically, this region has triggered strong upward reversals.
Market structure is still intact as long as price holds above $91,000.
Perfect area for long-term positioning.
Start accumulating BTC within this support zone.
This is one of the cleaner levels to build exposure before the next macro move.

btc await breakout to sell#BTCUSD price needs reverse above the 98k which holds sell continuation, possibly decline still holds below 94600 on sell.
Sell limit 98k, target 93k-90k, stop loss 99300.
Bullish isn't strong now, we need multiple breakout above 100k before Bullish range can be formed.

Bitcoin Daily — Correction Gone WavyHey everyone!
The correction in Bitcoin turned out bigger than I expected — it unfolded as a clear three-wave ABC, and wave A itself was a flat ABC.
Right now, I believe the correction has come to an end, and Bitcoin is already hinting at another leg down.
🎯 My downside targets:
• Target 1 — $102,000
• Target 2 — $98,000
• Target 3 — $94,000 (I’m placing Target-3 at $94K, but I don’t rule out a drop to $92K)
❌ Invalidation Zone — $107,100
Also, just to remind — globally I’m still expecting Bitcoin to reach around $83,000.
However, after a drop toward ~$94K, there might be corrective bounce, so BTC can gain some strength before continuing lower.
⚠️ As always — don’t trade without stop-losses!
If you enjoy my daily Bitcoin outlooks and want to see more of my market vision, don’t forget to like, comment, and follow — your feedback means a lot! 💬🔥
Stay tuned for what’s next! 🚀

BTC Daily Scene — Still Not GreenAs you know from my previous publication, I’m still expecting Bitcoin to reach 100,000 and below.
The invalidation zone of my previous bearish scenario was 105,465 .
At the moment, Bitcoin tried to approach that zone but failed to even touch it , which only confirms its intention to keep heading down toward my target area — 100,000 and lower .
My global downside target is 83,000 , but for now, I only expect 100,000, since I don’t believe Bitcoin will drop straight to 83K in one go.
⸻
⚠️ Disclaimer:
This is not a trading signal, just my personal analysis.
Always trade according to your own system and use stop losses.
⸻
💬 Follow me so you don’t miss my daily Bitcoin analysis — the story continues!

BitcoinBTCUSD
- Exp Fiat as an corrective pattern in Long Time Frame
- Break of Structure
- Demand Zone
- Buy Side Liquidity
- Order Block

btc await breakout#BTCUSD stands between the third pattern rejection which still holds drops till 101800 to reverse back on buy. We buy when breakout on M15-30 closure above 105541.
Breakout on M15-30 closure at 105541 buy, target 107300, SL 104511.
Below the rectangle 104500 holds strong bearish which will drop till 101800 to form new buy range.

BTC SETUP IDEAIm waiting for price to reach the OB + FVG zone Below, if price react there, maybe another Leg up

Bitcoin Analysis and StrategiesYesterday, Monday, the market opened with an initial upward move, reaching a high of 106.6k before pulling back. During the US session, it bottomed at 104.6k before rebounding, ultimately closing around 106k, forming a consecutive bullish pattern on the daily chart. Today, it opened higher, reaching around 107.5k.
Currently, the daily chart shows three consecutive positive days, which is indeed quite good considering the overall upward trend. However, we cannot ignore the weakness on the weekly chart, nor can we ignore Tuesday's usual decline. The decline in the past few days has created a lot of resistance. Now, the bulls are constantly making new highs, so we need to continue to look for new resistance. Today, we should focus on the 110k-110.5k area. On the first touch, we can consider a small short position to profit from a short-term downward move.
Yesterday, the price tested 104.6k multiple times and rebounded. This point was also the highest point of the first rebound since the 99k decline. At that time, the starting point of the new round of decline was 104.5k. The subsequent breakout formed a top-to-bottom reversal. Firstly, the four-hour chart closed relatively weakly. For today, if the price turns downward again, I think the 104.8k-105.8k points are likely to form support and lead to a rebound. However, the specific point will depend on the real-time dynamics of the four-hour and hourly charts.

btc await breakout to buy or sell#BTCUSD is in middle of pattern rejection which will take off on sell till 104k-102600. But first we await for 3 times breakout below 105500 to sell.
Sell stop at 105500 on 3 times breakout cause of rejection or reverse on buy, target 104k-102600.
If price reverse back above 106600 then bullish continuation is possible, target 107300-108600.

$BTC - Critical Support at $100K | Trendline RetestCRYPTOCAP:BTC is sitting at one of the most important levels we’ve seen this year — the $100,000 psychological support zone.
After a multi-month consolidation and a sharp retest of the bullish ascending trendline that has held firm since mid-2024, Bitcoin is once again testing the structure that has defined the uptrend for over a year.
This level will determine whether the next move is a rebound back toward $109K–$126K, or a deeper pullback toward the $92K–$95K horizontal channel below.
🧭 Technical Overview
Support: $100K (key trendline) → $95K → $92K
Resistance: $109,358 → $120K → $126,296
Trend Structure: Rising wedge channel intact since 2024
Momentum: RSI hovering near neutral; previous rebounds from this trendline have led to 20–30% rallies
Volume: Declining on recent pullback — suggesting correction, not reversal
So far, every retest of this yellow ascending support has resulted in higher highs. If this pattern holds, the next target zone is between $126K–$139K, aligning with the November seasonal cycle projection.
📅 Projection Targets
November 8, 2025: $139,000 (as tracked on @Stocktwits Calendar)
January 1, 2027: $145,000 long-term extension target
This would align with the macro halving-cycle rhythm — consolidation, mid-cycle shakeout, and renewed acceleration into the next demand phase.
💬 My Take:
If CRYPTOCAP:BTC holds this $100K base and confirms a rebound above $104K, I expect renewed momentum across majors — with CRYPTOCAP:ETH , CRYPTOCAP:SOL , and CRYPTOCAP:XRP likely following.
Failure to hold $100K could open the door to a flush toward $92K before resumption, but bulls have defended this channel repeatedly for nearly 18 months.

BTC/USD) Bearish trend analysis Read The captionSMC Trading point update
Technical analysis of BTC/USDT (4-hour timeframe). Here's the idea breakdown:
---
1. Overall Structure
The price is moving within a descending channel, suggesting a broader downtrend.
The two black trendlines show clear lower highs and lower lows forming.
---
2. Key Zones & Indicators
Blue Zone (104,000–106,000 region):
This is a major supply/resistance zone where price has repeatedly rejected.
The two red arrows mark failed attempts to break above it — confirming strong bearish pressure.
EMA 50 (blue line) and EMA 200 (black line):
Price is trading below both EMAs, confirming bearish market structure.
The 50 EMA is below the 200 EMA, indicating a bearish crossover (momentum continuation signal).
---
3. Expected Move
After the recent rejection from the supply zone, the chart projects a bearish continuation:
A possible small pullback or consolidation.
Then a drop toward the target area near $90,099, which aligns with the lower boundary of the channel (major support).
---
4. Target
Target Point: Around $90,100, which could be the next liquidity zone or potential demand area.
---
5. Summary
Trend: Bearish
Structure: Lower highs & lower lows (descending channel)
Bias: Continuation to the downside
Confirmation: Rejection from supply + EMA resistance alignment
Target: $90,100
Mr SMC Trading point
---
Trading Idea Summary:
“BTC is maintaining a bearish structure under EMA resistance and rejecting the 104–106K supply zone. Unless price reclaims that level, continuation toward 90K support remains the high-probability scenario.”
Please support boost 🚀 this analysis

BTC Is Warming Up for Its Next Big Move — Don’t Miss This Setup Few thoughts about BTC:
when you trade crypto you have to look at 4h+ time frame, daily or weekly is the best to see clean picture.
Right now BTC just touched discount( 100359)
now i can see 3 possible scenarios
1 - small pull back next week and then pump 130-140k first target
2 - price will go a bit deeper to fill weekly FVG at ~90k
3 - CRYPTO SCAM AND WE ARE ALL DOOMED😱😱😱
until we didnt see BTC break below 70k , i am still bullish on crypto and buying some coins on spot for my portfolio, i am not heavy in crypto but 200-300$ a week is nice investment with potential x10-20 return is nice option

BTC-----Sell around 104500, target 103000 areaBTC Contract Technical Analysis, November 6th:
On the daily chart, yesterday's close was a small positive candle, with a pattern of consecutive negative candles followed by a single positive candle. The price is below the moving average, and the accompanying indicators are in a death cross, indicating a clear downward trend. As previously mentioned, the weekly chart also shows a clear downtrend. Therefore, the strategy is to sell at higher prices and focus on the impact of news and data, avoiding counter-trend trades. On the hourly chart, yesterday's Asian session saw a price rebound from support, which continued into the day, but the momentum was weak and the price failed to break the high. Currently, the Asian session has seen a slight pullback without further continuation, and while the momentum is weak, it doesn't affect the overall trend. The European session is expected to see a further decline and breakout.
Today's BTC Short-Term Contract Trading Strategy:
Sell at the 104500 area, stop loss at the 105000 area, target at the 103000 area.

$Q / USDT — Long SetupAfter a healthy pullback, $Q is showing a fresh bullish structure on the LTF. If it holds above support, a strong upside move is likely ahead.
🟢 Entry: 0.0181$ & 0.01770$
🎯 Targets:
T1 — 0.0188$
T2 — 0.0194$
T3 — 0.0215$
T4 — 0.0230$
🛑 SL: 0.01625$
🔥 Momentum building — A breakout above short-term resistance could trigger a sharp bullish move — stay ready, because #Q might surprise with a strong surge soon!

$FET looks ready for a bigger moveAfter breaking key resistance on strong volume, it’s now testing the zone. Everything points to another upward push.
🟢 Entry : 0.2215$ - 0.2170$
🎯 Tps : 0.232$ - 0.245$ - 0.26$
🔴 Stop : 0.20$
Holding above 0.215$ thn we could see a good move ✅ DYOR

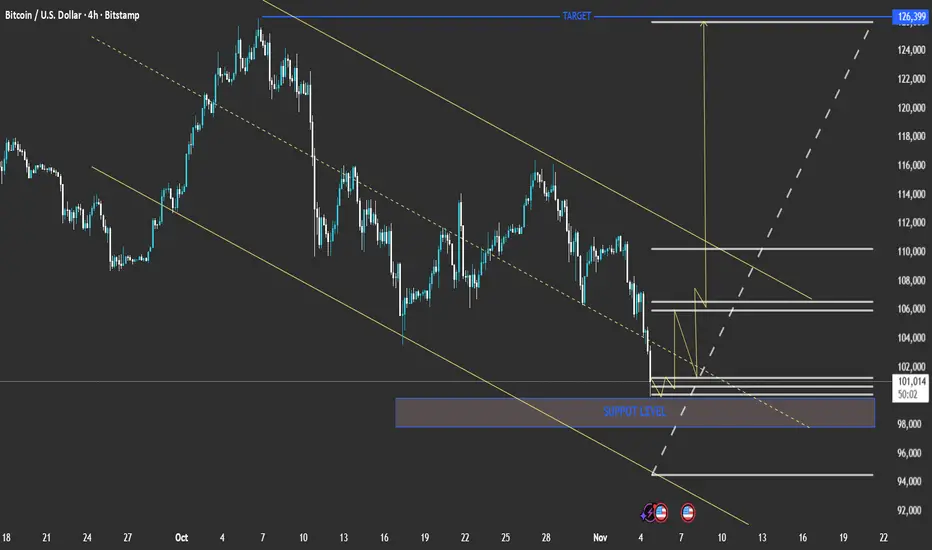
technical analysis of your Bitcoin (BTC/USD) 4-hour chartPair: BTC/USD
Timeframe: 4H
Current Price: ≈ 101,240
Trend: Downtrend within a descending channel
Main Zones:
Support Level: 98,000 – 100,000
Short-Term Resistance: 104,000 – 106,000
Major Target (Upside): 126,399
📉 Technical Outlook
Bitcoin continues to respect the descending channel drawn with parallel trendlines.
The price is now hovering near the lower boundary of the channel, close to the support level zone.
A potential bullish reversal may occur if this support holds, leading to a push toward mid-channel resistance (around 106,000).
📈 Bullish Scenario
If the support at 98,000–100,000 holds:
BTC could rebound toward 104,000 → 106,000 → 110,000.
A confirmed breakout above 110,000 may trigger a strong rally toward the main target of 126,399.
📉 Bearish Scenario
If BTC breaks below 98,000:
Expect further downside to 94,000 – 92,000, the next major demand zone.
This would confirm continuation of the descending channel trend.
⚙️ Summary
Aspect Bias
Trend Bearish (short term)
Key Support 98,000 – 100,000
Key Resistance 106,000 – 110,000
Long-Term Target 126,399 (if breakout occurs)
Short-Term Risk Break below 98,000 FPMARKETS:BTCUSD FPMARKETS:XLMUSD FPMARKETS:SOLUSD FPMARKETS:ETHUSD FPMARKETS:RPLUSD FPMARKETS:DOGUSD FPMARKETS:LTCUSD FPMARKETS:LNKUSD FPMARKETS:ADAUSD FPMARKETS:EOSUSD FPMARKETS:EOSUSD
BTC faces a crash, can it hold the $100000 mark?#BTCUSD BITSTAMP:BTCUSD BINANCE:BTCUSDT BITSTAMP:BTCUSD BINANCE:BTCUSDT
Affected by market news, BTC's hourly chart showed a large bearish candlestick, falling to a low of around 104000. Currently, regardless of the time frame, BTC has reached the lower Bollinger Band area, and all moving averages across different timeframes are trending downwards in tandem, with the MACD indicator showing a bearish crossover and increasing volume. There are no signs of a technical reversal yet, and in the short term, BTC still has room for further downward correction.
If 104000 is breached again, BTC may further decline to 102000-101000, or even the psychological level of 100000. It's only a matter of time, and the bulls will temporarily back down.
Therefore, if BTC rebounds to 105500-106500 in the short term, shorting BTC can be considered.

BTC/USDT — 1H Chart AnalysisTechnical Bias: Bullish Reversal Setup
Analysis Overview:
BTC is showing strong signs of a potential bullish reversal after retesting the key $99,000 support zone, which has historically acted as a high-volume demand area. The current structure suggests absorption of selling pressure with narrowing spreads and stable volume — a classic VSA accumulation signal.
Key Technical Insights:
Support Zone ($99,000 – $100,000): Price rebounded from this zone with visible buying tails and decreasing spread on down bars, indicating professional demand stepping in.
Resistance Zone ($114,000 – $115,000): Previous double-top area highlighted in green; this will be the next major resistance where profit-taking may occur.
Volume Behavior: Volume dropped during the last downward push, suggesting a lack of selling momentum — a bullish sign within VSA logic.
RSI Recovery: RSI bouncing from the oversold region confirms early momentum shift to the upside.
Trade Setup:
Buy Entry: Above $106,000 (confirmation of reversal structure)
Target Zone: $114,500 – $115,000
Stop Loss: Below $105,000 support
Risk–Reward Ratio: ~1:5, favoring long bias
Conclusion:
BTC holds a higher probability of upside continuation, supported by strong demand near support and weakening supply pressure. A sustained close above $106,000 will likely trigger a momentum rally toward the $115K resistance area.

COAI – Could This Be the Bottom ?
Volume is finally kicking in on $COAI, and the setup I shared earlier played out perfectly — delivering a solid +20% bounce from the lows!
Now things are getting interesting 👀 — if the 0.786 Fib zone holds as a strong base and confirms on retest, we might just be witnessing the true bottom forming here.
From this point, bulls could easily drive price toward $1.90+, or even higher if the monthly low acts as a launchpad and whales step back in after that massive 90%+ retrace.
I’ll be buying this dip again (x10) — structure looks way safer now.
Let’s see how this plays out!
⚠️ Not financial advice — just sharing my view.
Market remains highly volatile, so always #DYOR 💥

BTCUSD price await one time breakout below 109850 before selling#BTCUSD price await one time breakout below 109850 before selling.
Multiple rejection have happened between 110150 and 109850.
Sell from 109850, target 108900, stop loss 110531.
Above 110300 shows bullish continuation on 2 times breakout.
