BTC/USD: Wave 5 Launch or Wave Cycle End?BTC/USD: Wave 5 Launch or Wave Cycle End?
📈 Weekly Scenarios
Bullish scenario: Price holds above ~$110,000, breaks through ~$120,000 → wave (5) strengthens → possible rise to ~$135,000-140,000.
Consolidation: Price trades between ~$110,000 and ~$120,000 without a formed structure, the market is paused.
Bearish scenario: Break of support at ~$110,000 with volume → corrective wave A-B-C → possible decline to ~$100,000-105,000.
✅ Conclusion
On the weekly timeframe, BTC/USD is at a key turning point: either an upward impulse (wave (5)) or the beginning of a major correction.
Holding support at ~$110,000 is the basis for a bullish scenario.
A breakout of resistance at ~$120,000 is a signal for continued growth.
A breakout below ~$110,000 is a signal for a change in structure.
Btctechnicalanalysis

Bitcoin trading ideas and strategiesOn the daily chart, Bitcoin's four-day winning streak came to an end this morning. The candlestick chart showed a long upper candlestick with a hammer candlestick pattern. However, the price ultimately closed above the 60-day moving average, maintaining its key support level.
The Bollinger Bands are continuing to narrow, and volatility is gradually narrowing amidst the current bull-bear tussle. The KDJ indicator's fast line is showing signs of slowing at high levels, suggesting a short-term correction. The MACD lines maintain a golden cross pattern and diverge upward, with continued volume growth. Funding is providing some support for bulls, who remain in the driver's seat.
Trading Strategy: Go long between 113,000 and 113.5,000, with a target around 116,000.

BTC has a bright future and is bullish with no regretsThanks to the positive news of the easing of Sino-US trade tensions over the weekend, BTC has gradually recovered from the severe consolidation it has experienced repeatedly since the brutal crash on October 10. This modest recovery appears to confirm the continuation of its upward trajectory.
From the perspective of technical indicators, the MACD golden cross continues to increase in volume and is always above the signal line, further strengthening the bullish sentiment of BTC. At the same time, from the 4H chart, the Bollinger Bands have expanded significantly as prices have risen, indicating that short-term volatility has increased. The fact that BTC prices have remained largely near the upper Bollinger Band suggests that, at this point, the market is more likely to continue its upward trend than to reverse.
However, it is worth noting that the small cycle is trending downward, and the divergence between RSI and price suggests that there may be profit-taking in the short term. Therefore, in the short term, BTC may face a small pullback to retest support before rising.
Pay attention to 114000-113000 below. If it retreats here, you can consider going long on BTC with a light position, with the target at 115000-117000.

Technical Analysis – Bitcoin CME Futures (BTC1!)Technical Analysis – Bitcoin CME Futures (BTC1!)
Date: October 27, 2025 | Timeframe: Weekly | Exchange: CME Group
1. Trend Overview and Price Structure
Bitcoin CME Futures are trading at $115,090, up +3.69% for the week.
After nearly six months of consolidation between $100,000–$115,000, the current setup indicates an ascending triangle formation nearing completion — signaling a potential major breakout toward the end of Q4 2025.
The medium-to-long-term trend remains firmly bullish, supported by a strong accumulation base following the uptrend from the $38,000 low (June 2023).
Technical upside targets after a confirmed breakout: $127,300 → $141,800 → $156,700.
2. Key Technical Price Levels
Resistance: 127,300 – 141,800 – 156,700
Support: 113,500 – 105,000 – 95,800
3. Detailed Technical Analysis
(1) Short-Term Trend
The third bull-flag pattern since 2023 is developing. Bitcoin has closed above its 20-week EMA for 11 consecutive weeks, confirming structural bullish momentum. Short-term bias: Uptrend continuation, targeting $127,300 over the next 3–5 weeks.
(2) Volume Analysis
CME trading volume rose 22% versus the 4-week average. Institutional positioning (COT Report) shows net long positions up by 8,500 contracts — the highest level since March 2024.
(3) Elliott Wave Structure
Wave 1: 38,000 → 77,500
Wave 2: Correction to 63,000
Wave 3: Expansion to 118,000
Wave 4: Sideways consolidation (100,000–115,000)
Wave 5: Target zone 140,000–156,000
(4) Momentum Confirmation
RS vs S&P 500 continues to strengthen. MVRV Z-score: +1.95 — still below overbought territory, allowing an additional 25–30% upside.
4. VNC– Strategic Commentary
Market Context
The Bitcoin market is underpinned by three structural drivers:
- Strong ETF Inflows: According to Bloomberg ETF Flow (Oct 24), spot Bitcoin ETFs saw $2.8 billion in net inflows over 10 days, the highest since their early 2024 launch.
- Monetary Easing by the Fed: The Federal Reserve has hinted at a 0.25% rate cut in December 2025, reigniting risk-on sentiment in digital assets.
- Tight Supply Dynamics: Post-2024 Halving, block issuance fell 8%, while whale cold storage activity hit a 14-month high (Glassnode, Oct 25).
- Key Market Developments (Oct 12–27, 2025): - CME Group (Oct 25): Bitcoin futures open interest hit $7.42B, up 9% WoW. Bloomberg (Oct 23): Fed expected to cut rates in December; crypto assets responded positively. CoinDesk (Oct 22): Exchange stablecoin ratios rose 10%, signaling incoming liquidity. Glassnode (Oct 20): Wallets holding over 10,000 BTC increased 3.4%, showing institutional accumulation. Reuters (Oct 19): Tech investment funds are reallocating 16% of new risk-on capital back into crypto.
VNC Intelligence Assessment (BI View)
Short-Term (2–3 weeks): Sideways range $112,000–$127,000, awaiting breakout confirmation.
Medium-Term (4–8 weeks): Upside target $141,800, driven by sustained ETF inflows.
Risks: Short-term USD rebound or ETF outflows if the Fed delays rate cuts.
5. Suggested Technical Strategies
Bullish Scenario (Preferred):
Entry: 113,500 – 115,000
Targets: TP1 127,300 | TP2 141,800 | TP3 156,700
Stop-Loss: 107,000
Probability: 80%
Rationale: Ascending triangle breakout supported by ETF inflows and institutional accumulation.
Bearish Counter-Scenario (Short-Term Profit Taking):
Entry: 156,000 – 157,000 (upon hitting projected wave 5 top)
Target: 141,800
Stop-Loss: 160,000
Probability: 20%
Rationale: Short-term profit-taking at Fibonacci extension resistance.
VNC Intelligence Summary: Bitcoin remains in a strong macro uptrend, supported by robust institutional participation and easing macroeconomic conditions.The ascending triangle pattern signals a potential mid-Q4 breakout, with ETF inflows acting as the key catalyst for price acceleration toward $140,000–$150,000.

BTC breaks through resistance, go long at low levelAfter the weekend break, we’ve entered the final week of October. Bitcoin maintained its strong performance over the weekend, and the current price has rebounded to the 115.4K level again, setting a bullish tone for the new week’s market.
From the daily timeframe perspective, the market’s bullish momentum continues to unfold: the candlesticks show a steady upward trend with consecutive bullish candles, indicating strong continuity of the bullish trend. Since the rebound from the previous low, the price has risen in a stepped manner and has successfully broken through the resistance of the Bollinger Bands’ middle band in the short term, presenting a clear upward trend on the technical side.
Going forward, we need to focus on the breakout of the 120K key resistance zone. If this level is effectively held, the price is expected to refresh the recent high again based on the long-term trend analysis. As the upward trend remains intact, we can continue to adhere to the core strategy of "buying on dips" for our operations.
Considering the market rhythm on Monday morning, here’s a specific trading suggestion: for BTC, we can establish long positions within the range of 114K-113.5K, with the target looking at the 116K-118K level. After entering the position, we can set a stop-loss below the lower edge of the entry range to cope with short-term fluctuation risks.
BTC/USD: Final wave before breakout or correction signal?BTC/USD: Final wave before breakout or correction signal?
📊 Monthly Technical Analysis — Bitcoin (BTC/USD)
Using support/resistance levels and wave analysis
🌀 Wave Context
According to the Elliott Wave Principle model, Bitcoin may be either in the final impulse wave (5) or at the start of an A-B-C corrective structure.
Wave (4) is expected to have ended near the $100,000-$110,000 zone. If wave (5) starts, it could signal a significant upward move. Otherwise, a breakout of support could signal a correction.
📈 Monthly Scenarios
Bullish scenario: BTC holds above $110,000 → breakout to $120,000 → start of wave (5) → move to $135,000+.
Consolidation: The price moves sideways between ~$110,000 and ~$120,000, accumulating strength before a new move.
Bearish scenario: Breakout of support at ~$110,000 with volume → correction to ~$100,000 or lower.
✅Conclusion
On the monthly timeframe, BTC/USD is at a crossroads: it is either entering a powerful uptrend or a significant correction is beginning.
The ~$110,000 level is a key marker for the continuation of the bullish structure.
A breakout above $120,000 is a signal for growth.
A breakout below $110,000 is a signal for caution.
Monitor price movement relative to these levels and confirmation of the wave structure before making trading decisions.
BTCUSD: Final Wave Before the Breakout or Stuck Five-Wing?BTCUSD: Final Wave Before the Breakout or Stuck Five-Wing?
Weekly Scenarios
Bullish scenario: BTC holds above ~$110,000, breaks through ~$120,000 → wave (5) activates → target ~$135,000–$140,000.
Consolidation: Trading between ~$110,000 and ~$120,000; the market is building strength for the next round.
Bearish scenario: Break of support at ~$110,000 with volume confirmation → correction begins to ~$100,000–$105,000.
Conclusion
The weekly analysis shows that the BTC/USD market is at a crossroads: either the final wave of growth begins, or a correction begins.
Holding the ~$110,000 zone is critical for maintaining bullish sentiment.
A breakout above ~$120,000 is a signal for growth.
A breakout below ~$110,000 is a signal for caution.

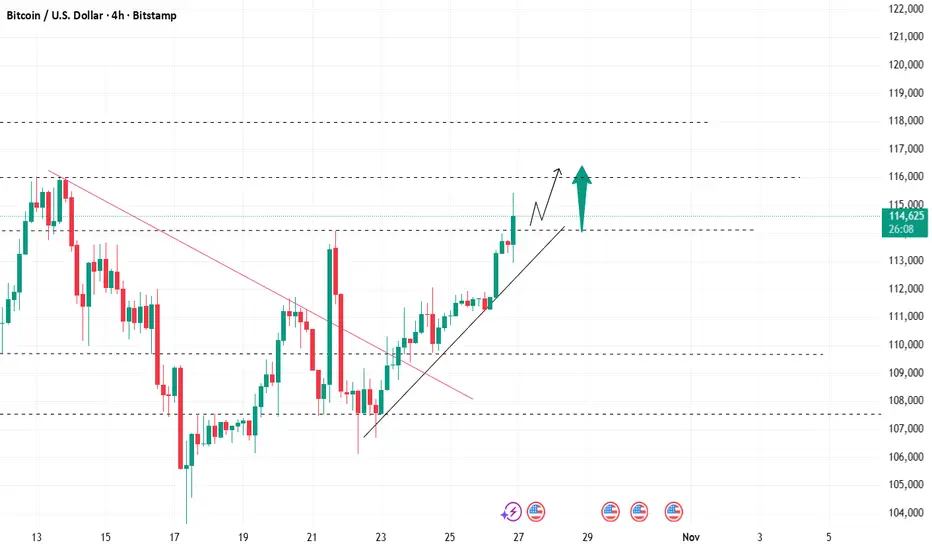
technical analysis for your BTC/USD chart:Pair: Bitcoin / U.S. Dollar (BTC/USD)
Current Price: around $111,628
Structure: Ascending channel pattern
Key Zones:
Resistance Level: $112,000 – $112,500
Target Level (Support): $106,572
📊 Technical Analysis
Trend Structure:
BTC/USD is moving within a rising channel, showing short-term bullish momentum.
Price is now approaching the upper boundary of the channel and a major resistance zone ($112,000–$112,500).
Resistance Reaction Expected:
This zone has previously rejected price, so sellers may re-enter around this region.
If price fails to break above the resistance, a bearish correction is likely.
Bearish Scenario (Primary Expectation):
A potential reversal from resistance is indicated on your chart.
Confirmation: A strong bearish candle or break below the midline of the channel.
Downside target: around $106,572, aligning with previous demand/support and the lower boundary of the broader channel.
Bullish Scenario (Alternative):
If BTC/USD breaks above $112,500 with volume, price could extend toward $113,500–$114,000 before any correction.
⚙️ Trading Plan (Summary)
Direction Entry Zone Stop-Loss Target
🔻 Short (Sell) 112,000 – 112,500 Above 113,000 106,600
🔺 Long (Breakout) Above 112,500 (confirmed) Below 111,800 113,500 – 114,000
🧩 Technical Indicators (Implied)
Trend Channel: Uptrend but nearing exhaustion.
Volume: Likely decreasing as price nears resistance (sign of weakening momentum).
Market Sentiment: Short-term bullish → potential reversal zone ahead. RUS:SBER RUS:VTBR RUS:LKOH RUS:ROSN RUS:MOEX RUS:PLZL RUS:T RUS:NVTK RUS:AFLT RUS:SMLT

$BTC might explode after the washout!CRYPTOCAP:BTC is once again reacting strongly from the lower channel support, similar to the previous green-circle bounces we’ve seen this year.
Each green circle has marked key accumulation points — followed by strong upside momentum.
Meanwhile, red circles highlight resistance rejections where profit-taking zones formed near the upper channel boundary.
🧭 Key Levels to Watch:
Support: $106.8K – $110.5K
Resistance: $120.1K – $123.5K
Trend: Holding firmly inside the rising channel
If CRYPTOCAP:BTC continues to respect the green zone, we could be looking at the early stages of another leg up toward the top of the channel.
But if support fails, expect a deeper retest of the lower structure.
Note:
History doesn’t repeat perfectly — but it rhymes. Stay calm, stay patient, and let the chart tell the story.

Btc is STILL following this Eth fractalIf Btc continues to follow this Eth fractal, one might anticipate a Btc bottom no less than 102K.
What are your thoughts?
May the trends be with you.

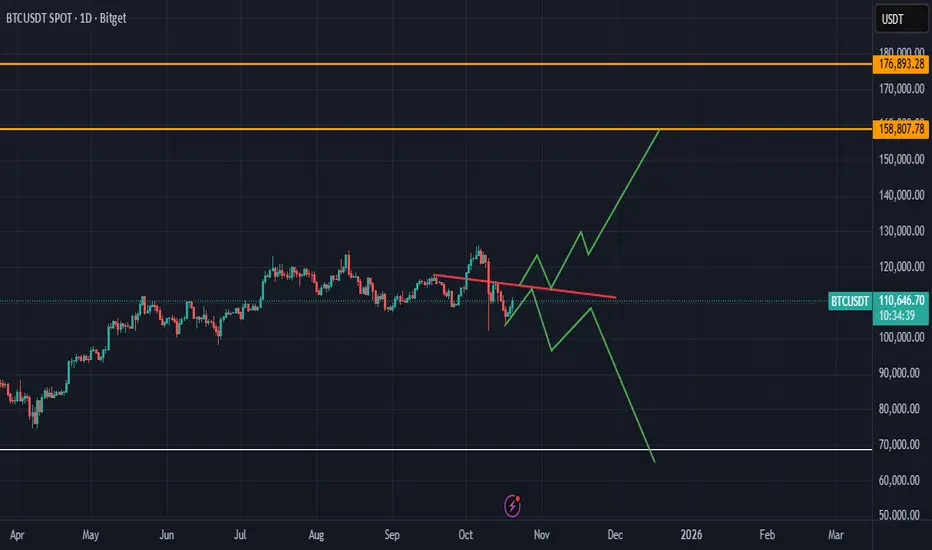
Bitcoin: Possible Scenarios on the Daily Chart🔴 Watch the red line!
If BTC breaks above — bulls take control.
If not — expect another drop.
Always manage your risk around reversal zones! 💥
#Bitcoin #BTC #Crypto #BTCUSD #CryptoTrading #TradingSetup #DailyChart #PriceAction
You will ask yourself "how did he know Btc would crash to 103K"?On Sept 23rd I suggested if Btc continues to follow this Eth fractal it would soon bottom at 102K (see chart below). Btc just crashed to 103K on Friday.
Fractals can act as maps for future price action. But they often deviate from the "expectation" at the worst time. I will follow this fractal until it stops working. Hope it has guided you well.
Between this Eth fractal (posted a month ago) and the "3 red week down rule" charts that I have been posting...it's safe to say we seen this week's (historic) dump coming . TA works!
I say this not to brag, but show the disbelievers that TA works (I encourage you to learn). And Also I keep track of my stats on my calls, to track my win ratios. You should too, how else would you know if it's worth following someone's predicitons.
May the trends to be with you.

BITCOIN HIGH PROBABILITY SETUP SOON!!!🚨 BTC HIGH PROBABILITY BUY SETUP 🚨
* Here We Can See Clearly The Next Potential Moves For BTCUSD Coming Hours/Days.
* Keep Your Eyes Close On Your Trading Positions.
* Happy PIP Hunting Traders.
FXKILLA.

You will ask yourself "how did he know Btc would do that?On Aug 9th I suggested that Btc could dump as low as 107,800. The actual low came within a small margin of that.
On Sept 2nd I suggested that the bottom was in and Btc would soon bounce to 1 of my 3 targets.
On Sept 11th, I also suggested that a lower low was probable (below 107K).
On Sept 17th, the top of the run was called and we saw the anticipated reversal.
I also anticipated the day (time frame), the reversal would occur.
TA works for both the X and Y axis (for both price and time).
I wrote "the bounce was coming to an end within 5 days". On day 6 Btc fell.
I honestly thought Btc would form it's lower low when I published the above charts. But instead we got that low probability pattern of a liquidity grab above the local high...THEN swipe the lows, to form a lower low afterwards. This pattern liquidated all the longs and the shorts, in what tunred out to be the biggest liquidation event in crypto history.
Either way, we got the anticipated lower low and we were spared a catastrophic dump..allowing us to be on the right side of the trade. It's safe to say this was not a surprise, but anticipated and therefore we profited.
TA works! Thank you "3 Red Week Down Rule". lol
Btw I have been suggesting (for weeks), that Btc would hit a lower low, based on the "3 Red Week Down Rule". While everyone on social media is blaming Friday's announcement on China tariffs, for cuasing this lower low.
'Show me the chart and I'll tell you the news"
-Bernard Baruch
Pattern's can be predictive! Learn them all.

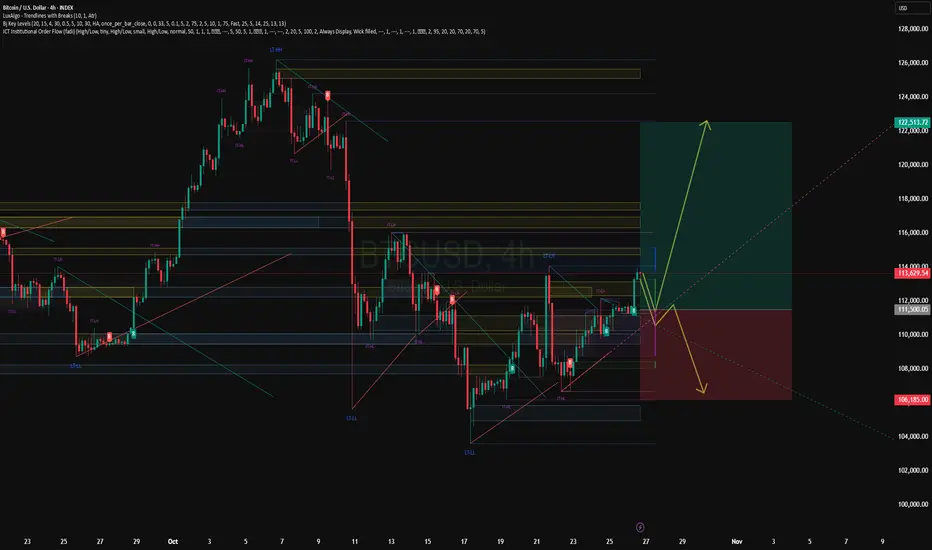
Bitcoin Short-Term Update – October 17, 2025-The short trigger from yesterday has been triggered, and the market is currently moving in favor of the bearish scenario.
At this stage, the downside momentum remains strong, making it reasonable to keep short positions open, provided you manage your risk carefully and adjust stops appropriately.
-However, it’s important to remain prepared for a potential V-shaped reversal.
If such a pattern forms, it would signal a sudden shift in momentum, and we would need to flip our bias toward long positions.
-This is particularly relevant because our long-term trend is still bullish, meaning any corrective move could be temporary.
While the short-term setup favors sellers for now, flexibility and vigilance are crucial, as the market could quickly reverse.
For informational purposes only – not financial advice. © DIBAPRISM
Larry D.Kohn

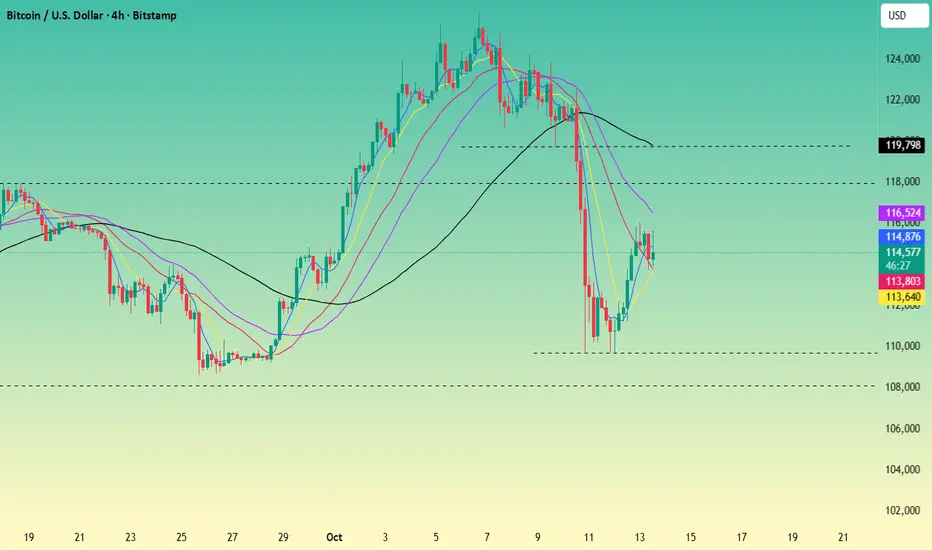
Bitcoin → Overall weak, focus on 113K supportBitcoin is currently trading at 114.2K. The market has now shown a clear downward trend. From a technical perspective, the bearish engulfing pattern appearing on the daily timeframe has formed a strong resonance with the bearish arrangement of the moving average system. This signal further confirms the market's bearish bias, and short-term rebound momentum is significantly insufficient.
In terms of the performance of key levels, although there is strong buying support at the 113K level on the daily timeframe, the current price is still suppressed by the short-term trend, and the effectiveness of this support level needs continuous observation. On the hourly timeframe, after forming a local high near 116K, the price entered a downward channel and is currently in a consolidation phase. No clear signal of stopping the decline has emerged yet, and the overall trend remains relatively weak.
Resistance Levels: 116K, 118
KSupport Levels: 113K, 109.6K
For detailed trading decisions, please follow my live updates. I publish my trading ideas and strategies daily. If you lack a plan or clear direction in cryptocurrency and are struggling to achieve consistent and stable profits, you can refer to and follow my updates as a reference and guide to help you avoid mistakes.

Bitcoin → Bullish if it holds above 113K.As US President Trump announced the easing of the "tariff issue", cryptocurrencies rose. Bitcoin previously stabilized at the bottom of the 108-112 range and rebounded to a high of 116K. It is currently fluctuating at 114.2K. In the short term, we should pay attention to the support of 112k-113k. As long as this position is maintained, the rebound momentum can continue.
BTC/USD – Intraday Structure Update (1H)🟠 BTC/USD – Intraday Structure Update (1H)
Price has just swept local highs (SWFTH) and is now showing a reaction from the critical resistance zone (CRTH–TS).
Current structure suggests a possible short-term pullback before continuation, with key levels marked below:
Resistance: 115,016 – 115,532
Support: 113,737 – 114,134
Current Price: 114,670
A sustained move above 115K could open room toward 115.5K+, while rejection from this area could bring 113.7K back into focus.
📊 Watch for liquidity grabs and confirmation wicks before entering any position.
💬 What’s your bias here — continuation or correction?
Follow for more.
Greetings,
MrYounity

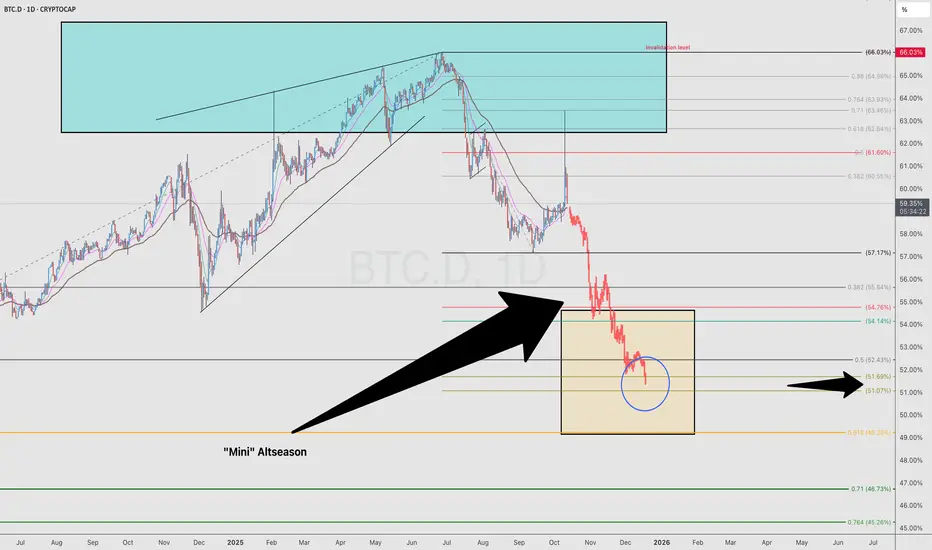
BTC.D 1D – Altseason on the HorizonHi fellow traders,
On the 1D BTC.D chart, I am applying Elliott Wave principles and broader market structure to highlight a potential move down toward the 51.7% dominance level. This zone aligns perfectly with the 0.5 Fibonacci retracement and could mark the next key turning point for Bitcoin dominance.
If this scenario plays out, we may witness a “mini” Altseason — a phase where capital begins rotating out of Bitcoin and into altcoins, sparking stronger rallies across the broader crypto market.
This setup isn’t a trade but a macro expectation, and it could serve as a powerful signal for increased altcoin strength in the coming weeks.
Stay alert — things could get very exciting from here.
Good luck and trade safe!
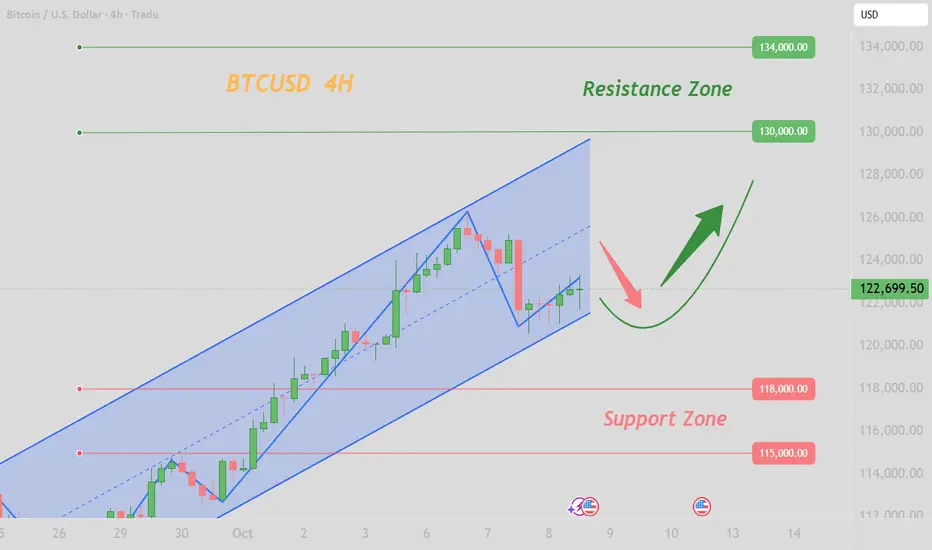
BTC:Caution should be exercisedIn early trading today, Bitcoin briefly surged to a high level before plunging sharply, and finally stabilized with fluctuations around the 122000 mark.
The 125000-126000 range is a cluster of previous highs, is rife with a large number of trapped positions and profit-taking positions. Sustained expanded trading volume is required to achieve an effective breakthrough, and it will be quite challenging to break through in the short term.
Caution should be exercised regarding the impact of factors such as a leverage liquidation wave, a policy shift at the Federal Reserve's December FOMC meeting, and increased volatility amid the high valuation of global cryptocurrencies on the trend.
Buy 121100 - 121500 TP 122000 - 122500 - 123000
Daily-updated accurate signals are at your disposal. If you run into any problems while trading, these signals serve as a reliable reference—don’t hesitate to use them! I truly hope they bring you significant assistance
$SUSDT Breakout Alert: Bullish Reversal in Play.$S just broke out of a long falling wedge, signalling a possible bullish reversal.
MACD is turning positive, adding momentum to the move.
If price holds above the breakout zone, it could rally toward $0.8808, nearly 195% higher than current levels.
DYOR, NFA

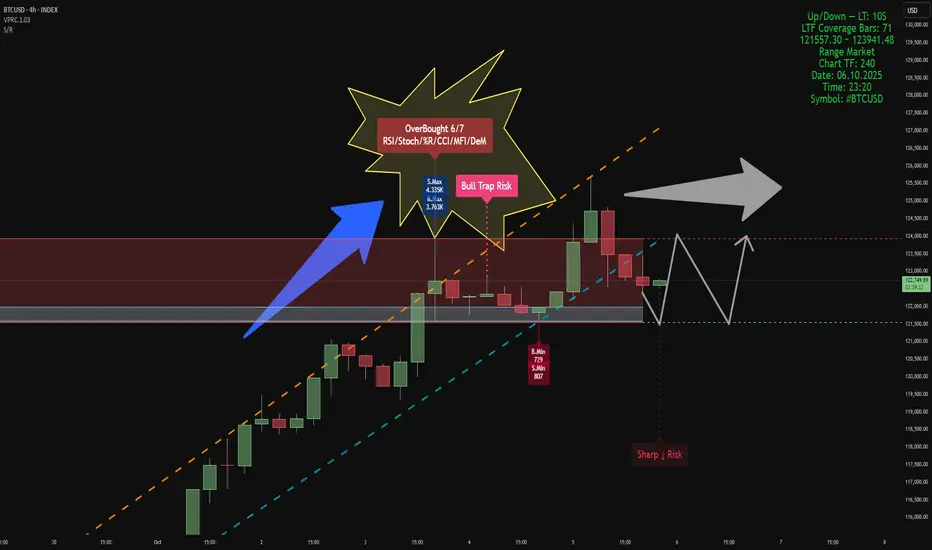
BTCUSD – 4H Volume-Structure Analysis
Indicators
Smart Money Support/Resistance (Lite) & ATAI Volume Analysis with Price Action V1.03
Analytical Setup
• LTF: 10 seconds
• LTF Coverage Bars: 70
• Global Volume Period: 52
• Market Type: Range
• Active Zones:
- Support Zone: 121,557 – 123,941 USD (current active range shown in panel)
The analysis timeframe ensures valid volume coverage, as the period (52) is smaller than total LTF bars (70).
Resistance Area & Bull Trap Risk
In the upper range (≈123,900 USD), a Bull Trap Risk has formed immediately after an OverBought 6/7 condition — confirmed by RSI, Stoch, %R, CCI, MFI, and DeM modules in ATAI. At this point, both buy and sell volumes peaked within the 52-bar window, with S.Max = 4.33K and B.Max = 3.76K. This slight dominance by sellers indicates demand absorption at the top of the structure. The setup matches ATAI’s trap logic — high wick, overbought context, and volume imbalance — signaling potential exhaustion near resistance.
Support Area
Support is currently anchored near 121,550 USD, derived from B.Min and S.Min lows (B.Min = 7.29, S.Min = 807). This aligns with the lower projection from Smart Money S/R, marking the point where cumulative delta begins to compress. Historically, compression at minimum-volume zones often precedes short-term accumulation or range stabilization.
Structural Behavior
The chart shows a defined upward channel (orange and cyan dashed lines). After testing the upper boundary, price entered the resistance zone and generated a Bull Trap Risk followed by moderate rejection. Below, the Sharp ↓ Risk tag signals potential for a short liquidity sweep before stabilization. Volume readings still support range continuation rather than a confirmed reversal, consistent with the Range Market tag.
Probable Scenario
1. A short pullback toward the lower boundary of support (~121.5K) is expected.
2. If support holds and volume compression persists, a rebound toward 123.9K (resistance ceiling) is probable.
3. A breakdown below 121.5K could trigger a deeper correction toward the next S/R projection near 120K.
This represents a neutral-to-bullish range bias: short-term weakness, but constructive above support.
Summary
• OverBought 6/7 + Bull Trap Risk detected at resistance (≈123.9K).
• Support around 121.5K built from B.Min and S.Min.
• Sellers slightly dominant at the trap peak.
• Likely scenario: retest of support, then rebound toward resistance if volume confirms.
• Bias: range continuation until breakout beyond 123.9K or breakdown below 121.5K.
Bitcoin (BTC/USD)Bitcoin just broke a new all-time high 🚀
As shown in my pinned analysis, I marked the $111K level and mentioned that investors could also look for entries around $109K.
Today, you can see how that plan played out ✅
I’m not a fortune teller,
I don’t know what the whales are planning,
I don’t memorize Glassnode data —
My only tool is the chart 📊
I’m a swing trader —
Calm, stress-free, and patient.
Hope this analysis helped you too.
🎯 Stay profitable and trade safe.
