Bitcoin (BTC/USD) - Bullish Continuation from Order Block (OB)The analysis uses concepts from Technical Analysis and Smart Money Concepts (SMC), indicating a short-term bullish bias:
Recent Trend: The chart shows a recent strong upswing followed by a slight pullback. The overall movement from October 27th onwards suggests a continuation of the upward momentum.
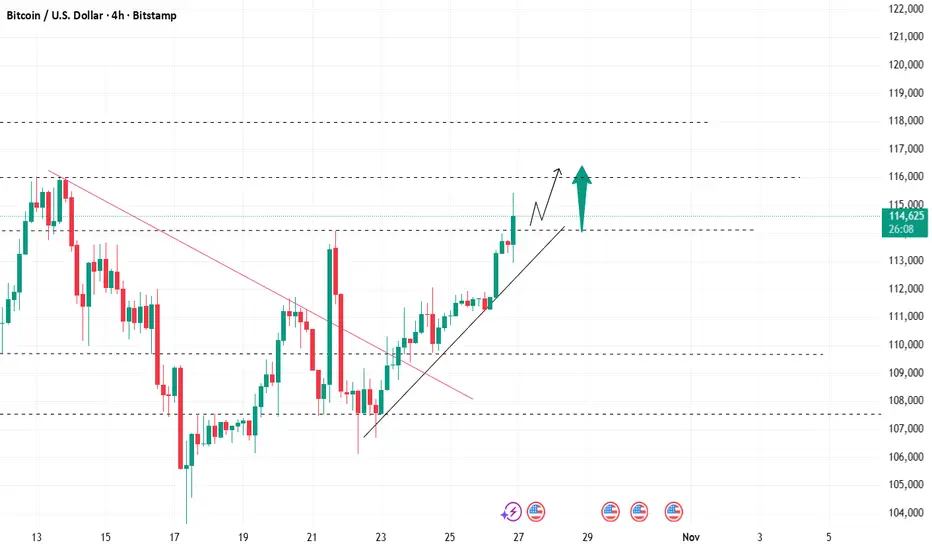
Market Structure Shift (MSS): The price recently broke above a local swing high (near $114,500), which is often termed a Market Structure Shift (MSS) in SMC. This break confirmed that the prevailing short-term trend is upward.
Order Block (OB): The gray shaded box, labeled OB, represents an Order Block. This is a specific area where smart money (institutions) may have placed buy orders, and it is identified as a strong area of support.
The current price action shows the price has dropped back into this critical support zone (around $112,500 to $113,500).
Consequent Retracement Levels (CRT):
CRT-L (around $111,800) is the lowest level of the recent swing or the bottom of the structure being referenced for support.
CRT-H (around $116,000) is the swing high, which is also identified as the primary target for the expected bullish move.
Proposed Price Action: The primary black arrow suggests that after testing the OB support zone, the price is expected to turn sharply upward and rally back toward the high at CRT-H ($116,000). The current slight rebound from the OB supports this idea.
Interpretation and Trading Bias
The analysis has a clear bullish continuation bias. The trader is looking for long (buy) entries inside the Order Block (OB) zone, anticipating that the price will hold this institutional support and target the previous swing high at $116,000.
Btctrade

BTC-----Sell around 113200, target 111700 areaOctober 29th BTC Contract Technical Analysis:
Today, on the daily chart, yesterday closed with a small bearish candle, indicating a continuous decline. The price remains at a high level, and the accompanying indicators show a golden cross. Although the current decline is significant, the price hasn't broken down further, suggesting a range-bound trading pattern. Therefore, our trading strategy should be to sell high and buy low within this range; the high is around 116500, and the low is around 107000. On the hourly chart, the price was under pressure during the US session and continued to decline during the Asian session. Currently, there is a slight rebound, but the trend remains bearish. Therefore, we should expect a further decline and a break below the lows during the European session.
Today's BTC Short-Term Contract Trading Strategy:
Sell at 113200, stop loss at 113700, target 111700.

BTC. a longterm perspective :(I read that this recent BTC strength was caused by retail investor wave and that whales are sleeping. If we look from a longterm perspective -> we forget initial CUP n HANDLE pattern, and where it's next PEAK was.
this was also a 3rd wave. Still bullish longterm tho.

Bitcoin trading ideas and strategiesOn the daily chart, Bitcoin's four-day winning streak came to an end this morning. The candlestick chart showed a long upper candlestick with a hammer candlestick pattern. However, the price ultimately closed above the 60-day moving average, maintaining its key support level.
The Bollinger Bands are continuing to narrow, and volatility is gradually narrowing amidst the current bull-bear tussle. The KDJ indicator's fast line is showing signs of slowing at high levels, suggesting a short-term correction. The MACD lines maintain a golden cross pattern and diverge upward, with continued volume growth. Funding is providing some support for bulls, who remain in the driver's seat.
Trading Strategy: Go long between 113,000 and 113.5,000, with a target around 116,000.

BTC/USD Breaks Descending Channel – Targeting $116K After BullisAsset: Bitcoin (BTC/USD)
Exchange: Bitstamp
Timeframe: 30-minute
Current Price: $108,168
Trend: Breakout from descending channel; potential bullish reversal forming.
🔍 Key Chart Features:
Descending Channel (Yellow Trend Lines)
Bitcoin was trading inside a well-defined downward-sloping channel.
Multiple touchpoints confirm the validity of the pattern.
The price has now broken out above the upper trendline, suggesting a shift in momentum.
Buy Zone (Purple Rectangle, ~$105,600 – $106,300)
Marked as “ZONE BUY.”
This acted as a strong support zone where price bounced.
Aligns with previous reaction lows.
Breakout Confirmation
The breakout from the channel, followed by a higher low within the buy zone, confirms bullish sentiment.
Immediate rally of +1.85% (1,970 points) adds weight to the breakout.
Target Projection: $116,052
Based on measured move (channel height or breakout projection).
Represents a potential +9.5% upside from breakout region.
Shown with a large blue arrow indicating bullish target zone.
🧠 Interpretation:
Current Market Structure:
A trend reversal is likely underway after prolonged selling pressure.
Bullish Setup:
Rejection from the buy zone with a sharp move up.
Break of channel trendline + confirmation pullback = classic reversal pattern.
Upside Target:
$116,052, if momentum holds and support zones remain protected.
Risk Management:
Invalidation level: Below $105,600 (bottom of the buy zone).
Consider trailing stop-loss as price rises.
✅ Summary Strategy:
Entry Zone: ~$106,000 (within Buy Zone or breakout retest)
Stop-Loss: Below $105,600 (buy zone base)
Target: ~$116,052
Reward/Risk: Attractive (approx. 9.5% potential upside vs ~1.5% risk)

BITCOIN SIGNAL: SHOCKER TARGET REVEALED!!! (warning) Yello Paradisers! Enjoy the video!
And Paradisers! Keep in mind to trade only with a proper professional trading strategy. Wait for confirmations. Play with tactics. This is the only way you can be long-term profitable.
Remember, don’t trade without confirmations. Wait for them before creating a trade. Be disciplined, patient, and emotionally controlled. Only trade the highest probability setups with the greatest risk to reward ratio. This will ensure that you become a long-term profitable professional trader.
Don't be a gambler. Don't try to get rich quick. Make sure that your trading is professionally based on proper strategies and trade tactics.

BTC breaks through resistance, go long at low levelAfter the weekend break, we’ve entered the final week of October. Bitcoin maintained its strong performance over the weekend, and the current price has rebounded to the 115.4K level again, setting a bullish tone for the new week’s market.
From the daily timeframe perspective, the market’s bullish momentum continues to unfold: the candlesticks show a steady upward trend with consecutive bullish candles, indicating strong continuity of the bullish trend. Since the rebound from the previous low, the price has risen in a stepped manner and has successfully broken through the resistance of the Bollinger Bands’ middle band in the short term, presenting a clear upward trend on the technical side.
Going forward, we need to focus on the breakout of the 120K key resistance zone. If this level is effectively held, the price is expected to refresh the recent high again based on the long-term trend analysis. As the upward trend remains intact, we can continue to adhere to the core strategy of "buying on dips" for our operations.
Considering the market rhythm on Monday morning, here’s a specific trading suggestion: for BTC, we can establish long positions within the range of 114K-113.5K, with the target looking at the 116K-118K level. After entering the position, we can set a stop-loss below the lower edge of the entry range to cope with short-term fluctuation risks.
BTCUSDT TradeI when trading in IG:BITCOIN try come to breakeven in big candle for again entry buy or sell.
But you need fix target or trailing stop on new swing in profit.
Please have risk management.

Inside the channel and Flies.If you look at market patterns and Bollinger bands, price always goes from high volatility to price discovery, tightens. Market shows clear direction, ie 🟢 or 🔴.
The same when using longterm charts, they fluctuate and you can almost find where the important channel gonna be.
It's psychology.
85% bullish. 15% it fails, imo.:)

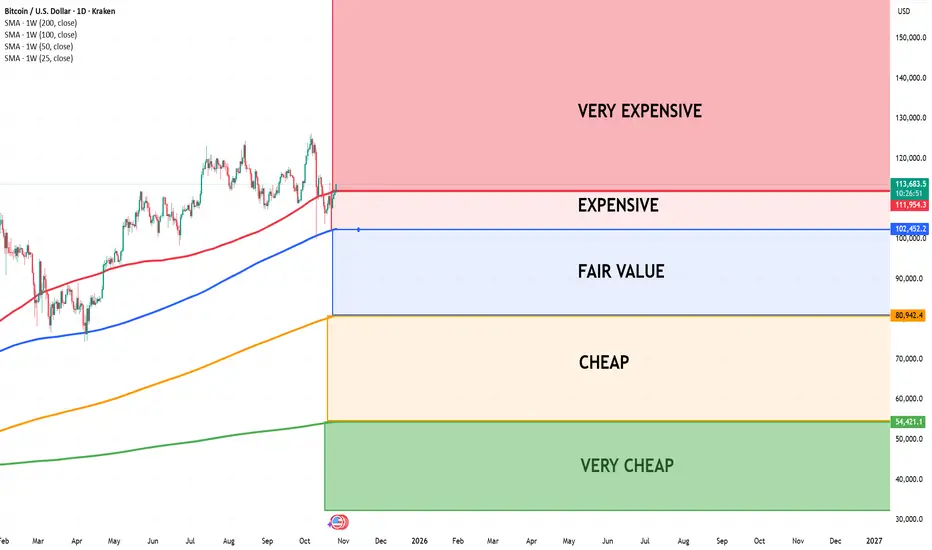
Bitcoin entering Very Expensive areaI use four key Moving Averages — the 25W, 50W, 100W, and 200W — to assess whether Bitcoin is overvalued or undervalued.
Bull Market Strategy:
When Bitcoin touches the 50-week Moving Average (50W MA) during a bull market, it often represents its fair value — typically an excellent buying opportunity.
Expensive Zone:
When Bitcoin trades above all four moving averages (25W, 50W, 100W, 200W), it enters the expensive zone. In this phase, we can usually expect a short-term continuation upward, followed by a pullback to retest or cross below some of the averages.
Bear Market Strategy:
During bearish periods, patience is key. The best long-term entry opportunities often occur when Bitcoin drops below the 200-week Moving Average (200W MA) — historically marking undervalued territory.
Based on current cycles, this scenario may unfold again around 2026.
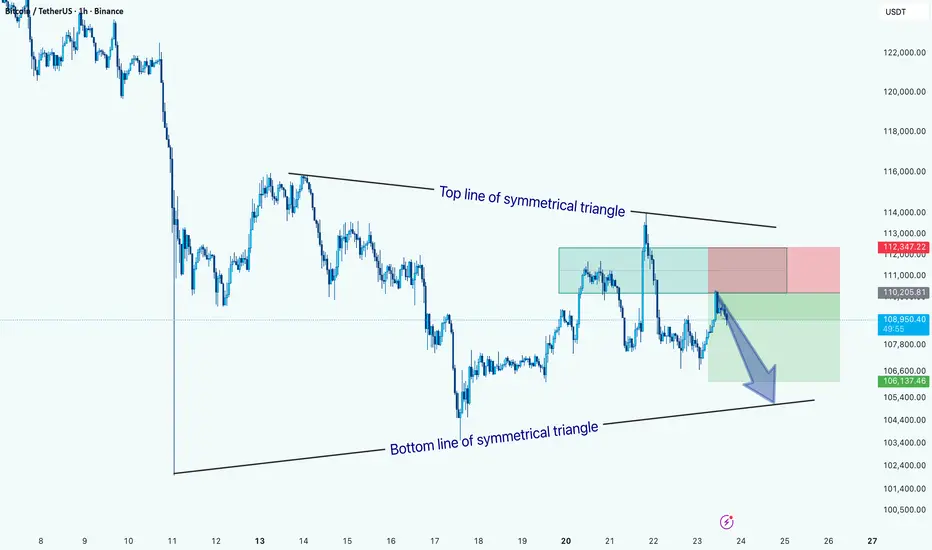
BTC/USDT: Symmetrical Triangle Signals Potential Downside MoveHi!
The price action is currently forming a symmetrical triangle pattern, marked by converging trendlines, the top line showing lower highs and the bottom line showing higher lows.
At present, BTC is trading near the upper half of the pattern but has recently faced rejection from the top trendline, indicating potential bearish pressure. The highlighted setup suggests a short position targeting a move toward the bottom boundary of the triangle around $106,000–$105,500, with a stop loss near $112,300.
A confirmed break below the lower trendline could accelerate bearish momentum, while a breakout above the top line would invalidate this bearish scenario and signal possible trend reversal.
Bias: Bearish within the symmetrical triangle until a clear breakout occurs.
Key Levels:
Resistance: $112,300
Support: $106,000 / $105,500
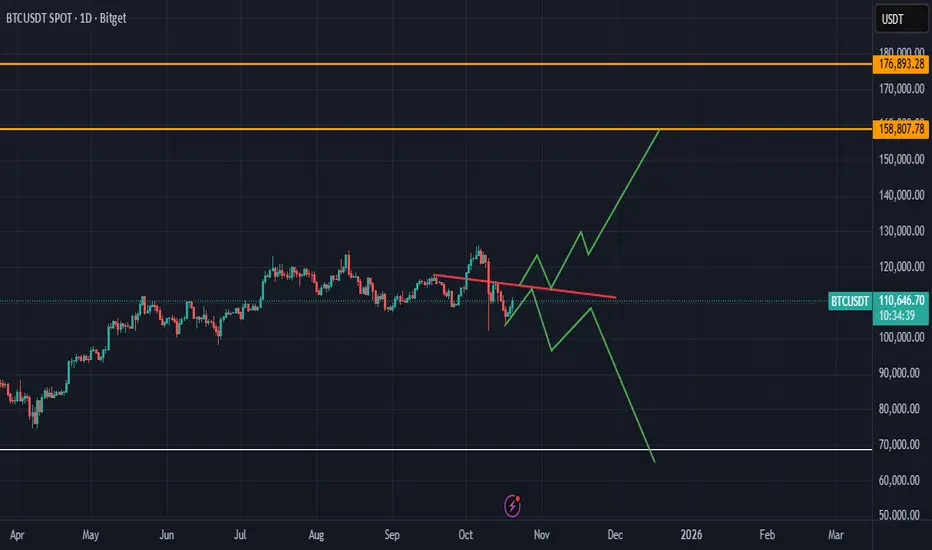
BTCUSD: Final Wave Before the Breakout or Stuck Five-Wing?BTCUSD: Final Wave Before the Breakout or Stuck Five-Wing?
Weekly Scenarios
Bullish scenario: BTC holds above ~$110,000, breaks through ~$120,000 → wave (5) activates → target ~$135,000–$140,000.
Consolidation: Trading between ~$110,000 and ~$120,000; the market is building strength for the next round.
Bearish scenario: Break of support at ~$110,000 with volume confirmation → correction begins to ~$100,000–$105,000.
Conclusion
The weekly analysis shows that the BTC/USD market is at a crossroads: either the final wave of growth begins, or a correction begins.
Holding the ~$110,000 zone is critical for maintaining bullish sentiment.
A breakout above ~$120,000 is a signal for growth.
A breakout below ~$110,000 is a signal for caution.

technical analysis for your BTC/USD chart:Pair: Bitcoin / U.S. Dollar (BTC/USD)
Current Price: around $111,628
Structure: Ascending channel pattern
Key Zones:
Resistance Level: $112,000 – $112,500
Target Level (Support): $106,572
📊 Technical Analysis
Trend Structure:
BTC/USD is moving within a rising channel, showing short-term bullish momentum.
Price is now approaching the upper boundary of the channel and a major resistance zone ($112,000–$112,500).
Resistance Reaction Expected:
This zone has previously rejected price, so sellers may re-enter around this region.
If price fails to break above the resistance, a bearish correction is likely.
Bearish Scenario (Primary Expectation):
A potential reversal from resistance is indicated on your chart.
Confirmation: A strong bearish candle or break below the midline of the channel.
Downside target: around $106,572, aligning with previous demand/support and the lower boundary of the broader channel.
Bullish Scenario (Alternative):
If BTC/USD breaks above $112,500 with volume, price could extend toward $113,500–$114,000 before any correction.
⚙️ Trading Plan (Summary)
Direction Entry Zone Stop-Loss Target
🔻 Short (Sell) 112,000 – 112,500 Above 113,000 106,600
🔺 Long (Breakout) Above 112,500 (confirmed) Below 111,800 113,500 – 114,000
🧩 Technical Indicators (Implied)
Trend Channel: Uptrend but nearing exhaustion.
Volume: Likely decreasing as price nears resistance (sign of weakening momentum).
Market Sentiment: Short-term bullish → potential reversal zone ahead. RUS:SBER RUS:VTBR RUS:LKOH RUS:ROSN RUS:MOEX RUS:PLZL RUS:T RUS:NVTK RUS:AFLT RUS:SMLT

BITCOIN + ETH SIGNALS: MASSIVE MOVE INCOMING!!!(Nobody Watching)Yello Paradisers! Enjoy the video!
And Paradisers! Keep in mind to trade only with a proper professional trading strategy. Wait for confirmations. Play with tactics. This is the only way you can be long-term profitable.
Remember, don’t trade without confirmations. Wait for them before creating a trade. Be disciplined, patient, and emotionally controlled. Only trade the highest probability setups with the greatest risk to reward ratio. This will ensure that you become a long-term profitable professional trader.
Don't be a gambler. Don't try to get rich quick. Make sure that your trading is professionally based on proper strategies and trade tactics.

$BTC might explode after the washout!CRYPTOCAP:BTC is once again reacting strongly from the lower channel support, similar to the previous green-circle bounces we’ve seen this year.
Each green circle has marked key accumulation points — followed by strong upside momentum.
Meanwhile, red circles highlight resistance rejections where profit-taking zones formed near the upper channel boundary.
🧭 Key Levels to Watch:
Support: $106.8K – $110.5K
Resistance: $120.1K – $123.5K
Trend: Holding firmly inside the rising channel
If CRYPTOCAP:BTC continues to respect the green zone, we could be looking at the early stages of another leg up toward the top of the channel.
But if support fails, expect a deeper retest of the lower structure.
Note:
History doesn’t repeat perfectly — but it rhymes. Stay calm, stay patient, and let the chart tell the story.

BTC Trade Set Up Oct 23 2025Btc has come into 1h supply and respected it with price making LH on the 15m and a BOS on the 15m so i will be taking sells to lower SSL that have not be tapped yet

Perfect prediction of BTC trend, today's retracement continuesWith the emergence of the double top structure, gold and silver investors have been taking profits, and market funds have continued to flow into crypto assets led by BTC and ETH.
Historically, BTC and the broader cryptocurrency market have risen after gold peaks, driven by capital rotation.
In his opening remarks at the Federal Reserve's first Payment Innovation Conference held today, Federal Reserve Governor Waller spoke highly of cryptocurrencies and the "DeFi industry." Waller noted that the conference aims to explore how blockchain and cryptocurrency can be integrated into mainstream finance.
At the same time, the Federal Reserve also indicated that it would create a new era in the payment field, and the DeFi industry would not be doubted or despised.
Waller also revealed that he has proposed setting up a new type of account at the central bank, which he called a "payment account." Waller said he has asked the Fed to consider this new type of account, which would make it easier for businesses to access the central bank's payment channels without having to have a full master account. This move has clearly increased market attention for cryptocurrencies.
In the subsequent BTC trading market, we can once again use 109500-108500 as short-term support, and go long on pullbacks to see rebounds. Pay attention to the 113000-115000 resistance zone above. If the momentum is maintained, it may move towards 120000.
BITSTAMP:BTCUSD BITSTAMP:BTCUSD

BTC-----Buy around 107400, target 109000 areaOctober 22nd BTC Contract Technical Analysis:
Today, the large-scale daily chart closed with a medium-sized negative candlestick pattern. The candlestick pattern showed consecutive positive lines with a single negative line, but the price was below the moving average. The accompanying indicator formed a death cross, and yesterday's closing line had a long upper shadow. Therefore, based on the trend pattern and trend structure, the overall downward trend is still dominant and obvious. Trading should remain short-term, as we are engaged in short-term contract trading. What matters is the success rate and accumulation of profits. We must not mistake the direction. The short-term hourly chart showed a high early morning price rise and then a pullback under pressure. The current candlestick pattern shows a series of negative lines, but the price is near the low support level, so it is not appropriate to sell directly during the day. Watch for a break of the 107,400 area. If it does not break, you can try to buy, with a stop loss at the 106,800 area and a target of 109,000. Real-time trading is based on the real-time intraday trend.

Bitcoin rebound shortBitcoin's intraday market is under pressure and has retreated. Bullish sentiment has weakened, and prices are testing downwards. Currently trading at 119.6K, this correction has already wiped out the intraday gains, and the short-term support level of 110K has been broken. Looking at the hourly chart, the rebound is under pressure again, signaling a short-term correction. There is a risk of further price declines, so be prepared. The current trend is biased downward, so short positions on rallies are recommended. Focus on short-term resistance at 111.2K above, and support at 106.4K below.
If you're feeling lost and unsure about the market, follow my updates and channel. I'll provide daily updates, including details on long- and short-term trade execution. If you're interested, please share your current positions and we can analyze whether it's safer to hold on or adjust and change your positions.

Pay attention to the Payment Innovation ConferenceOn October 21, the Federal Reserve will hold a payment innovation conference that could rewrite the industry landscape, inviting top cryptocurrency companies such as Chainlink, Circle, and Coinbase to its Washington headquarters. This conference precisely targets the core players in the entire chain of stablecoins, infrastructure, and trading terminals. However, it is worth noting that if the meeting only discusses the direction without details, the BTC market may pull back in the short term.
Looking at technical indicators, the short-term MACD has broken through the signal line, reflecting a bullish change, but the divergence signal of the RSI may foreshadow a short-term pullback. Based on the above information, BTC is likely to experience a short-term correction followed by an upward trend. Focus on the lower levels of 109,700-109,300 in the short term, with key support at 107,500-106,500. Above this level, focus on the short-term resistance levels of 111,000-112,000. A break above this resistance level could lead to a move towards 114,000-115,000.
BITSTAMP:BTCUSD

BITCOIN SIGNAL: HUGE WHALE GETTING READY TO DO THIS NOW!!(scary)Yello Paradisers, enjoy the video!
And Paradisers! Keep in mind to trade only with a proper professional trading strategy. Wait for confirmations. Play with tactics. This is the only way you can be long-term profitable.
Remember, don’t trade without confirmations. Wait for them before creating a trade. Be disciplined, patient, and emotionally controlled. Only trade the highest probability setups with the greatest risk to reward ratio. This will ensure that you become a long-term profitable professional trader.
Don't be a gambler. Don't try to get rich quick. Make sure that your trading is professionally based on proper strategies and trade tactics.

Bitcoin: Possible Scenarios on the Daily Chart🔴 Watch the red line!
If BTC breaks above — bulls take control.
If not — expect another drop.
Always manage your risk around reversal zones! 💥
#Bitcoin #BTC #Crypto #BTCUSD #CryptoTrading #TradingSetup #DailyChart #PriceAction
You will ask yourself "how did he know Btc would crash to 103K"?On Sept 23rd I suggested if Btc continues to follow this Eth fractal it would soon bottom at 102K (see chart below). Btc just crashed to 103K on Friday.
Fractals can act as maps for future price action. But they often deviate from the "expectation" at the worst time. I will follow this fractal until it stops working. Hope it has guided you well.
Between this Eth fractal (posted a month ago) and the "3 red week down rule" charts that I have been posting...it's safe to say we seen this week's (historic) dump coming . TA works!
I say this not to brag, but show the disbelievers that TA works (I encourage you to learn). And Also I keep track of my stats on my calls, to track my win ratios. You should too, how else would you know if it's worth following someone's predicitons.
May the trends to be with you.
