BitcoinBTCUSD
- Fair Value Gap
- Change of Characteristics
- Bullish Channel as an corrective pattern in Long Time Frame
- RSI - Divergence
- Order Block
Btctrading

BTC/USD 4H – Range Breakout Holding Above Key Support*Overall Market Structure
Trend: Short-term bullish continuation
BTC has broken out of a prior consolidation range and is making higher highs and higher lows.
Price is currently above a key support zone, suggesting strength.
📦 Key Zones & Levels
🟦 Major Support Zones
$89,750 – $91,350 (Primary Support)
Former resistance → now acting as support
Price is currently retesting this zone
Strong area for bullish defense
$85,800 – $87,600 (Secondary Support)
Previous accumulation range
If price loses the upper support, this is the next high-probability bounce zone
🎯 Resistance / Target
$98,200 (Target Point)
Clear horizontal resistance
Matches prior rejection / liquidity area
Logical upside target if support holds
📈 Bullish Scenario (High Probability)
Price holds above $89.7k
Consolidation or shallow pullback
Continuation move toward:
$94k → $98.2k
Break and close above $98.2k could open the door to $100k psychological resistance
📉 Bearish / Pullback Scenario
Loss of $89.7k support
Price likely revisits:
$87.6k
Then $85.8k
As long as price stays above $85.8k, the macro bullish structure remains intact
🧠 Market Behavior Insight
The clean breakout + retest pattern suggests smart money accumulation
Sharp rejection from support would confirm buyers in control
Choppy price inside the support zone = healthy consolidation, not weakness
✅ Summary
Bias: Bullish
Key Level to Watch: $89,750
Upside Target: $98 200
Invalidation: Clean 4H close below $85,800

Bitcoin’s Structure Is Speaking — Are You Listening?Hello Traders,
If you zoom out and look at Bitcoin calmly, one thing becomes very clear, price is not breaking down, it is building structure. The current movement may look slow on the surface, but underneath, the market is still behaving in a controlled and bullish manner.
Big Picture:– Structure Matters More Than Noise
Bitcoin is currently trading inside a Rising Structure / Bullish Range.
This structure is defined by higher lows and a gradually rising price channel, which tells us that buyers are still in control despite short-term pullbacks.
The upper trendline is acting as dynamic resistance, where temporary profit booking appears.
The lower trendline continues to act as strong support, showing consistent demand on dips.
As long as this structure remains intact, the broader bias stays bullish.
High-Probability Accumulation Zone
This 90.2k – 89.5k zone marked on the chart is not random.
This area was previous resistance , which has now flipped into support.
Price is consolidating above this zone , not breaking below it, a strong sign of acceptance.
Sellers are failing to push price lower , indicating absorption of supply.
This is why this region qualifies as a high-probability accumulation zone, not a chasing zone.
Upside Targets – If Structure Holds
If Bitcoin continues to respect the demand zone and the rising structure, these levels come into play naturally:
Target 1 → 91,825
Target 2 → 93,790
Target 3 → 96,027
These are not predictions :— they are logical reaction levels based on structure and range expansion.
Risk Side:– Structure Invalidation
Every bullish structure has a clear line in the sand.
A clean breakdown below 87,600 would invalidate the current bullish structure.
If that happens, the market would need time to rebuild acceptance before any sustainable upside continuation.
Strong trends don’t start from excitement :—they usually start from patience.
Conclusion :- At the moment, Bitcoin is:
Holding above key demand
Respecting its rising structure
Consolidating instead of breaking down
The next major move will depend not on speed, but on how price reacts around this zone.
If this analysis helped you see the chart more clearly, share your view in the comments,
I’m always open to discussing structure with serious traders.
Analysis By @TraderRahulPal | More analysis & educational content on my profile.

Bitcoin (BTC/USD) – 4H Supply Zone Rejection & Bearish Pullback *Market Structure
* Overall bias: Short-term bearish / corrective, within a larger bullish structure.
Price made a strong impulsive move up into a higher-timeframe supply / demand reaction zone.
That rally looks exhausted (sharp rejection + projected pullback).
📍 Key Zones on the Chart
🔴 Upper Zone (93,000 – 94,000)
Marked as DEMAND ZONE, but functionally acting as a sell-side reaction / supply flip.
Multiple prior rejections → liquidity & institutional selling area.
The wick into ~94,000 suggests stop-hunting / distribution.
This is the invalidation zone for shorts if price holds above it.
🟢 Entry / Short Zone (~92,200 – 93,900)
The red/green box indicates a short trade setup:
Stop-loss: Above ~94,000
Entry: After rejection inside the zone
The structure shows lower high formation after the rally → bearish confirmation.
🎯 Downside Targets
Target 1: ~88,100
Clear horizontal support
Previous consolidation base
Likely first reaction / bounce area
Target 2 (extension): ~87,980
Equal lows / liquidity pool
Possible sweep + reversal area
📉 Price Action Logic
Strong bullish leg → enters HTF zone
No continuation, instead:
Sharp rejection
Failure to hold highs
Projection arrow suggests:
Liquidity grab above highs
Followed by mean reversion / retracement
This is classic “buy-side liquidity taken → sell-side move” behavior.
⚠️ What Would Invalidate This Setup?
4H close above ~94,000
Strong acceptance above the red zone
That would imply continuation toward 95k+
🧠 Summary
Bias: Short-term bearish pullback
Setup: Short from supply zone
Targets: 88k → 87.9k
Risk: Above 94k
Context: Healthy correction within a larger uptrend

BTC/USD 4H – Range Consolidation with Demand Zone Targeting ResiMarket Structure
Overall structure:
BTC is moving sideways / range-bound after a prior decline.
Price is clearly respecting a range:
Resistance (range high): ~90,500 – 90,600 (marked as Target Point)
Support (range low / demand): ~85,000 – 86,000 (Demand Zone)
This indicates consolidation, not a confirmed trend yet.
2. Key Levels on the Chart
3.
🔴 Demand Zone (Support)
Zone: ~85,000 – 86,000
Multiple reactions here → strong institutional demand
Long lower wicks inside this zone suggest buyers defending aggressively
If price revisits this zone:
Bullish reaction = continuation of range / possible breakout attempt
Clean break below = bearish continuation toward lower liquidity
🟢 Resistance / Target Point
Level: ~90,500 – 90,600
Price has been rejected multiple times
This is a major liquidity & supply zone
A clean 4H close above this level would be a bullish breakout confirmation
3. Current Price Behavior
Price is currently mid-range (~87,900) → no-man’s land
This area has:
Low R:R for new trades
Choppy price action
The small zig-zag drawn suggests expected pullback first, likely into demand before expansion.
4. Trade Scenarios (Based on Chart Logic)
🟢 Bullish Scenario (Higher Probability if Demand Holds)
Price pulls back into 85k–86k demand
Shows reaction (long wicks / bullish candles)
Continuation toward:
TP1: 88,500
TP2: 90,500 (range high)
Risk-reward shown on chart (~1:3+) looks healthy.
🔴 Bearish Scenario (If Demand Fails)
Clean breakdown below ~85,000
Likely acceleration toward:
83,500
82,000 (next visible liquidity below)
This would invalidate the current long setup.
5. Bias Summary
Short-term: Neutral → slightly bullish
Mid-term: Range trading
Key confirmation:
Above 90.6k → bullish breakout
Below 85k → bearish continuation

BTC / USD Long IdeaBTCUSDT – Bullish Continuation Setup
⚠️ Disclaimer
This is for educational purposes only and should not be considered financial advice.
Always apply proper risk management and confirm signals with your own analysis.

BitcoinBTCUSD
- Consolidation Phase
- Break of Structure
- Symmetrical Triangle as an corrective pattern in Short Time Frame
- RSI - Divergence
- Impulse and " AB " Correction

BTC at Critical Crossroads: $80.5K or $90K Next?BITCOIN (BTC/USD) | Daily Chart | Technical Analysis
Current Price: $87,680 | Date: January 1, 2026
📊 PRICE ACTION OVERVIEW
📉 Strong bearish momentum since October 2025 - BTC crashed from all-time highs of ~$125,000 down to current levels near $87,680
💥 Major breakdown visible with sustained selling pressure - price has declined over 30% from peak
🔴 Currently testing critical support zone around $87,000-$88,000 after extended downtrend
⚠️ Lower highs and lower lows pattern intact - bearish structure remains dominant
📍 Price consolidating near key support with recent candles showing indecision
🎯 KEY TECHNICAL LEVELS
Resistance Zones:
$90,500 - Immediate resistance level marked on chart; psychological barrier that needs to break for any meaningful recovery
$95,000-$100,000 - Major overhead resistance zone where significant selling pressure accumulated
Support Zones:
Current support: $87,000-$88,000 - Price defending this critical zone; multiple tests visible
$80,500 - Strong support level/Target Point indicated by arrow; represents next major support if current level fails (~8% decline from current price)
Price Targets:
📍 Downside target: $80,500 as highlighted on the chart
🎯 Recovery resistance: $90,500 must be reclaimed to shift momentum
💪 Major breakout level: $95,000+ needed to invalidate bearish structure
🌐 MARKET CONTEXT
😨 Crypto Fear & Greed Index at 23 (Extreme Fear) - investors remain highly cautious
📊 BTC trading near $87,680, down ~7% year-on-year despite strong institutional interest
🏦 Analysts predict BTC could reach $90,000-$92,000 by late January 2026, with bullish targets of $120,000-$150,000 by year-end
⚡ Strategy Inc. faces critical decision around January 15th regarding major equity fund inclusion - could impact BTC significantly
📈 Exchange outflows increased 132% (from 16,563 BTC to 38,508 BTC) suggesting accumulation despite price weakness
🔄 Market trapped in consolidation since mid-November between $85,000-$93,000 - breakout imminent
💼 Institutional adoption continues with major corporations adding BTC to portfolios
💡 TECHNICAL OUTLOOK
🎯 Short-term bias: Cautiously Bearish - sellers have controlled price action for months, but support is holding
⚠️ Critical decision point: $87,000-$88,000 support - breakdown here accelerates move toward $80,500 target
🚧 Resistance challenge: Bulls need to reclaim $90,500 first, then $95,000 to shift momentum and signal reversal
📉 Bear scenario: Break below $87,000 with volume opens path to $80,500, invalidating any recovery hopes short-term
🔄 Bull scenario: Daily close above $88,300 (+1% from current) could trigger first breakout attempt toward $90,500-$92,000 zone
⚖️ Neutral positioning: Smart money showing no clear directional bias yet - waiting for confirmed breakout
🔥 Key catalyst watch: January 15th Strategy Inc. decision could inject major volatility in either direction
------------------------------------------------------------------------------------------------------------------
⚠️ DISCLAIMER
This is technical analysis for educational purposes only. Not financial advice. Always do your own research and manage risk appropriately.

Bitcoin (BTCUSD) 4-Hour Chart – Range Rejection at Resistance, BMarket Structure
Overall bias: Bearish to corrective
Price is trading below a major resistance zone and failing to establish higher highs.
Structure shows range behavior with downside pressure after rejection from the upper supply.
🟥 Major Resistance Zone (Supply)
Area: ~90,400 – 93,600
Multiple rejections from this zone confirm strong seller presence.
The current price is approaching the lower boundary of resistance, making this a high-risk buy area.
📉 Price Action Insight
Recent candles show:
Weak bullish follow-through
Overlapping candles → lack of momentum
The projected zig-zag move suggests liquidity grab upward before a potential sell-off.
🟩 Downside Target / Support
Primary target zone: ~85,200 – 85,600
This level aligns with:
Previous strong reaction lows
Equal lows / liquidity pool
Marked clearly as “TARGET POINT” on your chart.
📌 Probable Scenarios
❌ Bearish Continuation (Higher Probability)
Price taps into 90.4k – 91k
Shows rejection (long wicks / bearish engulfing)
Downside move toward:
88,000
86,500
85,200 – 85,600 (main target)
✅ Bullish Invalidation Scenario
A strong 4H close above ~93,600
Would invalidate the resistance
Opens upside toward:
95,000
97,000
🧠 *Trading Insight
Best* location: Shorts from resistance, not chasing price mid-range.
Wait for confirmation inside the red zone.
Risk-to-reward strongly favors short setups unless resistance breaks cleanly.
🔑 Summary
Trend: Range → bearish bias
Resistance: 90.4k – 93.6k
Target support: 85.2k – 85.6k
Bias: Look for sell confirmation at resistance

“BTC/USD 4H – Demand Zone Reaction Targeting 93K Resistance”Market Structure
Overall structure: Ranging → potential bullish continuation.
Price has been consolidating between ~85k and ~92–93k.
No lower lows recently → selling pressure is weakening.
2. Demand Zone (Key Support)
Marked demand zone around ~83,500 – 85,500.
This zone has:
Multiple strong reactions
Long wicks and quick bounces
Indicates institutional buying interest.
As long as price holds above this zone, bullish bias remains valid.
👉 A clean breakdown and close below ~83.5k would invalidate the setup.
3. Current Price Action
Price is currently around ~87.8k.
You can see:
Compression / sideways movement
Higher lows forming after the last dip
This often precedes an impulsive move.
4. Target & Projection
Target zone: ~92,500 – 93,100 (clearly marked).
This aligns with:
Prior resistance
Liquidity above previous highs
The green box shows a favorable risk–reward from demand to target.
5. Trade Idea Logic (Implied)
Bullish scenario:
Entry: Reaction from demand or bullish break of consolidation
Stop: Below demand (~83.5k)
Target: ~93k
R:R ≈ 3:1 or better
Bearish invalidation:
Strong 4H close below demand
Acceptance below ~83.5k → opens downside continuation
6. What to Watch Next
Bullish confirmation:
Strong 4H close above ~89–90k
Increased volume on upside
Warning signs:
Weak bounce from demand
Long upper wicks near 90k (selling pressure)
Summary
🟢 Bias: Bullish while above demand
📍 Key support: 83.5k–85.5k
🎯 Target: ~93k
❌ Invalidation: Clean break below demand

Bitcoin Daily Analysis #15 – December 31, 2025🚀 Let’s dive into today’s Bitcoin analysis
📌 Here we have the final analysis of the year.
Bitcoin looks primed for a move — don’t miss it!
🎄 After the Christmas and New Year holiday period comes to an end, there’s a strong possibility that market volume will return rapidly.
📊 On the 4-hour timeframe , Bitcoin is currently trading inside a defined range (box).
Price has reacted clearly to the top, bottom, and midline of this channel.
🔍 We’ve seen:
• One fake breakout from the lower boundary
• Two rejections from the top of the range
This behavior suggests that a significant move may be approaching, especially with global markets about to reopen.
🎯 The $90,000 zone isn’t a bad trigger for a long position,
but in my view, the $86,000 level is a much stronger trigger — and could serve as a solid short opportunity if broken.
🧠 As always, we’ll stay patient and wait for real-time price action and market reaction.
Based on the conditions at that moment, we’ll execute one of these scenarios with confirmation.
📈📉 Stay sharp. Stay disciplined.
-Larry D.Kohn
This content is for informational purposes only and does not constitute financial or investment advice. © DIBAPRISM

Bitcoin updateYearly chart:
The 2025 yearly chart looks like shit right now. This is the first time in Bitcoin history that the year is closing with a "Shooting Star". Usually, Market Makers try to "save" the year-end. I expect a push to close the yearly candle with a thin body or even close above the Yearly open. 2026 will likely be full of "fuckery" and the start of a bear market, so one last pump makes sense.
Weekly chart: (The 7 week rule)
We’ve been stuck in this $86.3k – $100k range for 7 weeks now. Bitcoin is currently "swimming" at the very bottom of this weekly trading range I follow since Q1 2025. History shows BTC rarely stays in one range for more than 8 weeks. On the 7th week, the direction usually flips. We are at the very edge atm, Eather it holds or it breaks...
The Monday range is officially set. Today is the final day for Market Makers to manipulate price action on the Low Time Frame (LTF) before the year ends.
BTC is currently hovering between key levels. Once it clears the major liquidity pools, we can look for higher-conviction trades.
The Data:
Liquidity Heatmap: The largest liquidity pool has shifted toward ~$86.3k (around the Previous Week Low, as explained yesterday). There’s a high probability we hunt this level first before MMs push the price back up.
OI & CVD: Open Interest (OI) is rising, while CVD and price remain sideways on the 4H. This divergence suggests a major move is brewing. The question is: where will that OI be unleashed?
The Scenario: On the other hand, today could bring a year-end surprise. We might see BTC push higher just to ensure a strong yearly close.
Could we see both today, by a hunt for liquidity followed by a pump? Let’s wait for the market to show its hand before stepping in...

BTC/ISD)Bullish trend analysis Read The captionSMC Trading point update
Technical analysis of BTCUSDT – 1H chart using SMC + Fibonacci OTE + EMA confluence.
⸻
Market Context
• Bias: Bullish continuation
• Clear impulsive bullish displacement broke previous structure
• Price is holding above EMA 50 & EMA 200
• Current move down is a controlled pullback, not a reversal
⸻
What the Market Is Doing
• After the impulse, price retraced to rebalance inefficiency
• Pullback is occurring into discount within an uptrend
• Structure remains intact → buyers still in control
⸻
Key Buy Zone (Blue Area)
~87,600 – 88,050
This zone is high-probability because of:
• Fib OTE zone (0.705 – 0.79)
• SMC demand / order block
• EMA 50 support (~87,983)
• Prior consolidation before impulse
• Long lower wicks → sell-side liquidity taken
This is where smart money typically reloads longs.
⸻
Fibonacci Logic
Measured from the impulse low → high:
• 0.5 / 0.62 = shallow retracement
• 0.705 – 0.79 = optimal trade entr
Ideal location for trend continuation setups
⸻
Trade Idea (Continuation Long)
Buy on confirmation inside demand
• Entry: 87,650 – 88,050
• Stop Loss: Below demand (~87,100)
• Targets:
• TP1: 88,900 (recent high)
• TP2: 89,600
• Final TP: 90,360 (marked target point / liquidity above highs)
Risk–Reward: ~1:3 to 1:4
⸻
Confirmation Triggers (Important)
Only enter if you see:
• Bullish engulfing or strong rejection wick
• Lower-timeframe CHoCH
• Failure to accept below the OTE zone
• Momentum expansion after tapping demand
⸻
Invalidation
• 1H close below ~87,100
• Acceptance below EMA 50 + demand
If this happens → bullish idea is invalid, and price may seek deeper liquidity.
⸻ Mr SMC Trading point
Summary
This is a textbook bullish continuation setup:
• Strong impulse
• OTE + demand + EMA confluence
• Clear upside liquidity target
Please support boost this analysis

Bitcoin (BTC/USD) – 4H Bearish Rejection from Major Resistance Market Structure
Overall Bias: Bearish / corrective
Price is forming lower highs after a strong rejection from the upper zone.
Market is ranging but biased to the downside below resistance.
📉 Key Technical Zones
1️⃣ Major Resistance Zone (Red Area)
Approx. 89,900 – 92,300
Price was strongly rejected here previously.
This zone aligns with:
Previous distribution
Supply imbalance
Any move into this area is likely to attract selling pressure.
2️⃣ Current Price Action
Price currently around 87,900
Forming a weak bullish retracement (corrective move).
The rising move looks corrective, not impulsive → likely a fake breakout or liquidity grab.
3️⃣ Target / Support Zone
Major support around 85,000 – 84,900
Marked as TARGET POINT
This area corresponds to:
Previous demand
Liquidity below equal lows
🎯 Trade Scenarios
🔴 Bearish Scenario (Primary)
Sell zone: 89,800 – 90,500 (inside resistance)
Stop-loss: Above 92,300
Targets:
TP1: 85,400
TP2: 84,900
Strong risk–reward with trend alignment.
🟢 Bullish Invalidation
A 4H close above 92,300:
Breaks resistance
Changes market structure
Opens upside toward 94,000 – 96,000
🧠 Summary
📉 Bias: Bearish below 92.3k
🔑 Resistance: 89.9k – 92.3k
🎯 Downside Target: 85k – 84.9k
❌ Invalidation: Strong close above resistance
If you want, I can also:

Bitcoin (BTC/USD) – Bearish Rejection From Resistance Targeting Market Structure
Overall bias: Bearish / distribution phase
Price made a strong impulsive move up, then stalled and began ranging under resistance.
Current structure suggests weak follow-through after the pump → typical liquidity grab + distribution behavior.
🟥 *Key Resistance Zone
Red* zone (~88,900 – 89,600)
Multiple rejections in this area
Marked clearly as Resistance level
Buyers failed to hold above → indicates supply dominance
🔄 Price Action Behavior
After rejection:
Price forms lower highs
Momentum is weak and corrective
The projected zig-zag shows:
Minor pullback upward (liquidity fill)
Followed by strong bearish continuation
🟩 *Target / Downside Projection
* Primary downside target: ~86,800 – 87,000
Previous demand / liquidity low
Matches the “TARGET POINT” drawn on the chart
Measured move aligns with:
Range breakdown projection
Prior impulsive leg base
❌ Invalidation
Bearish setup becomes invalid if:
Price breaks and holds above 89,600
Strong bullish close above resistance with volume
📌 **Trading Insight (Not Financial Advice)
** Bearish scenario:
Short on pullbacks into resistance with confirmation
Bullish scenario:
Only if BTC reclaims and holds above resistance
🧠 Summary
This is a sell-the-rallies structure
Resistance clearly respected
Downside liquidity likely to be targeted next

$BTCUSDT weekly analysis!BINANCE:BTCUSDT is testing a major confluence support where the rising trendline meets horizontal demand.
This zone has been respected multiple times in the past.
Holding here keeps the macro uptrend intact.
A weekly close below would open room for deeper correction.
Key zone to watch. No panic, no FOMO.

Elite | BTCUSD | Strong Range Accumulation After DistributionBITSTAMP:BTCUSD BINANCE:BTCUSD
After rejecting from the HTF resistance zone, BTC aggressively sold off and is now stabilizing inside a defined parallel range. Price is holding above the lower demand area, suggesting sellers are losing momentum. This structure favors a liquidity grab and expansion move once the range is resolved.
Key Scenarios
✅ Bullish Case 🚀
A sustained hold above 84,800 – 85,300 with bullish 4H structure shift opens upside expansion toward range high and HTF resistance.
🎯 Target 1: 96,800
🎯 Target 2: 104,000 – 106,000
❌ Bearish Case 📉
A 4H close below 84,000 invalidates accumulation and signals continuation toward HTF demand below.
Current Levels to Watch
Resistance 🔴: 96,800 → 104,000
Support 🟢: 85,300 → 84,000
⚠️ Disclaimer: This analysis is for educational purposes only. It is not financial advice.

Bitcoin Very Strong Key Levels to Mark on Your Chart ( BTC/USD )These are very strong Bitcoin levels identified through market structure and price action. I recommend marking them on your chart, as they can be very useful for future trading decisions.
Both proper buying and selling areas are clearly mentioned to help with planning trades around key zones.
If anything is not clear or you need clarification, feel free to ask in the comments.
⚠️ Shared for educational purposes only. Always use proper risk management.
🔖 Hashtags:
#Bitcoin #CryptoAnalysis #KeyLevels #PriceAction #SupportResistance #TradingEducation #MarketStructure

BTC-----buy around 86000-86300 , target 87800-89000 areaAs expected, BTC rebounded yesterday, turning bullish after a 12-hour losing streak. Buy orders placed below 87,000 successfully pushed the price up to the target of 89,500, resulting in a 2,500-point profit for long positions. From a technical perspective, BTC is currently consolidating within the 86,000-90,500 range.
The 89,500-90,500 area represents strong resistance. A failure to break through this level could trigger a short-term pullback; a breakout with significant volume could lead to a move towards the 91,000-92,000 range.
Support remains around 86,000-86,300. Holding above this area is considered a defensive buying zone.
Technical Analysis:
The 12-hour Bollinger Bands show clear signs of widening, with the middle band and moving averages providing good support. The 4-hour MACD shows decreasing selling pressure, and the RSI is approaching oversold territory, indicating continued short-term upward momentum. If the support around 87,500 holds, the price could potentially retest 89,500 or even 90,500.
Intraday Strategy Reference:
Buy Order: Buy in the 86000-86300 range, target 87800-89000, stop loss 85500;
Sell Order: Sell in the 90500-90300 range, target 89000-87500, stop loss 91000.
Core Viewpoint:
Intraday strategy should focus on buying on dips and selling on rallies, paying close attention to the key resistance level of 89500.

BTC will pump a lil or not?As you can see the green resistance line is broken and BTC is sitting on it and trying to make it a support line. But nothing is sure yet! if the 4-hour chart price close on top of the green line, there will be a good chance for a lil long profit till the red zone, followed by a BIG STRONG SHORT at the red zone down to hell !!! also don't forget about the daily candle which gonna close in 2 hours if you want a lil long profit. But it gonna be a really high risk long because as you can see we have already kissed the resistance line 3 times and even broke down the red bullish trendline. so BE VERY CAREFULL! I personally prefer a low leverage short from here rather than being greedy on that lil risky long profit.

BTC bull market is not over, how should we plan for the future?#BTCUSD BINANCE:BTCUSDT BITSTAMP:BTCUSD BITSTAMP:BTCUSD
The BTC market did not experience much volatility over the weekend, and today it only rose to near the 90500 resistance level before falling back again. Judging from the hourly and 4H charts, BTC still has room for a pullback and adjustment, and may need to consolidate again before breaking through the upper resistance. Short-term support is at 87800-87000. If it falls back to this level, we can consider taking a small long position in BTC. The key support level remains at 85500-85000. As long as this range holds, the bullish trend for BTC remains intact

Bitcoin BTC price analysisCRYPTOCAP:BTC is struggling to move higher.
Walls of limit orders are everywhere — sellers vs buyers — and OKX:BTCUSDT is basically stuck.
That’s exactly how consolidation & distribution phases look like.
🖐️ Trading manually right now?
Honestly — not the best idea. At this stage, mistakes often outnumber profits.
🤖 Meanwhile, trading bots keep doing their job:
• predefined ranges
• zero emotions
• steady volatility harvesting
👀 Retail traders (us) should wait.
When the “big money” finishes its battle and fires an impulse candle — that’s when we join the stronger side.
📊 Fear & Greed Index is slowly recovering:
from 10–11 last week → ~25 today.
🔑 Key CRYPTOCAP:BTC levels:
▪️ Resistance: $103K
▪️ Support: $84K
⚠️ Below $77K — the road toward $50K opens wide.
🎄 With holidays ahead, activity will likely drop even more.
For now — we observe, not trade.
🤔 What do you expect next for #Bitcoin: breakout or another leg down?
______________
◆ Follow us ❤️ for daily crypto insights & updates!
🚀 Don’t miss out on important market moves
🧠 DYOR | This is not financial advice, just thinking out loud

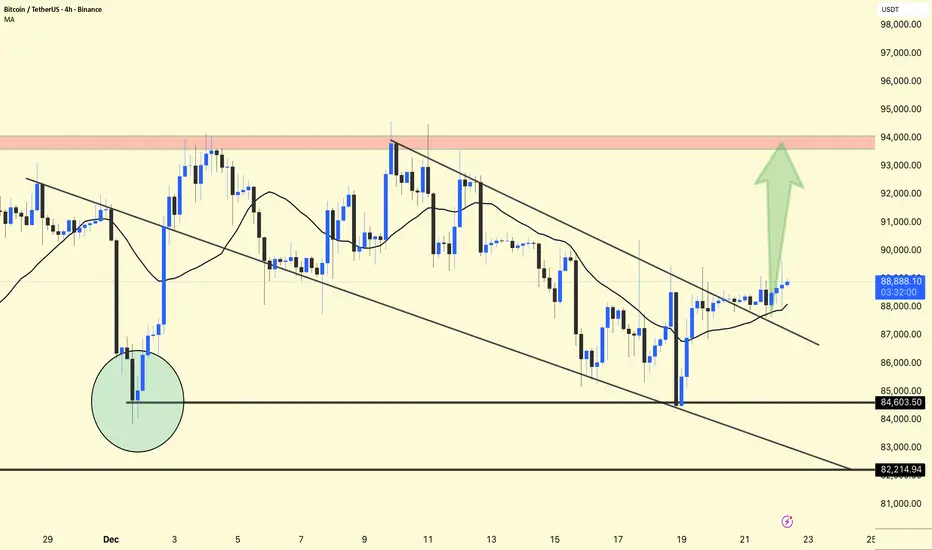
BTCUSDT –Chart Update (4H)BTCUSDT –Chart Update (4H)
Price is still inside a descending channel, but momentum is improving.
BTC is holding above 88,000 and forming higher lows.
A clean break & close above the channel can trigger upside continuation.
Support: 88,000 – 87,500
Major Support: 84,600
Resistance / Target: 93,500 – 94,000 zone
Cautiously bullish above 88K.
⚠️ Wait for confirmation; volatility remains high.
Not financial advice. Manage risk.