BITCOIN SIGNAL: ARE YOU SHORTING NOW LIKE EVERYONE ELSE?? (oops)Yello Paradisers! Enjoy the video!
And Paradisers! Keep in mind to trade only with a proper professional trading strategy. Wait for confirmations. Play with tactics. This is the only way you can be long-term profitable.
Remember, don’t trade without confirmations. Wait for them before creating a trade. Be disciplined, patient, and emotionally controlled. Only trade the highest probability setups with the greatest risk to reward ratio. This will ensure that you become a long-term profitable professional trader.
Don't be a gambler. Don't try to get rich quick. Make sure that your trading is professionally based on proper strategies and trade tactics.
Btctrading

BTC/USD – Potential Downtrend Continuation Toward Key Support"1. Descending Channel (Blue)
Price has been moving inside a downward sloping channel — lower highs and lower lows. This is a bearish pattern until broken convincingly.
Traders watch for price to stay inside or break out — a breakout above suggests potential trend reversal; a break below suggests continuation.
👉 The price recently bounced off the lower boundary, showing support at that channel floor.
---
🔴 2. Moving Average (Red Curve)
A moving average (likely something like a 200-period) is plotted. When price is below the moving average, it typically indicates bearish momentum; price above suggests bullish momentum.
Here we see price approaching that red line from below → this often acts as dynamic resistance for bulls.
---
🔵 3. Key Horizontal Support (Blue Line at ~85,170)
A strong horizontal “target point” / support level is marked.
This line represents a zone where buyers previously stepped in and could again if price falls.
The chart clearly marks this as target on downside if the current setup fails.
Support & resistance levels like this are some of the most watched areas on price charts — they act as floors and ceilings for price action.
---
🎯 The Trade Setup Illustrated
On the right side you see a green/red box which visually represents a trade idea:
🟢 Entry Area
The current price (~88,100–88,800) looks like the potential entry.
The green zone down below is the profit target zone.
🔴 Red Zone
This is the stop-loss area — meaning if price rises above ~90,000–90,400, the bearish setup would be invalidated.
📉 Directional Arrow Down
The big arrow pointing down suggests the analyst expects a move lower, from current levels toward the support around ~85,000+.
So the idea is:
If price fails at the descending resistance and moving average → enter short.
Stop above resistance / above high of red.
Target the lower support area.
This is classic channel-based trading logic: resistance to support → short trade.
---
🔎 Bull vs Bear Scenarios
🔻 Bearish Scenario (favored by this chart)
✔ Price confirms resistance at moving average / upper channel
✔ Breaks back down
✔ Moves toward target zone (~85,000)
This would follow the pattern of lower highs and lower lows.
📈 Bullish Break Scenario
If price breaks above the red moving average and upper trendline convincingly with volume, that would: ✔ Break the downtrend ✔ Signal potential for upside ✔ Invalidate the short setup
Volume confirmation for breakouts is crucial — without it, breakouts often fail.
---
🧠 Summary in Plain Terms
Trend: Currently still bearish inside a descending pattern.
Resistance: Moving average + upper channel line blocking upside.
Support: Strong horizontal area around mid-$80k’s.
Trade idea on chart: Short toward support, stop above recent highs.
Key levels drawn:
🚫 Stop zone: ~90,000+
🎯 Target zone: ~85,000ish

BTCUSD: 87K Resistance Hold Sets Stage for Short-Term Breakdown Price rejected at 87K (current: 86.9K); short entry at 86.9K, stop 87.2K, target 85.6K. Break above 87.2K invalidates. (30m chart)

BitcoinBTCUSD
- Completed " 1234 " Impulsive Waves
- Buy Side Liquidity
- Bearish Channel as an corrective pattern in Short Time Frame
- RSI - Divergence
- Order Block

BTC ShortIn the medium term, I am bearish 📉
Additional manipulation followed by a rebalancing of inefficiency will provide an opportunity to open a short position.

BTCUSDT: Range Structure & Reversal RiskHI!
Bitcoin is currently trading inside a well-defined range, where price action has formed a Head and Shoulders structure within the upper half of the range. The left shoulder, head, and right shoulder are clearly developed, signaling weakening upside momentum after repeated failures near range highs.
Price is now hovering near the range midline/neckline zone. A confirmed breakdown below this level would activate the pattern, opening the door for a move toward the 85,600–86,200 demand zone, which aligns with prior strong accumulation.
As long as the price remains below the right-shoulder high, bearish pressure dominates. However, a strong reclaim back above the head would invalidate the pattern and keep the price rotational within the range.

BTC 4H Chart Route MapDear Traders,
BTC has shown strong gains this week and has confirmed a short-term bullish trend across multiple confluences.
Wait for the price to pull back to the entry zone around IFVG & BPR area close to $89K–$91K before looking for TP1, TP2, and TP3, with your stop-loss set at $83,500.
Always trade with proper risk and money management.
The Quantum Trading Mastery

BTC/ISD) Beraish trend analysis Read The captionSMC Trading point update
Technical of analysis depicts a bearish descending channel*
on the BTC/USDT 4-hour chart with the following key elements:
1. Channel structure Price is moving within a clear descending channel (black parallel lines), indicating a sustained downtrend.
2. Breakout point: The black dot marks a recent break below the lower channel line, signaling potential continuation of the bearish momentum.
Mr SMC Trading point
3. Target: The projected downside target is ≈80,428.17 USDT, shown by the horizontal “target point” line.
4. EMA (200): The blue exponential moving average (200-period) is acting as dynamic resistance, reinforcing the bearish bias.
5. Price action: The latest candle closes at 89,037.66 USDT down -0.36% for the session, with reduced volume (-1.33% Vol).
The overall idea is that after the breakdown from the channel, the analyst expects BTC/USDT to head toward the 80.4k support zone.
Please support boost this analysis

#BTC/USDT is currently strongly bullish#BTC
The price is moving in a descending channel on the 1-hour timeframe. It has reached the lower boundary and is heading towards breaking above it, with a retest of the upper boundary expected.
We have a downtrend on the RSI indicator, which has reached near the lower boundary, and an upward rebound is expected.
There is a key support zone in green at 89300. The price has bounced from this level multiple times and is expected to bounce again.
We have a trend towards consolidation above the 100-period moving average, as we are moving close to it, which supports the upward movement.
Entry price: 90200
First target: 90600
Second target: 91256
Third target: 92000
Don't forget a simple principle: money management.
Place your stop-loss below the support zone in green.
For any questions, please leave a comment.
Thank you.

BTC Trade Plan (December 12, 2025)BTC Trade Plan (December 12, 2025)
(D1 Neutral / H4 Buy dips / H1 Locally bullish / M15 Trend)
⬛️ 1. Higher Timeframe Context (D1 and H4)
• D1 bias: neutral
• D1 range (approx): 89,000 – 94,000
• Key D1 zones:
• Supply: 93,000-94,000 tested highs
• Demand: 89,000-91,000 supports
• H4 bias: buy dips
• H4 zones of interest:
• H4 Sell Zone 1: – supply cluster/rejection
• H4 Buy Zone 1: – demand area/gap fill potential
Active setups are trend-aligned relative to D1/H4.
⬛️ 2. Preferred Setups by Horizon
🔳 2.1 Swing Setup (D1/H4)
• Idea: trend-aligned long on dips (neutral structure support).
• Time horizon: multi-day.
• Context: stable macro, neutral derivatives.
🔲 2.2 Intraday Setup (H1 focus)
• Idea: buy dips toward supports.
• Time horizon: intraday.
• Context: H4 demand zones, local bullish.
▫️ 2.3 Scalp Setup (M15 focus)
• Idea: scalp minor trends upside.
• Time horizon: minutes–hours.
• Risk: higher-risk in expansion regime.
▪️ 2.4 Arbitrage/Pairs Concept (if relevant)
• Idea: BTC dominance high, neutral vs ETH/sector.
🟩 3.1 Long Setup (Trend-Aligned)
• Execution timeframe: H1
• Trigger timeframe: M15
• Entry zone:
• Context: H4 demand, LVN support.
• Pattern tags:
Trigger conditions:
• Liquidity sweep or SFP at/under key low, then reclaim (liquidity_sweep_reclaim).
• Evidence of liquidation_spike_reversal and absorption_at_level.
• ML-Predictive (15m): upside probability ≥ downside.
• On-chain and regulatory risk not at “extreme”.
🟥 3.2 Short Setup (Counter-Trend)
• Execution timeframe: H1
• Trigger timeframe: M15
• Entry zone:
• Context: H4 supply + put-biased skew.
• Pattern tags (from pattern_library):
Trigger conditions (non-exhaustive example):
• Price trades into the H4 sell zone and forms required pattern combination (e.g., double_sweep_high + vwap_rejection).
• Orderflow: evidence of absorption_at_level and delta_divergence_high.
• ML-Predictive (15m): downside probability ≥ upside.
• Event/Regulatory risk is not “extreme” and uncertainty is not “high”.
🔴 4. Stops (Invalidation Levels)
Long setups:
• Stop: 88,000.
• Logic: break of H4/H1 key low/demand invalidation; idea is wrong below this level.
Short setups:
• Stop: 95,000.
• Logic: break of H4/H1 structural high or OB invalidation; idea is wrong above this level.
🟢 5. Targets
Long:
• TP1: 93,000 – local HVN/VWAP or M15/H1 level.
• TP2: 94,000 – H4 supply/OB retest.
• TP3 (optional): 95,000 – extended D1 objective (HVN).
Short:
• TP1: 91,000 – intraday HVN or VWAP retest (H1).
• TP2: 89,000 – H4 demand / LVN void.
• TP3 (optional): lower – extended D1 objective (gap fill).
⬛️ 6. Position Sizing
• Baseline risk:
• Trend-aligned setups: typically 1.0 (relative unit).
• Counter-trend setups: ≤ 0.5 (relative unit).
• Adjust up/down using:
• high volatility_context, normal onchain_risk_profile.risk_level, normal sentiment_state.sentiment_risk, normal anomaly_state.manipulation_risk, overall_event_risk normal, uncertainty.level medium, trade_readiness.status ok_to_trade.
Final recommended relative risk per setup: 0.8 for trend long, 0.4 for counter-trend short.
⬛️ 7. Risk Flags
• Thin liquidity and high slippage risk
• Macro headwinds (DXY flat, NQ flat)
• Elevated regulatory risk (bank competition news)
⬛️ 8. Flip Conditions
• For long bias → bearish flip:
• Close below 89,000 with sell delta, failed demand.
• For short bias → bullish flip:
• H4 close above 94,000 with rising OI, positive delta, and acceptance above the OB cluster.
⬛️ 9. Alternative Scenario
Reject highs with range_high_rejection, short direction entry 93,000-94,000, stop 95,000, targets 89,000-88,000, differs as bear continuation vs base range grind.
⬛️ 10. Model Self-Critique
• Main assumptions: stable macro, neutral derivatives/on-chain.
• Main vulnerabilities: regulatory shifts, large whale flows.
• Behavioural risk notes: do not average into losers, do not increase leverage beyond a safe threshold.
⬛️ 11. Uncertainty and Constraints
• Uncertainty level: medium.
• Avoid high leverage, require strict pattern confirmation before entry, limit the number of trades.

btc live tradeHello friends
Given the sharp upward movement we had, you can see that the sellers have made a high, which increases the possibility of a price correction, and we can witness a price increase in the price correction until the specified targets are reached.
This analysis is purely from a technical perspective and is not a buy or sell recommendation, so please observe risk and capital management.
*Trade safely with us*

BTC Trade Plan (December 10, 2025)BTC Trade Plan (December 10, 2025)
(D1 Neutral / H4 Buy dips / H1 Locally bullish / M15 Trend)
⬛️ 1. Higher Timeframe Context (D1 and H4)
• D1 bias: neutral
• D1 range (approx): 90,000 – 94,000
• Key D1 zones:
• Supply: approx 94,000 rejection
• Demand: approx 90,000 support
• H4 bias: buy dips
• H4 zones of interest:
• H4 Sell Zone 1: – supply cluster
• H4 Buy Zone 1: – demand area
Active setups are trend-aligned relative to D1/H4.
⬛️ 2. Preferred Setups by Horizon
🔳 2.1 Swing Setup (D1/H4)
• Idea: trend-aligned long on dips.
• Time horizon: multi-day.
• Context: neutral structure with macro stability.
🔲 2.2 Intraday Setup (H1 focus)
• Idea: buy dips in range.
• Time horizon: intraday.
• Context: H4 demand zones.
▫️ 2.3 Scalp Setup (M15 focus)
• Idea: scalp upside moves.
• Time horizon: minutes–hours.
• Risk: higher-risk in event regime.
▪️ 2.4 Arbitrage/Pairs Concept (if relevant)
• Idea: none.
🟩 3.1 Long Setup (Trend-Aligned Example)
• Execution timeframe: H1
• Trigger timeframe: M15
• Entry zone:
• Context: H4 demand, possibly with absorption.
• Pattern tags:
Trigger conditions:
• Liquidity sweep or SFP at/under key low, then reclaim (liquidity_sweep_reclaim).
• Evidence of liquidation_spike_reversal and absorption_at_level.
• ML-Predictive (15m): upside probability ≥ downside.
• On-chain and regulatory risk not at “extreme”.
🟥 3.2 Short Setup (Counter-Trend Example)
• Execution timeframe: H1
• Trigger timeframe: M15
• Entry zone:
• Context: H4 supply + neutral bias.
• Pattern tags (from pattern_library):
Trigger conditions (non-exhaustive example):
• Price trades into the H4 sell zone and forms required pattern combination (e.g., double_sweep_high + vwap_rejection).
• Orderflow: evidence of absorption_at_level and delta_divergence_high.
• ML-Predictive (15m): downside probability ≥ upside.
• Event/Regulatory risk is not “extreme” and uncertainty is not “high”.
🔴 4. Stops (Invalidation Levels)
Long setups:
• Stop: approx 90,000.
• Logic: break of H4/H1 key low/demand invalidation; idea is wrong below this level.
Short setups:
• Stop: approx 95,000.
• Logic: break of H4/H1 structural high or OB invalidation; idea is wrong above this level.
🟢 5. Targets
Long:
• TP1: approx 93,000 – local HVN/VWAP or M15/H1 level.
• TP2: approx 94,000 – H4 supply/OB retest.
• TP3 (optional): higher – extended D1 objective.
Short:
• TP1: approx 92,000 – intraday HVN or VWAP retest (H1).
• TP2: approx 91,000 – H4 demand / LVN void.
• TP3 (optional): lower – extended D1 objective.
⬛️ 6. Position Sizing
• Baseline risk:
• Trend-aligned setups: typically 1.0 (relative unit).
• Counter-trend setups: ≤ 0.5 (relative unit).
• Adjust up/down using:
• high volatility, normal onchain risk, normal sentiment risk, normal manipulation risk, normal event risk, medium uncertainty.
Final recommended: 0.8 for trend long, 0.4 for counter-trend short.
⬛️ 7. Risk Flags
• Event risk high (Fed decision)
• Thin liquidity and high slippage risk
• Macro headwinds possible (DXY flat, NQ flat)
• Elevated regulatory risk (bank competition news)
⬛️ 8. Flip Conditions
• For long bias → bearish flip:
• Close below 91,000 with sell delta.
• For short bias → bullish flip:
• H4 close above 94,000 with buy delta.
⬛️ 9. Alternative Scenario
Failed range break down, trigger range_high_rejection, short direction entry approx 93,000-94,000, stop 95,000, targets 91,000-90,000, differs as bear continuation vs base range.
⬛️ 10. Model Self-Critique
• Main assumptions: stable macro, neutral derivatives, neutral on-chain.
• Main vulnerabilities: Fed surprise, large seller.
• Behavioural risk notes: do not average into losers.
⬛️ 11. Uncertainty and Constraints
• Uncertainty level: medium.
• Avoid high leverage, require strict pattern confirmation, limit trades.

Ascending triangle formation indicates a bullish outlook for BTC#BTCUSD BITSTAMP:BTCUSD BINANCE:BTCUSDT
From the 4H chart, BTC's short-term trend has formed an ascending triangle pattern, which is a typical bullish pattern. Short-term resistance is located at 93500-94500, a break above this level would likely lead to further gains. The key support level to watch is 88000-87500. If the price retraces to this range, we can consider going long on BTC.
BTCUSDT Trade Plan (December 08, 2025)BTC Trade Plan (December 08, 2025)
(D1 Bearish / H4 Sell Rallies → Compression / H1 Neutral / M15 Chop)
⬛️ 1. Higher Timeframe Context (D1 and H4)
• D1 bias: bearish (descending channel post-ATH)
• D1 range (approx): 84,000 – 126,000 (current lower third)
• Key D1 zones:
• Supply: 100–105k (broken)
• Demand: 88–90k channel low
• H4 bias: sell rallies turning compression (ascending triangle forming)
• H4 zones of interest:
• H4 Sell Zone 1: – recent rejection + supply cluster
• H4 Buy Zone 1: – weekend low + trendline
Active setups counter-trend long on dip (whale accumulation support), trend-aligned short only on clear rejection.
⬛️ 2. Preferred Setups by Horizon
🔳 2.1 Swing Setup (D1/H4)
Counter-trend long the channel low / whale accumulation zone. Time horizon: multi-day to weeks.
🔲 2.2 Intraday Setup (H1 focus)
Buy dips to 89.5-90k or breakout above 92k. Time horizon: intraday to overnight.
▫️ 2.3 Scalp Setup (M15 focus)
Scalp range 90-92k or absorption plays — higher risk in chop.
▪️ 2.4 Arbitrage/Pairs: BTC dominance rising → BTC outperforming alts short-term.
🟩 3.1 Long Setup (Trend-Aligned with On-Chain / Swing-Intraday)
• Execution timeframe: H4/H1
• Trigger timeframe: M15
• Entry zone:
• Pattern tags: Trigger conditions:
• Successful defense 88-90k zone + CVD higher low
• H1/H4 BOS up on volume
• Whale accumulation continuation
🟥 3.2 Short Setup (Counter-Trend / Scalp Only)
• Execution timeframe: H1
• Trigger timeframe: M15
• Entry zone:
• Pattern tags: Trigger conditions:
• Clear rejection with delta divergence high
• Failure to break 94k pre-FOMC
🔴 4. Stops (Invalidation Levels)
Long setups: 87,500 (channel break = bear confirmation)
Short setups: 94,500 (breakout = squeeze)
🟢 5. Targets
Long (swing/intraday):
• TP1: 92,000 (VWAP/H1)
• TP2: 94,000-95,000 (supply test/H4)
• TP3: 100,000+ (HVN/D1 optional)
Short (scalp):
• TP1: 90,000
• TP2: 88,500
⬛️ 6. Position Sizing
• Baseline trend-aligned long (on-chain supported): 1.0%
• Counter-trend short: 0.4%
• Adjustments: +20% (whale buying + clean lev + Fed tailwind) → Effective: longs 1.2% risk, shorts 0.3% max
⬛️ 7. Risk Flags
• FOMC Wednesday → vol expansion risk
• Thin liquidity mid-week
• Residual weekend trauma → fake moves possible
• Macro correlation re-assertion if equities dump
⬛️ 8. Flip Conditions
Bull → bear flip: clean close below 88k with volume + funding negative
Bear → bull flip: H4 close >94.5k + CVD reset + whale continuation
⬛️ 9. Alternative Scenario
Reject hard at 92-94k → descending triangle breakdown → fast move to 84-87k LVN void (bear trap completion, high risk short only with tight stop).
⬛️ 10. Model Self-Critique
• Assumptions: whale accumulation continues, Fed delivers dovish cut, no macro shock
• Vulnerabilities: sudden risk-off equities dump, whale distribution resumption, FOMC hawkish surprise
• Behavioural: do not chase breakouts pre-FOMC, do not average into losing shorts against whales
⬛️ 11. Uncertainty and Constraints
Uncertainty: medium → require flow + pattern confirmation, no high lev, prefer size on confirmed absorption only.

“BTCUSD 1H — Range Support Buy Targeting Range High Liquidity1. Market Structure (1H BTCUSD)
Overall structure: Still range-bound / corrective, not a clean trend.
Price is trading inside a rising channel but momentum has weakened.
We recently rejected from the upper mid-range, not from the absolute highs — that matters.
Interpretation:
This is consolidation after a strong move, not distribution yet — but buyers are no longer aggressive.
---
2. Key Zones (Very Important)
🔴 Demand / Support Zone (Red Box)
Roughly 85,000 – 86,800
Multiple reactions here → high-quality demand
Liquidity + prior structure low + channel support
If price enters this zone and holds:
→ High-probability bounce / long setup
If this zone breaks cleanly (1H close below):
→ Structure fails → expect accelerated sell-off
---
⚫ Resistanc…
“BTCUSD 1H — Range Support Buy Targeting Range High Liquidity”

#BTC/USDT is currently strongly bullish#BTC
The price is moving in a descending channel on the 1-hour timeframe. It has reached the lower boundary and is heading towards a breakout, with a retest of the upper boundary expected.
We are seeing a bearish trend in the Relative Strength Index (RSI), which has reached near the lower boundary, and an upward bounce is expected.
There is a key support zone in green at 88200, and the price has bounced from this level several times. Another bounce is expected.
We are seeing a trend towards stabilizing above the 100-period moving average, which we are approaching, supporting the upward trend.
Entry Price: 88900
First Target: 90000
Second Target: 91123
Third Target: 92300
Remember a simple principle: Money Management.
Place your stop-loss order below the green support zone.
For any questions, please leave a comment.
Thank you.

BTC 4H CHART ROUTE MAPDear Traders,
BTC has shown strong gains this week and has confirmed a short-term bullish trend across multiple confluences.
Wait for the price to pull back to the entry zone around IFVG & BPR area close to $89K–$91K before looking for TP1, TP2, and TP3, with your stop-loss set at $83,500.
Always trade with proper risk and money management.
The Quantum Trading Mastery

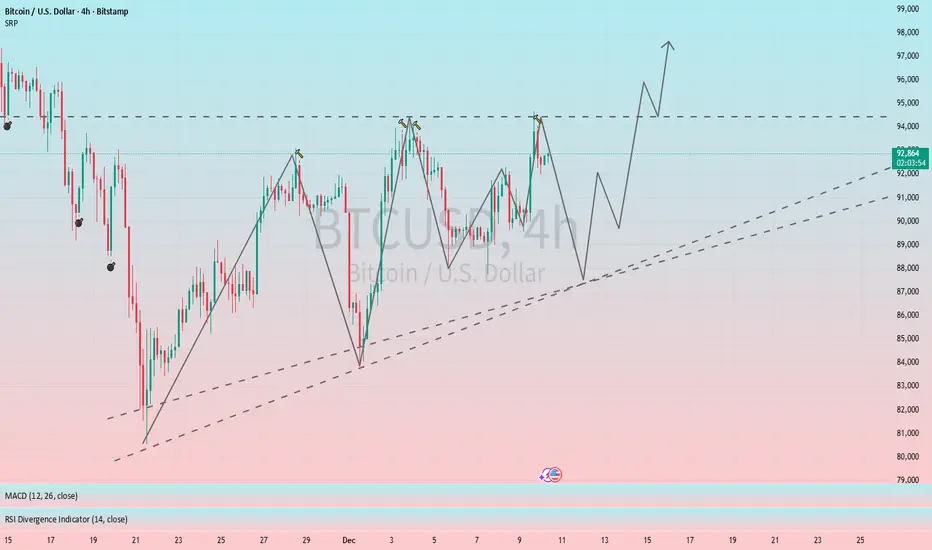
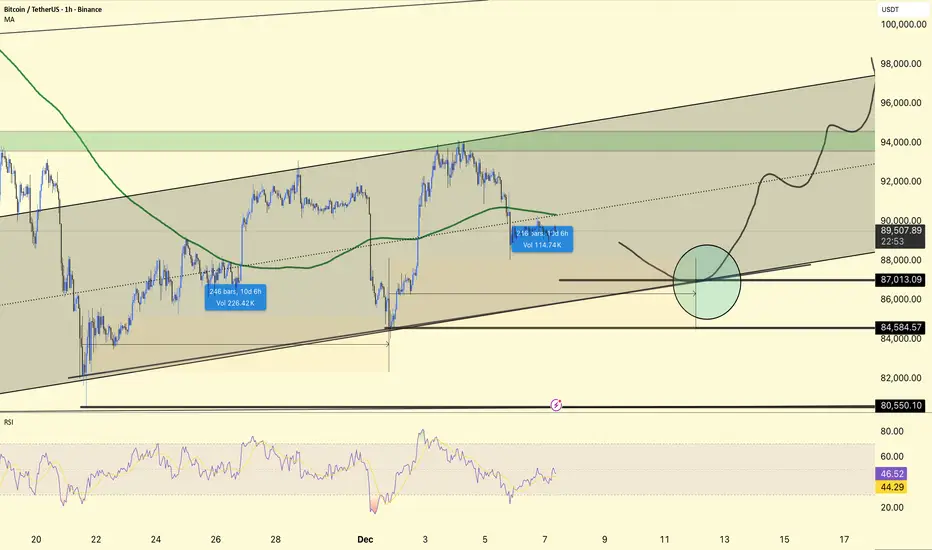
#BTC 4HOUR CHART UOPDATE !!BTCUSDT is still trading within an ascending channel, now pulling back towards the mid-lower portion of the structure after failing to sustain above 90k on the latest push.
The price has rolled over from the upper half of the channel and is heading towards the main confluence zone around 87,000–88,000, where the lower channel line, previous horizontal support, and your marked circle align.
84,584 and 80,550 remain the next downside reference supports; holding above 87k maintains the short-term bullish channel, while a break below 84,584 would increase the risk of a deeper correction towards 80k.
A decline into the 87k area, followed by basing and a continuation back towards 92k–94k, and if buyers defend the channel as drawn, possibly to the 96k–98k channel top.
The RSI is mid-range rather than overbought, so there is room for another leg down or a sharp bounce to test support; using 87k–84.5k as the main invalidation band for aggressive longs fits within the current 4H structure.
DYOR | NFA,
#BTC/USDT is currently strongly bullish#BTC
The price is moving in a descending channel on the 1-hour timeframe. It has reached the lower boundary and is heading towards breaking above it, with a retest of the upper boundary expected.
We have a downtrend on the RSI indicator, which has reached near the lower boundary, and an upward rebound is expected.
There is a key support zone in green at 92500. The price has bounced from this level multiple times and is expected to bounce again.
We have a trend towards consolidation above the 100-period moving average, as we are moving close to it, which supports the upward movement.
Entry price: 92990
First target: 93204
Second target: 93750
Third target: 94406
Don't forget a simple principle: money management.
Place your stop-loss below the support zone in green.
For any questions, please leave a comment.
Thank you.

BTC Follow-Up: Bullish Structure Playing Out Exactly as ExpectedThe reaction we highlighted earlier has now followed through beautifully. BTC held the higher low, respected the demand zone, and has pushed upward with clear momentum. This is exactly the kind of constructive price action that confirms the initial bullish read.
Sellers attempted continuation, but the market absorbed the pressure and reversed decisively. That higher low was the structural shift we needed to see, and BTC is now building out a cleaner series of rising lows and controlled retracements. This is how early trend reversals form: not with one explosive candle, but with consistent defense of higher levels and steady reclaiming of lost ground.
Price is now trading back above short term resistance and showing signs of strength on each dip. As long as BTC continues to print higher lows, this developing structure leans bullish and supports the idea that the market has transitioned from liquidation-driven selling into accumulation.
Overall, this is a constructive follow through and reinforces the idea that the recent dump was a reset rather than a breakdown. The chart is behaving well. Bulls have momentum building.

BTCUSDTWe have a big downtrend.
By breakout from support and resistance we will have continued trend to next target.
Breakout 82k ready to 70k.
Breakout 93k ready to 100k and 115k.
CRYPTOCAP:BTC BITSTAMP:BTCUSD BINANCE:BTCUSDT

BTC Trade Set Up Dec 2 2025Price BOS to the downside and is making LL/LH on the daily, 4h and 1h so i am expecting price to sweep BSL/London and Asia high, tap 1h FVG to then engulf and CISD to the downside to target SSL

BTC/USD 2H – Key Support Levels Holding Strong BTC/USD 2H Analysis
Bitcoin is currently trading inside a clean range structure between a strong resistance zone above and two major support zones below. Price is reacting exactly within these boundaries, showing clear market behavior.
---
🔍 Key Technical Observations
📌 Resistance Zone
Price has rejected this level multiple times, confirming strong selling pressure above.
📌 Support 1
This is the first zone where buyers previously stepped in with strong momentum.
📌 Support 2
A deeper support level where liquidity sits and where strong bullish reactions occurred in the past.
---
📈 Expected BTC Move
Based on structure:
✔ If BTC holds above Support 1, we can expect a bounce toward resistance.
✔ If price breaks Support 1, a move toward Support 2 is likely before any bullish reaction.
✔ Range trading environment — wait for clean reaction signals.
The green arrows on the chart illustrate the potential bounce zones.
---
🙏 Support the Work
Your boosts, likes, and comments motivate me to continue providing clean and accurate chart breakdowns.
👉 Boost the idea & share your thoughts below!
— JT_CHARTsMaster
