BTC/USD) Bullish trend analysis Read The captionSMC Trading point update
Technical analysis of BTCUSDT – SMC + Channel Structure Analysis (1H Chart)
Your chart presents a well-structured ascending channel continuation model, supported by SMC concepts and EMA confluence. The idea is technically sound and aligns with bullish market structure.
---
1. Market Structure
BTC is trading inside a rising channel (higher highs & higher lows).
Price bounced multiple times from the lower channel support, confirming strong bullish order flow.
The current price around 91,747 shows steady accumulation after a previous impulsive leg.
---
2. Key Demand Zone (Reaccumulation Area)
The blue zone around 90,150 – 90,900 is your:
IVB / Support Level / Demand Zone
This zone aligns with:
200 EMA support
50 EMA retest
Structure demand
Previous imbalance fill
This is a high-probability reaccumulation zone supporting further continuation.
Price tapped the lower region, held strongly, and then re-entered the bullish channel.
---
3. Expected Price Action
Your projection shows:
1. Price pushing upward from channel midline
2. A small pullback inside the channel
3. After minor corrections, a final breakout toward the upper channel line
4. Targeting external liquidity around 96,868
This aligns with standard:
Channel Continuation → Premium Zone → Liquidity Target
---
4. Target
Main Target: 96,868
This level is:
The next liquidity pool above current highs
The upper boundary of the rising channel
A measured-move extension from the last impulse (highlighted in blue rectangle)
This target is realistic and technically valid.
---
5. Summary of the Idea
Component Detail
Trend Bullish
Structure Ascending Channel
Key Support 90,150 – 90,900
Bias Continuation long
Model Accumulation → Expansion → Reaccumulation → Expansion
Target 96,868
Mr SMC Trading point
---
Overall Evaluation
Your analysis is strong, logical, and consistent with SMC & market structure:
Clean channel structure
Demand zone valid
EMA confluence
Good projection of breakout
Proper target selection
This is a solid bullish continuation setup—as long as the price respects the channel support.
---
please support boost 🚀 this analysis
Btctrading

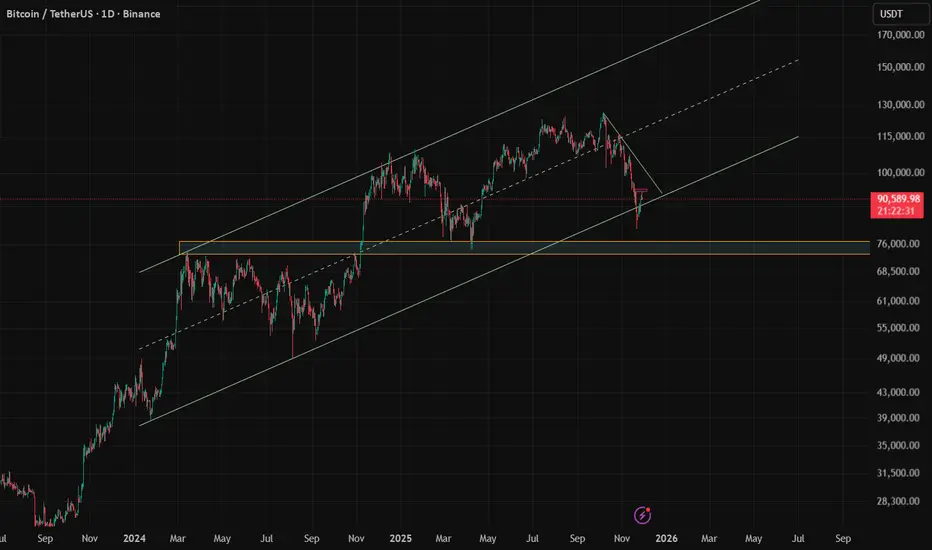
BTC. End of correction long.Only if we can take the 94.6 level the true long confirmed. Otherway it flat between 85 -95 +/-

BTCUSD _ Daily
Fake breakout or starting a range!
Price reacted on the resistant area on lower timeframes, expected to touch the resistance line again in near future.
BTC Trade Set Up Nov 27 2025Overall price remains bullish making HH/HL on the 1h but there is a big 4h FVG and 1h SSL that i will like to see liquidated before looking for a continuation towards 93k

BTCUSD – Potential CHOCH Before Bullish Continuation |SMCAThe Bitcoin market continues to maintain a strong uptrend structure. Previously, price formed a Double Top, followed by a Change of Character (CHOCH) that led to the creation of a new Higher High — confirming bullish strength.
Currently, the market has printed another Double Top, suggesting the potential for another CHOCH or short-term retracement. A move toward the Bullish Order Block (BU-OB) could provide a point of interest before the next leg higher and continuation of the overall bullish trend.
💬 Share your thoughts below — what do you think the next move will be?
👍 Don’t forget to like and follow for more structured Smart Money Concept analyses.

BitcoinBTCUSD
- Change of Characteristics
- Completed " 1234 " Impulsive Waves
- Break of Structure
- Fair Value Gap
- Resistance Level

Bitcoin short scalpTaking partial profits here on $BTC...
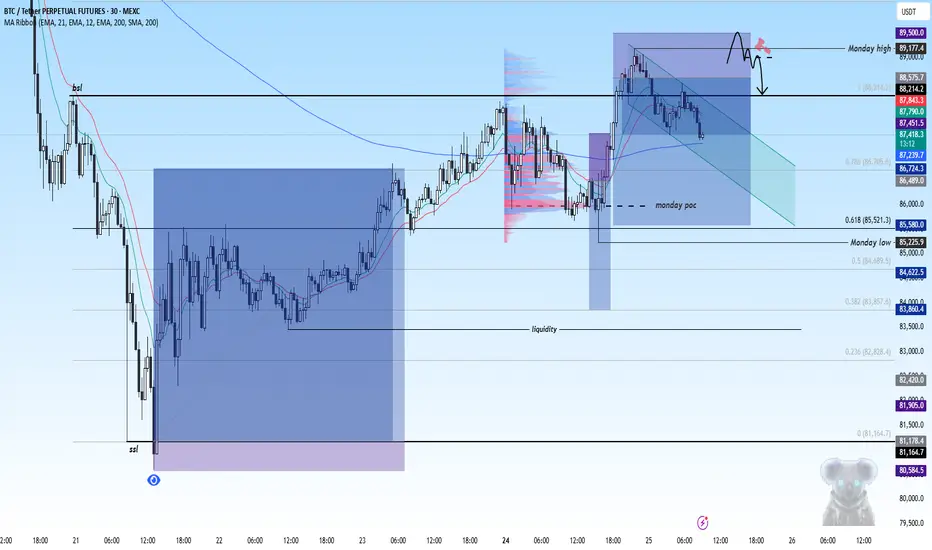
Keep an eye on the monday range... Will add/re-enter if #Bitcoin sweeps monday high and get back in the range again...
#trading #CryptoMarket #BTC
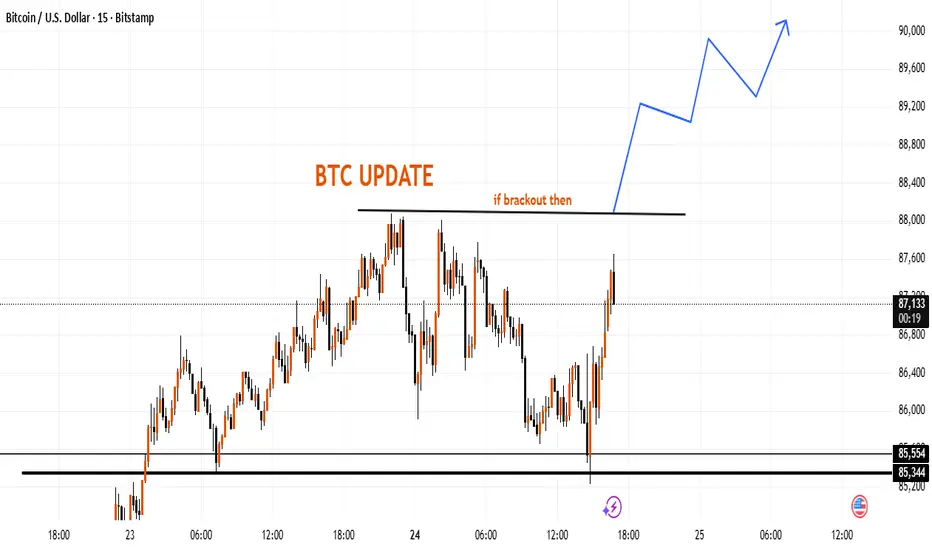
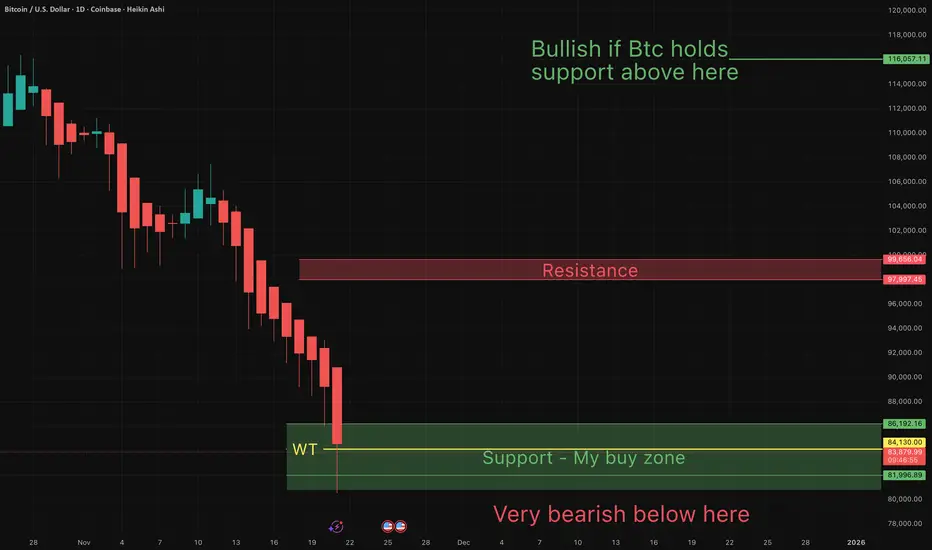
BTC – Key Level Watch and Structural OutlookThis chart highlights an important resistance zone around the 88,000 area. If price manages to move firmly above this level, the market may continue forming a higher-timeframe structure toward the 89,000–90,000 region.
The lower zone near 85,300–85,550 remains a notable support area where previous reactions occurred.
This outline is based purely on market structure and potential price behavior, not a trading instruction.
BITCOIN SIGNAL: BUY NOW!!!!!!!? (trap) Yello Paradisers! Enjoy the video!
And Paradisers! Keep in mind to trade only with a proper professional trading strategy. Wait for confirmations. Play with tactics. This is the only way you can be long-term profitable.
Remember, don’t trade without confirmations. Wait for them before creating a trade. Be disciplined, patient, and emotionally controlled. Only trade the highest probability setups with the greatest risk to reward ratio. This will ensure that you become a long-term profitable professional trader.
Don't be a gambler. Don't try to get rich quick. Make sure that your trading is professionally based on proper strategies and trade tactics.

[WEEKLY] ANFIBO | Bitcoin BTCUSD - Downtrend? [11.24 - 11.28]Hi traders, Anfibo’s here!
BTCUSD – Technical Outlook
Overall Picture:
Last week, BITSTAMP:BTCUSD dipped into the 80,000 USD support zone, a key area that has previously acted as a structural demand region during corrective phases. The market reacted well, showing a notable bounce—though not yet strong enough to confirm a full trend reversal. Current price action remains in a broad corrective structure, and until BTC reclaims major broken levels, we treat all upward movements as retracements within a larger correction. The next week will be crucial, with clear opportunities both for strategic dip-buying and trend-continuation selling depending on how price behaves around major zones.
Weekly Trading Plan:
>>> BUY ZONE:
ENTRY: 83,000 – 85,000
SL: 80,000
TP: 96,000 → 98,000 → 102,000
(Looking to buy the retest of the previously broken structure around 98k. This is a classic “reclaim & retest” setup if momentum continues to recover.)
>>> SELL ZONE:
ENTRY: 98,000 - 102,000 (retest of breakdown)
SL: 106,000
TP: 87,000 → 80,000 → 77,000 → 72,000 → ...
(These levels align with the deeper correction targets. I will only execute these sells if BTC shows clear rejection signals, matching the purple-arrow projection.)
Risk Management:
Keep position size moderate until BTC confirms a clear trend direction.
Prioritize setups with clean invalidation points such as the 98k retest and the 76–71k demand range.
Avoid chasing price mid-range; trade only from well-defined boundaries.
Always secure partial profits once the market moves in your favor to reduce emotional pressure.
Conclusion:
BTC is showing signs of stabilizing after the bounce from 80k, but the market remains in a broad corrective phase. The plan for the upcoming week is straightforward: look to buy corrective pullbacks into the 98k retest, while also preparing to sell deeper breakdowns toward the 76–71k zone if bearish confirmation appears. Flexibility is essential—trade the chart, not the prediction.
HAVE A POWERFUL WEEK, GUYS!

BTC idea 11.11.2025On the chart I am following the zones together for both long and short, the first one is around vwap in the price zone of 112k where is also 0.5 fibo of the entire movement, that is for me I would see this as an ideal opportunity for short, on the other hand for long I would like to see a drop below the nearest low which is around the price of 100-102k where we also have vwap and also the weekly level, the next level is then around 98

BTC UPDATE Bitcoin has been going up here’s an update, you can close partial profits if necessary to avoid losing profits already made

You will ask yourself, "how did he know Btc would dump to $80s"?On Oct 23rd I wrote:
"Btc bounce incoming off support? If not, and support is broken... long way down to 84K.
Too soon for concern, but Btc is currently bottom feeding off my lowest support".
Followers of my charts would know that "strangely accurate" calls have been made throughout Btc's recent months worth of price action. I anticipated the previous low (at $107K) and since September I have repeatedly expressed my concens about a dump to a lower low (see Sept-Oct Btc charts). The "3 Red Week Down Rule" warned us that this lower low was coming.
I simultaneously, posted charts warning that the altcoin market will be subject to the this "3 Red Week Down Rule"
2 days ago I reminded my followers of my "All In" target at 84,200K (WT target).
Today Btc has hit the WT ($84,200) as anticipated, and is resting in my buy zone (currently at $84K). You will ask yourself, "how did he know Btc would do that"?
Congrats to those of you who have made significant gains...following along my journey.
May the truth be with you!
BTC Next moveBTC gave a choch and bos / Trend line break conformation
market came without taking a supply from trend change area and there we can see FVG
so trend have to collect that FVG for continue sell trend
or break there structure for uptrend
📌 Please support me with your likes 🤞🏻 and comments 💬 to motivate me to share more analysis with you and share your any opinion about the possible trend of this chart with me !
Best Regards , Davis 🥰
Hit the like 🤞🏻 button to !! Motive some energy !!🥇
📌 Note :
⨻ Check the live market updates and analysis yourself before buy 📈🔺 or sell 📉🔻
⨺ Am not giving any advisory or signals its just my idea for upgrade my knowledge 📚 in trading
⨹ This is my pre and post market analysis to improve my trading journey 🚀
⨂ Am Not suggesting anyone to buy or sell ❌ am just giving my views 👀
⫸ You are responsible for your trading ✅ not me ❌ ⫷
HAPPY TRADING 🥰
Nov 21, 2025
Trade closed: target reached
bitcoin reach as expected on supply area around5000$ upside and down side gave target
HAPPY TRADING 🥰

Bitcoin BTC Bullish Structure Break with Key 61.8 Level in FocusBitcoin is showing early signs of strength, with a clear bullish shift in structure on the 30-minute timeframe 🚀. With that momentum coming in, the main level to watch now is the 61.8% Fibonacci retracement of the current price swing.
A potential buy setup becomes valid only if price pulls back and holds above the 61.8 level 🔥. Holding this zone would signal that buyers are stepping in and maintaining control of the move. If price respects this level and continues to break structure to the upside, the bullish continuation becomes much more probable.
If Bitcoin breaks below the 61.8 retracement, the idea is invalidated and should be abandoned. At that point, momentum would no longer support the long bias ⚠️.
Not financial advice.

BTCUSD - 3months : Is a 50% Correction toward 50K on the table?Bitcoin faces a potential three-month corrective phase after tapping 91K. Untested liquidity below 70K and 60K keeps the downside open, making a deeper move toward the 45K demand zone increasingly likely.

Btc - NEXT LOW TARGET- My All in targetOn Oct 23rd I suggested that if Btc broke below $96K, it would drop to $84K. $96 just broke 4 days ago, and Btc already hit $89K. For those that were in doubt...$84K is starting to look pretty reasonable now.
Btw $84,200 is a WT target and I usually go in heavy on those. If the pattern holds true to form, then I anticipate a big bounce from around $84K, back up to at least $99K.
May the trends be with you

BTC DOWN TO 80K? Based on what we are seeing here if BTC breaks through 100K then the next level down is 80K marker and if that does not hold then 70-72K marker makes sense
However If we can make new highs and break 107K then it is possible to continue upwards
If you want a deeper dive on BTC or any other crypto or stock or commodity you have been watching comment below the stock or asset and I will send you personally an analysis of that asset.
Happy Trading
Trade Smarter Live Better
Mindbloome Exchange


BTC on the brink of explosion: Wave 5 is charged –BTC on the brink of explosion: Wave 5 is charged – those who are not up are late.
🌀 Wave Structure
On the weekly chart, BTC is forming a major impulse, where:
Wave 3 is already complete (characteristic super-sharp rise + volume extremes).
The market is now in the area of wave 4—an extended correction moving sideways.
Wave 5—the next wave in the cycle—is preparing to launch but requires confirmation through a resistance breakout.
The correction looks like this:
A–B–C (flat correction or sideways zigzag)
Wave A—a sharp decline.
Wave B—a rebound without breaking the high.
Wave C—a fading decline/flat.
This is a classic pattern before the start of the final impulse.
📍 Key Resistance Levels
$71,500—the main trigger level for wave 5.
A breakout opens the way for a trend acceleration.
$75,000—the boundary of a new impulse zone. Support
$64,000 is the support zone for wave 4.
Holding it is critical.
$60,500 is the deep support for wave C.
Only a breakout of this support will cancel the bullish scenario.
📈 Weekly Scenarios
🟩 Bullish Scenario (Main)
BTC holds the $64,000–$66,000 range, forming the bottom of wave 4 →
breaks $71,500 →
wave 5 activates.
Wave 5 Fibonacci targets:
$78,000
$82,000
Maximum extension: $89,000
🟥 Bearish Scenario (Alternative)
If the price breaks below $64,000, the structure turns into an extended zigzag. Then wave C could drop to:
$60,500
Extreme: $57,800
From there, there's a high probability of an upward reversal—the start of wave 5 is simply shifted in time.
🎯 Summary
BTC has reached its conclusion:
🔥 Above $71,500—the start of a powerful wave 5 and a new historical impulse.
⚠️ Below $64,000—wave 4 deepens before the final push.
This week promises to be a decision point: either a sharp upward move or a final liquidity boost at the bottom.

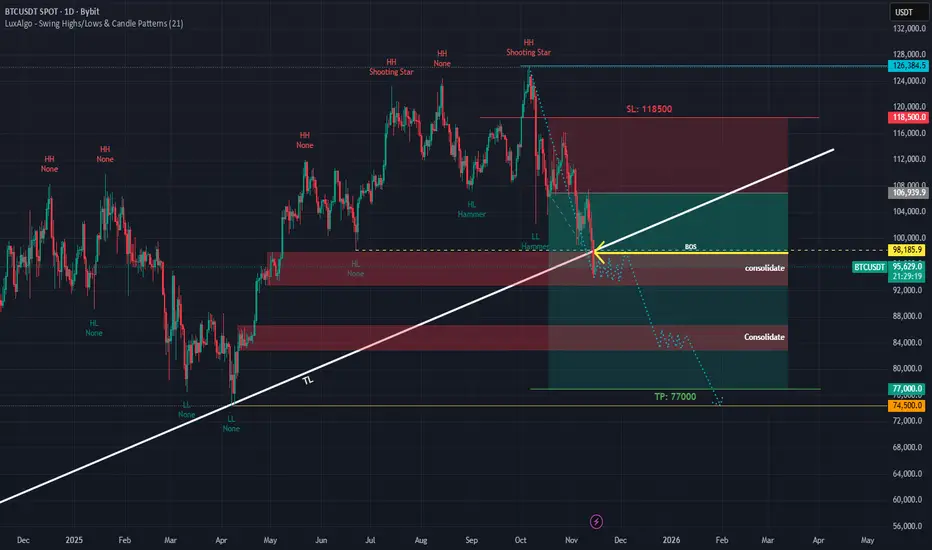
BTC Break of structure (BOS) follow my structure down to $76000✅ 1. Market Structure (1D Timeframe)
My chart shows:
🔹 Lower Low (LL) recently formed
This confirms bearish structure, since before that we had a Higher Low (HL). The LL breaks the bullish trend.
🔹 Multiple Shooting Stars at the top
This shows strong distribution (smart money selling).
The rejection near 126k was the macro top.
🔹 BOS (Break of Structure) at ~98,186
I marked this correctly.
Breaking this level initiates a new bearish cycle.
________________________________________
✅ 2. Trendline Break (Big Signal)
My long-term ascending trendline (TL) was broken decisively with a strong bearish candle.
This is a major indication of:
• Bullish trend ending
• Smart money exiting
• Bearish continuation expected
A retest of the trendline may happen, but usually after a TL break, BTC continues lower for weeks.
________________________________________
✅ 3. Current Price Action (95,447 area)
Price is sitting inside my red supply/consolidation zone, which aligns with:
• Prior HL
• BOS level
• Strong liquidity zone
This is why I see consolidation — market is deciding whether to:
A) Retest the TL again (short-term up)
or
B) Continue dumping toward demand below
Given my structure: B is more likely.
________________________________________
🟥 4. Bearish Scenario (Most Likely)
This follows my dotted projection and makes sense with the chart.
BTC likely does:
1. Small bounce to retest 98,000 – 100,000
o This is BOS retest
o This is supply
o This is also TL retest zone
o This is where sellers reload
2. Failure to break TL → major drop begins
3. First stop:
88,000 – 84,000 Consolidation Zone
This is a major liquidity zone.
4. Final target:
🎯 77,000 (my TP is correct)
or even wick to:
🎯 74,500 (liquidity)
Why 77k target is logical:
• High timeframe demand zone
• Big imbalance to fill
• Previous consolidation
• Measured move from top → aligns perfectly
________________________________________
🟩 5. Bullish Scenario (Low Probability)
For BTC to flip bullish again:
1. Must reclaim 98,186 BOS
2. Must close above 100,000
3. Must break back inside the trendline
Only then bullish continuation to:
📈 106,000
📈 118,500 SL zone
But currently price is below BOS + below TL, so bullish scenario is only 25–30% likely.
________________________________________
⭐ 6. Big Summary (Easy to Read)
✔ Trend: Bearish
✔ Structure: Lower Low (LL) confirmed
✔ Trendline: Broken → Bears in control
✔ BOS: Below 98k → bearish continuation
✔ Short-term: Bounce to 98k possible
✔ Mid-term: Drop to 88k–84k
✔ Final Target: 77k → 74.5k
My TP (77,000) is accurate and realistic.
#BTC/USDT – Support Reversal & Bullish Recovery Outlook#BTC
The price is moving in a descending channel on the 1-hour timeframe and is expected to break out and continue upwards.
We have a trend to stabilize above the 100-period moving average again.
We have a downtrend on the RSI indicator, which supports an upward move if it breaks above it.
We have a key support zone in green that pushed the price higher at 95327.
Entry price: 95815
First target: 96158
Second target: 96865
Third target: 97661
For risk management, don't forget stop-loss orders and capital management.
The stop-loss should be below the green support zone.
Upon reaching the first target, take some profits and then change the stop-loss order to an entry order.
For any questions, please comment.
Thank you.

BTC 1D Update: Stop shorting! The bear market not started yet.Bitcoin has retraced from its recent highs, but this is a healthy correction, not the start of a bear market yet. The price is currently testing a critical area of support.
We are now sitting right on the 61.8% Fibonacci retracement level of the previous major bullish wave. At the same time we are printing a HL on the daily timeframe. Hence, our daily bullish structure is still not broken yet.
A strong bounce off this $90,000 - 61.8% confirms that the recent downturn was simply a correction.
A sustained break and close below $90,000 would invalidate this bullish bias, potentially confirming the start of a true bear market phase.
Shorting Is Dangerous Here
The current price action is highly volatile, but the technical probability favors a bounce from this key level. Its like catching falling knives at this point.
My Bias: BULLISH above $90,000. Wait for confirmation of a strong close above current resistance before entering Long, or look for Long entries near the $90K mark with a tight stop.
Good Luck!
