#BTC/USDT – Support Reversal & Bullish Recovery Outlook#BTC
The price is moving in a descending channel on the 1-hour timeframe and is expected to break out and continue upwards.
We have a trend to stabilize above the 100-period moving average again.
We have a downtrend on the RSI indicator, which supports an upward move if it breaks above it.
We have a key support zone in green that pushed the price higher at 95327.
Entry price: 95815
First target: 96158
Second target: 96865
Third target: 97661
For risk management, don't forget stop-loss orders and capital management.
The stop-loss should be below the green support zone.
Upon reaching the first target, take some profits and then change the stop-loss order to an entry order.
For any questions, please comment.
Thank you.
Btctrading

BTC 1D Update: Stop shorting! The bear market not started yet.Bitcoin has retraced from its recent highs, but this is a healthy correction, not the start of a bear market yet. The price is currently testing a critical area of support.
We are now sitting right on the 61.8% Fibonacci retracement level of the previous major bullish wave. At the same time we are printing a HL on the daily timeframe. Hence, our daily bullish structure is still not broken yet.
A strong bounce off this $90,000 - 61.8% confirms that the recent downturn was simply a correction.
A sustained break and close below $90,000 would invalidate this bullish bias, potentially confirming the start of a true bear market phase.
Shorting Is Dangerous Here
The current price action is highly volatile, but the technical probability favors a bounce from this key level. Its like catching falling knives at this point.
My Bias: BULLISH above $90,000. Wait for confirmation of a strong close above current resistance before entering Long, or look for Long entries near the $90K mark with a tight stop.
Good Luck!

Start Accumulating BTC!Bitcoin has reached a major demand zone between $91,000–$97,000, an area that has consistently acted as a strong support throughout 2024–2025.
Price has now tapped the bottom of this accumulation zone, where buyers previously stepped in aggressively.
Key Points:
BTC is sitting inside a high-probability bounce zone.
Historically, this region has triggered strong upward reversals.
Market structure is still intact as long as price holds above $91,000.
Perfect area for long-term positioning.
Start accumulating BTC within this support zone.
This is one of the cleaner levels to build exposure before the next macro move.

BTC Analysis | CME GapHello friends
Bitcoin’s critical gap between $91,500 and $92,500 could serve as a short-term correction target if selling pressure continues.
A gap that closes could set the stage for a bottom and a continuation of the uptrend.
The price’s reaction to this area will determine the market’s next direction.
Don't forget risk and capital management.
*Trade safely with us*

ANFIBO | Bitcoin BTCUSD - Bet a Buy order [11.14.2025]Hi traders, Anfibo’s here!
BTCUSD – Technical Outlook
Technical Structure:
BTC is now trading extremely close to a major structural support zone, aligning with the 61.8% Fibonacci retracement around the $94,000 region. This confluence makes the area a high-value reaction point—historically, 61.8% fib zones often act as strong bases for corrective rebounds during healthy bull-cycle pullbacks. Momentum is slowing down as price compresses into this support cluster, signaling that the market is preparing for a potential relief bounce… unless the level fails.
Trading Strategy:
Our approach today focuses on respecting this key confluence zone.
If BTC stabilizes above 94k, a short-term rebound toward 110,000 USD is a realistic target.
However, if price breaks below 91,000 USD, structure becomes decisively bearish, exposing deeper supports and invalidating the rebound setup.
This is a “react at the level, not before the level” type of day.
Daily Trading Plan:
>>> BUY ZONE:
ENTRY: 93,500 – 95,000
SL: 90,500
TP: 110,000
(Looking for a clean rebound from the 61.8% confluence, ideally with volume pickup or bullish rejection candles.)
>>> SELL ZONE: (only if 91k breaks cleanly)
ENTRY: 90,000 – 91,000 (retest of breakdown)
SL: 94,000
TP: 87,000 → 80,000 → 77,000 → 72,000 → 63,000
(A structural breakdown would shift momentum from corrective to impulsive downside.)
Risk Management:
Keep size moderate; counter-trend buys at major supports require disciplined SL usage.
If entering long, move stop to breakeven once price clears 98k–100k to reduce downside exposure.
Never average down near broken supports; wait for structure to confirm strength before adding.
If the 91k level breaks, switch to defensive mode — reassess bias and avoid catching falling knives without confirmation.
Conclusion:
BTC is sitting on one of its most important confluence supports at 94k. A rebound from here can push price toward 110k, but a clean breakdown below 91k will shift the broader narrative toward a deeper corrective leg with multiple supports waiting below (87k → 80k → 77k → 72k → 63k). Today is a critical inflection point—let the level decide the direction and react accordingly with disciplined execution.
GOODLUCK GUYS!!!

ANFIBO | Bitcoin BTCUSD - UP or DOWN? [11.13.2025]Hi traders, Anfibo’s here!
BTCUSD – Technical Outlook
Technical Structure:
On the higher intraday frame, BTC is running an H1 uptrend — higher highs / higher lows are still intact and the structure favors the bulls. However, on the lower intraday frame (M15) price is trapped inside a short-term descending trend, creating compression between the bullish H1 bias and the bearish M15 micro-structure. That interaction is producing chop around the ~102,000 area and increases the value of waiting for a clean directional resolve (breakout + retest) before committing.
Daily Trading Strategy:
Our approach today is simple and veteran-focused: wait for the breakout of the conflicted edge and trade in the direction of the break after a proper test.
If price breaks up out of the M15 downtrend: wait for the pullback / downtest, then buy near the test level (~102,000).
If price breaks down through H1 support / the current compression: wait for the retest of that broken edge, then sell near ~102,000.
This “break → retest → trade” workflow avoids getting caught in false moves and puts probability in our favor.
Daily Trading Plan:
>>> SELL ZONE:
ENTRY: 101,500 – 102,500 (on confirmed breakdown + failed retest)
SL: 104,500 (above the immediate M15 channel / invalidation level)
TP: 96,000 (TP1) — 92,000 (TP2)
>>> BUY ZONE:
ENTRY: around 102,000 (on confirmed breakout + clean downtest)
SL: 99,500 (below the downtest low / invalidation level)
TP1: 108,000
TP2: 112,000
(Notes on entries: the same ~102k area becomes the decision point — trade only after structure confirms: for buys, look for bullish confirmation on the retest (rejection wick, bullish engulf, rising volume); for sells, look for bearish rejection on retest or inability to reclaim the edge.)
Risk Management:
Keep position sizes small-to-medium while the pair remains in a compressed range; risk 1–2% of equity per full setup.
Use stop losses as listed and never widen SL to “hope” — adjust size instead if you need a wider stop.
Prefer scaling: take a starter size at first confirmation and add only after the trade behaves in your favor (e.g., after TP1 or strong momentum continuation).
Avoid trading into major macro prints or news; if a scheduled event is imminent, reduce size or stand aside until clarity returns.
Conclusion:
Today’s market is a classic “higher-frame bias vs. lower-frame conflict” scenario. The H1 uptrend gives the structural edge to buyers, while the M15 downtrend supplies immediate supply and failure points. The correct, experienced play is to wait — only engage after a clear breakout of the micro-trend and a confirming retest around the decision area (~102k). Whether the trade becomes a buy or a sell, follow the break → retest → confirm discipline, manage risk tightly, and let price prove the direction before enlarging exposure.
GOODLUCK GUYS!!!

BitcoinBTCUSD
- Exp Fiat as an corrective pattern in Long Time Frame
- Break of Structure
- Demand Zone
- Buy Side Liquidity
- Order Block

BTCUSDT.P : positionHello friends
Given the decline we had, the price has now made a good floor and is supported, but it is still early for confirmation. We must let the resistance break and form a higher ceiling for us.
Everything is clear and transparent. If you have any questions, ask.
Don't forget risk and capital management.
*Trade safely with us*

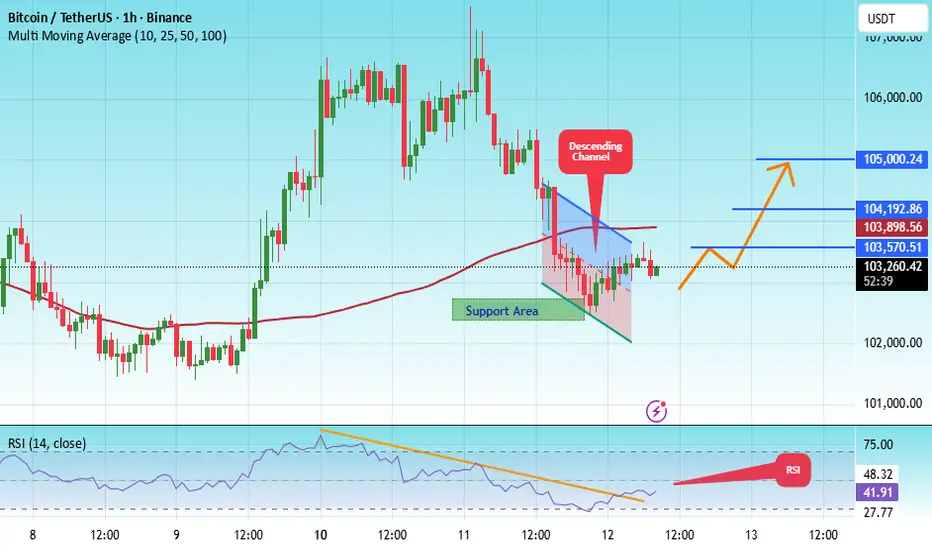
#BTC/USDT can give massive rally but breakout needed#BTC
The price is moving within an ascending channel on the 1-hour timeframe and is adhering to it well. It is poised to break out strongly and retest the channel.
We have a downtrend line on the RSI indicator that is about to break and retest, which supports the upward move.
There is a key support zone in green at 102474, representing a strong support point.
We have a trend to stabilize above the 100-period moving average.
Entry price: 103120
First target: 103570
Second target: 104190
Third target: 105000
Don't forget a simple money management rule:
Place your stop-loss order below the support zone in green.
Once the first target is reached, save some money and then change your stop-loss order to an entry order.
For any questions, please leave a comment.
Thank you.
Bitcoin Analysis and StrategiesYesterday, Monday, the market opened with an initial upward move, reaching a high of 106.6k before pulling back. During the US session, it bottomed at 104.6k before rebounding, ultimately closing around 106k, forming a consecutive bullish pattern on the daily chart. Today, it opened higher, reaching around 107.5k.
Currently, the daily chart shows three consecutive positive days, which is indeed quite good considering the overall upward trend. However, we cannot ignore the weakness on the weekly chart, nor can we ignore Tuesday's usual decline. The decline in the past few days has created a lot of resistance. Now, the bulls are constantly making new highs, so we need to continue to look for new resistance. Today, we should focus on the 110k-110.5k area. On the first touch, we can consider a small short position to profit from a short-term downward move.
Yesterday, the price tested 104.6k multiple times and rebounded. This point was also the highest point of the first rebound since the 99k decline. At that time, the starting point of the new round of decline was 104.5k. The subsequent breakout formed a top-to-bottom reversal. Firstly, the four-hour chart closed relatively weakly. For today, if the price turns downward again, I think the 104.8k-105.8k points are likely to form support and lead to a rebound. However, the specific point will depend on the real-time dynamics of the four-hour and hourly charts.

ANFIBO | BTCUSD - Still in a boring range [11.11.2025]Hey guys, Anfibo's here!
BTCUSD Analysis – Daily Trading Plan
Overall Picture:
The prior sell at $107,000 executed according to plan and produced a clean, profitable outcome — well done to those who took it and locked in gains. Currently BITSTAMP:BTCUSD is trading in a sideways, slightly upward-drifting range as liquidity is being gathered beneath the upper trend boundary. Momentum is constructive but not yet impulsive; therefore the highest-probability edge today is to wait for price to touch the established trendline and read the reaction there before committing to fresh short exposure.
Trading Plan for Today:
>>> BUY ZONE:(x1000)
ENTRY: 104 - 105
SL: 103
TP: 110
>>> SELL ZONE: (x1000)
ENTRY: 109 - 110
SL: 111.5
TP: 104 - 95
Risk Management:
- Risk a controlled percentage of equity per trade (e.g., 1–2% max capital risk per position) and size positions so SL distance equals the planned risk.
- Scale sizing: take a smaller initial position at Entry (1) and add selectively at Entry (2) only after clear bearish rejection or failed retest.
- Use tight, logical SLs (as listed) and consider moving SL to breakeven once TP1 is achieved to protect gains.
- Monitor intraday volatility and major news — reduce size or sit out if market structure becomes erratic or if a scheduled macro event is imminent.
Conclusion:
The market rewarded our prior sell at $107k — a good example of discipline and structure-based trading. Today’s plan remains conservative: let BTC approach the trendline / upper channel, observe price reaction, and initiate short exposure only on a clear rejection or failed retest. Maintain strict risk controls, scale thoughtfully, and avoid averaging into a losing trade. This patient, reaction-based approach keeps the odds in our favor while respecting the prevailing range dynamics.
HAVE A NICE DAY, GUYS!

btc await breakout to buy or sell#BTCUSD is in middle of pattern rejection which will take off on sell till 104k-102600. But first we await for 3 times breakout below 105500 to sell.
Sell stop at 105500 on 3 times breakout cause of rejection or reverse on buy, target 104k-102600.
If price reverse back above 106600 then bullish continuation is possible, target 107300-108600.

BTC: Decision Zone Ahead After Double Bottom ReversalHi!
Bitcoin has formed a clean double bottom at the daily support zone, followed by a sharp bullish impulse that also broke the descending trendline. This shift in momentum signals that buyers are regaining control in the short term.
Price is now approaching the Decision Zone, a key supply area where the previous breakdown began. This zone will determine whether the current recovery is just a reaction or the start of a larger bullish continuation.
If buyers manage to break and hold above this zone, the chart opens the door for a broader move toward the 113K region, which aligns with the next major liquidity cluster.
Until that breakout happens, this area remains a potential rejection point, so watching how the price behaves inside the zone is crucial.

#BTC/USDT Strong Surge: Heading Towards 104074 USD !#BTC
The price is moving in a descending channel on the 1-hour timeframe and is expected to break out and continue upwards.
We have a trend to stabilize above the 100-period moving average again.
We have a downtrend on the RSI indicator, which supports an upward move if it breaks above it.
We have a key support zone in green that pushed the price higher at 101236.
Entry price: 101985
First target: 102528
Second target: 103208
Third target: 104074
For risk management, don't forget your stop-loss and money management.
The stop-loss should be below the green support zone.
Upon reaching the first target, take some profits and then change your stop-loss order to an entry order.
For any questions, please comment.
Thank you.

Bitcoin Daily Analysis #12 — November 10, 2025
Bitcoin has triggered our entry setup 🔔
As I mentioned before, fear during FOMO candles means nothing — what truly matters is structure and confirmation.
It seems that Bitcoin has found support around the $100,000 zone and could be starting a new bullish leg 🚀
Any higher low above $104,000 will serve as a confirmation of an uptrend ✅
Disclaimer:
This content is for informational purposes only and does not constitute financial or investment advice. © DIBAPRISM
Larry D.Kohn

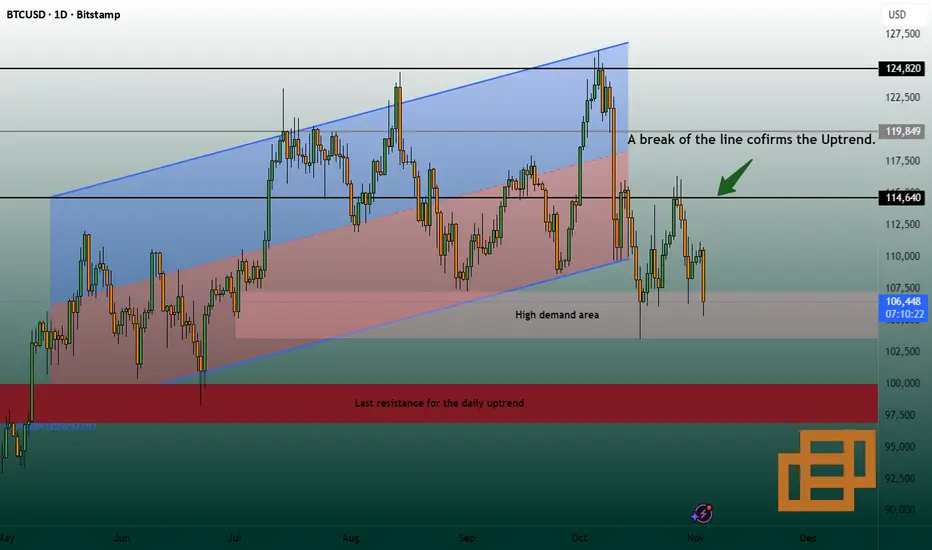
$BTC - Critical Support at $100K | Trendline RetestCRYPTOCAP:BTC is sitting at one of the most important levels we’ve seen this year — the $100,000 psychological support zone.
After a multi-month consolidation and a sharp retest of the bullish ascending trendline that has held firm since mid-2024, Bitcoin is once again testing the structure that has defined the uptrend for over a year.
This level will determine whether the next move is a rebound back toward $109K–$126K, or a deeper pullback toward the $92K–$95K horizontal channel below.
🧭 Technical Overview
Support: $100K (key trendline) → $95K → $92K
Resistance: $109,358 → $120K → $126,296
Trend Structure: Rising wedge channel intact since 2024
Momentum: RSI hovering near neutral; previous rebounds from this trendline have led to 20–30% rallies
Volume: Declining on recent pullback — suggesting correction, not reversal
So far, every retest of this yellow ascending support has resulted in higher highs. If this pattern holds, the next target zone is between $126K–$139K, aligning with the November seasonal cycle projection.
📅 Projection Targets
November 8, 2025: $139,000 (as tracked on @Stocktwits Calendar)
January 1, 2027: $145,000 long-term extension target
This would align with the macro halving-cycle rhythm — consolidation, mid-cycle shakeout, and renewed acceleration into the next demand phase.
💬 My Take:
If CRYPTOCAP:BTC holds this $100K base and confirms a rebound above $104K, I expect renewed momentum across majors — with CRYPTOCAP:ETH , CRYPTOCAP:SOL , and CRYPTOCAP:XRP likely following.
Failure to hold $100K could open the door to a flush toward $92K before resumption, but bulls have defended this channel repeatedly for nearly 18 months.

BTC/USD) Bearish trend analysis Read The captionSMC Trading point update
Technical analysis of BTC/USDT (4-hour timeframe). Here's the idea breakdown:
---
1. Overall Structure
The price is moving within a descending channel, suggesting a broader downtrend.
The two black trendlines show clear lower highs and lower lows forming.
---
2. Key Zones & Indicators
Blue Zone (104,000–106,000 region):
This is a major supply/resistance zone where price has repeatedly rejected.
The two red arrows mark failed attempts to break above it — confirming strong bearish pressure.
EMA 50 (blue line) and EMA 200 (black line):
Price is trading below both EMAs, confirming bearish market structure.
The 50 EMA is below the 200 EMA, indicating a bearish crossover (momentum continuation signal).
---
3. Expected Move
After the recent rejection from the supply zone, the chart projects a bearish continuation:
A possible small pullback or consolidation.
Then a drop toward the target area near $90,099, which aligns with the lower boundary of the channel (major support).
---
4. Target
Target Point: Around $90,100, which could be the next liquidity zone or potential demand area.
---
5. Summary
Trend: Bearish
Structure: Lower highs & lower lows (descending channel)
Bias: Continuation to the downside
Confirmation: Rejection from supply + EMA resistance alignment
Target: $90,100
Mr SMC Trading point
---
Trading Idea Summary:
“BTC is maintaining a bearish structure under EMA resistance and rejecting the 104–106K supply zone. Unless price reclaims that level, continuation toward 90K support remains the high-probability scenario.”
Please support boost 🚀 this analysis

BTC Is Warming Up for Its Next Big Move — Don’t Miss This Setup Few thoughts about BTC:
when you trade crypto you have to look at 4h+ time frame, daily or weekly is the best to see clean picture.
Right now BTC just touched discount( 100359)
now i can see 3 possible scenarios
1 - small pull back next week and then pump 130-140k first target
2 - price will go a bit deeper to fill weekly FVG at ~90k
3 - CRYPTO SCAM AND WE ARE ALL DOOMED😱😱😱
until we didnt see BTC break below 70k , i am still bullish on crypto and buying some coins on spot for my portfolio, i am not heavy in crypto but 200-300$ a week is nice investment with potential x10-20 return is nice option

BTC/USDT — 1H Chart AnalysisTechnical Bias: Bullish Reversal Setup
Analysis Overview:
BTC is showing strong signs of a potential bullish reversal after retesting the key $99,000 support zone, which has historically acted as a high-volume demand area. The current structure suggests absorption of selling pressure with narrowing spreads and stable volume — a classic VSA accumulation signal.
Key Technical Insights:
Support Zone ($99,000 – $100,000): Price rebounded from this zone with visible buying tails and decreasing spread on down bars, indicating professional demand stepping in.
Resistance Zone ($114,000 – $115,000): Previous double-top area highlighted in green; this will be the next major resistance where profit-taking may occur.
Volume Behavior: Volume dropped during the last downward push, suggesting a lack of selling momentum — a bullish sign within VSA logic.
RSI Recovery: RSI bouncing from the oversold region confirms early momentum shift to the upside.
Trade Setup:
Buy Entry: Above $106,000 (confirmation of reversal structure)
Target Zone: $114,500 – $115,000
Stop Loss: Below $105,000 support
Risk–Reward Ratio: ~1:5, favoring long bias
Conclusion:
BTC holds a higher probability of upside continuation, supported by strong demand near support and weakening supply pressure. A sustained close above $106,000 will likely trigger a momentum rally toward the $115K resistance area.

Little Short Won’t Hurt a LotI’m opening a small short on Bitcoin.
You know that I’m expecting a decline toward 104K and possibly lower.
At the moment, I’m looking for a small move down — just a part of the bigger bearish trend.
Targets and stop are marked on the chart

Bitcoin Daily Analysis – November 03, 2025Welcome back to Bitcoin Daily Analysis 💹
😶🌫️ Bitcoin is currently facing a lot of uncertainty — market conditions have created confusion among both short-term and long-term holders.
In my opinion, we’re in a phase where it’s best to wait and observe how price reacts to this zone 👀.
Personally, I still believe the overall trend remains bullish 🚀 — as long as we don’t see a confirmed breakdown below the 98,000 zone on the daily timeframe, the bullish structure stays intact 📈
Your profit and capital safety depend on your patience and consistency — so stay behind the charts and be ready to catch the next opportunity 🎯
And as always — don’t forget risk and capital management 💼📉
Disclaimer:
This content is for informational purposes only and does not constitute financial or investment advice. © DIBAPRISM
Larry D.Kohn
#BTC/USDT – When the Bullish Wave Returns#BTC
The price is moving within an ascending channel on the 1-hour timeframe and is adhering to it well. It is poised to break out strongly and retest the channel.
We have a downtrend line on the RSI indicator that is about to break and retest, which supports the upward move.
There is a key support zone in green at 106775, representing a strong support point.
We have a trend of consolidation above the 100-period moving average.
Entry price: 107347
First target: 107742
Second target: 108525
Third target: 109246
Don't forget a simple money management rule:
Place your stop-loss order below the support zone in green.
Once the first target is reached, save some money and then change your stop-loss order to an entry order.
For any questions, please leave a comment.
Thank you.

BTC-----Sell around 110300, target 109000 areaBTC Contract Technical Analysis (November 3rd):
On the daily chart, yesterday's close was a small positive candle. While the candlestick pattern shows consecutive positive days, there's been no clear pattern of a pullback, and the price hasn't broken higher. The accompanying indicators are still in a death cross, and the price is below the moving averages, indicating a clear downward trend. Therefore, our trading strategy for this week remains to sell on rallies, focusing on short-term trades. On the hourly chart, the price is under pressure during the US session, currently showing a pattern of consecutive negative candles followed by a single positive candle. The accompanying indicators are in a death cross, and the four-hour chart shows significant resistance. Therefore, we expect continued declines today, with a potential breakout during the European session.
Today's BTC Short-Term Contract Trading Strategy:
Sell at the current price of 110300, with a stop-loss at 110800 and a target of 109000.
