Bitcoin’s 4 year cycleRed line: peak
Green line: bottom
Red range: peak to peak
Green range: buttom to buttom
Yellow range: peak to buttom
Black range: buttom to peak
Using the 2 constant ranges, the next peak and buttom month can be derived.
Black range: Jan 2015 buttom to Dec 2018 peak took exactly 35 months
Dec 2018 buttom to Nov 2021 peak took exactly 35 months
So 35 months from Nov 2022 buttom is Oct 2025, indicating bitcoin may likely peak then.
Green range: Jan 2015 buttom to Dec 2018 buttom took exactly 47 months
Dec 2018 buttom to Nov 2022 buttom took exactly 47 months
So 47 months from Nov 2022 buttom is Oct 2026, indicating bitcoin may likely buttom then.
This assumes the trend continues
Btcusdanalysis

DeGRAM | BTCUSD will rebound from the support level📊 Technical Analysis
● BTC/USD completed a prolonged corrective phase, forming multiple falling and symmetrical triangles before reclaiming the key support zone near 92,000. The breakout above the descending trendline signals a structural shift toward accumulation.
● Price now holds above rising support while pressing against a dynamic resistance line, suggesting a potential bullish continuation toward the 100,000–105,000 area if momentum persists.
💡 Fundamental Analysis
● Bitcoin remains supported by steady institutional demand, ETF inflows, and expectations of looser global monetary conditions, which continue to favor long-term risk assets.
✨ Summary
● Breakout from long-term bearish structure confirmed.
● Key support: ~92,000.
● Upside objective: 100,000–105,000.
-------------------
Share your opinion in the comments and support the idea with a like. Thanks for your support!

DeGRAM | BTCUSD broke the resistance line📊 Technical Analysis
● BTC/USD completed a prolonged consolidation inside a symmetrical triangle after the November–December decline. Price has broken above the descending resistance line, confirming a bullish breakout with higher lows holding along the rising support trendline.
● The breakout is supported by compression release and range expansion, with price now targeting the upper trendline zone near 95,000–98,000. Former resistance around 90,000–92,000 acts as key support on pullbacks.
💡 Fundamental Analysis
● Bitcoin remains supported by expectations of looser global liquidity conditions, sustained institutional demand, and continued ETF inflows, reinforcing medium-term upside bias.
✨ Summary
● Bullish breakout confirmed. Support: 90,000–92,000. Targets: 95,000–98,000. Structure favors continuation above triangle support.
-------------------
Share your opinion in the comments and support the idea with a like. Thanks for your support!

The chart suggests a bearish bias: BTC is sitting near the suppoThe chart suggests a bearish bias: BTC is sitting near the support at 93,182 and the analyst expects a breakdown into the red target zone around 90,233.
A small‑scale idea would be to watch the 91,955 level (current price). If it breaks below the support, you could expect the price to chase the target at ~90,200. Conversely, if it bounces off 93,182, the move might stay in the range or test the seller zone again.

BTC is taking support at 90299.as you can see btc is taking support at 90.299 if it break we can short but it take support we can take trade in same direction with perfect candel stick conformation.
plan your trade accordingly.

BTC BUY SETUP ACTIVE🚀 BTC BUY SETUP | BULLISH MOMENTUM LOADING 🔥
Bitcoin is reacting from a strong demand zone with buyers stepping in aggressively. Market structure remains bullish, and momentum suggests a continuation toward higher levels if support holds.
📌 Trade Plan
🔓 Entry: 87500 – 87100
🎯 Target: 89000
❌ Stop Loss: 86400
⚠️ Trade with proper risk management. Not financial advice.
📈 Follow for more high-probability crypto & forex setups.

“BTC Bounce From Demand Zone – Targeting 94K Next📊 BTCUSDT Analysis (Based on Your Chart)
1️⃣ Price is Still Respecting the Range
Bitcoin is trading inside a wide consolidation box (around 91,000 – 93,000).
The recent drop tapped the bottom of the range, showing a clean liquidity sweep.
That wick below the box = fake breakdown → bullish signal.
---
2️⃣ Strong Reaction at Demand Zone
The chart shows BTC touching the demand/support zone, followed by a small bullish reaction (the black arrow).
This suggests:
Sellers failed to break lower
Buyers are stepping in exactly where expected
Market preparing for a reversal bounce
---
3️⃣ Expected Move (Your W Pattern Idea)
The drawn “W-shape” indicates a double bottom setup.
If the bottom holds around 91,000, BTC can push back toward:
🎯 Target: 93,500 – 94,000
This matches the upper boundary of the consolidation.
---
4️⃣ Bullish Scenario
If BTC holds above 91,000–91,300:
Reclaim mid-range
Break through resistance
Continue toward 94,000+
This aligns with the “BUY” tag you added.
---
5️⃣ Bearish Invalidations
Bullish idea is invalid if: ❌ Price closes below 90,800 on 30-minute
= fresh breakdown → deeper correction
---
🧠 Summary
BTC swept liquidity at the support → formed a bounce → still inside range → bullish reversal expected toward 94K

DeGRAM | BTCUSD seeks to the $80k📊 Technical Analysis
● BTC/USD remains under a descending dynamic resistance after a series of bear flags and a completed triangle breakdown. The failure to reclaim and hold above the 90,000 resistance confirms bearish continuation within the broader downtrend.
● Price is compressing below former support turned resistance, with momentum favoring a move toward the major demand zone near 80,000–82,000. Any rebounds toward 90,000 are viewed as corrective while below the resistance line.
💡 Fundamental Analysis
● Bitcoin faces pressure from tighter global financial conditions and reduced risk appetite, with capital rotating away from high-beta assets amid yield support for USD.
✨ Summary
● Bearish structure intact. Key resistance: ~90,000. Downside target: 80,000–82,000. Invalidation above descending resistance.
-------------------
Share your opinion in the comments and support the idea with a like. Thanks for your support!

DeGRAM | BTCUSD is forming an ascending wedge📊 Technical Analysis
● BTC/USD remains inside a broad descending structure, with price repeatedly rejecting the main resistance trendline. Multiple falling triangles and continuation patterns confirm sustained bearish control and lower highs across the 16H timeframe.
● The latest consolidation formed below trend resistance near 95,000–96,000, followed by rejection, signaling continuation risk toward the major demand zone around 84,000–82,000, where the long-term support line aligns.
💡 Fundamental Analysis
● Bitcoin faces pressure from tighter global liquidity conditions and cautious risk sentiment as markets reassess rate-cut expectations and ETF inflows lose momentum, keeping upside demand limited in the medium term.
✨ Summary
● Bearish bias below 96,000. Targets: 88,000 → 84,000. Key resistance: 100,000.
-------------------
Share your opinion in the comments and support the idea with a like. Thanks for your support!

Bitcoin - Dawn of the Dark with some LightI posted a similiar chart as private idea some days ago. ()
This idea here is an updated slightly adjusted version.
If i look at the big rise from 2017/2018 and our current swing i see certain similarities.
1. We created a top.
2. Downtrend and retest of the 50% of the swing.
3. Uptrend from the 50% and creating a swing high that takes out the big upper resistance
4. Again going towards 50% but this time no big buying showing up.
5. Fall under the 50% and heading towards the 23% - this is where we are now in the current swing
If both swings move similiar we should see the following happening now:
1. Move to the 23% level.
2. Buyers show up push price again towards the 50% level - but no clean retake
3. Price falling down again to the 23.60
Additional: In Both times we had Engulfs or SFPs of the High.
Problems with this analysis:
We cant deny that the retest of the 50% level on the second swing generated a Higher High (red line) - however its a weak Higher High as it barely went above the recent swinghigh. Besides the similiarities with the shakeout and retest of 2017. I classified it even as divergence or engulf in my recent analysis.

Bitcoin Breakdown Pullback Target Locked In📊 BTC Analysis – Breakdown With Incoming Retracement
Bitcoin has broken cleanly below the previous consolidation block, confirming a shift from neutral to bearish short-term structure. After the breakdown, price found temporary support around 90,000, where buyers are attempting a relief bounce.
Your chart highlights a likely retracement path toward the 92,500 – 93,000 zone.
This area lines up with:
The bottom of the last range (now turned resistance)
Ichimoku cloud resistance
A typical breakdown retest zone
A potential liquidity grab level before continuation
This makes it the most probable reaction zone for sellers to re-enter the market.
---
🔍 Key Technical Points
Trend: Short-term bearish after the breakdown.
Current Move: Relief bounce forming from local support.
Main Target: Retest into 92.5K–93K before resistance kicks in.
Expectation: BTC may bounce upward first, then face strong rejection from the marked zone.
Invalidation: A sustained break above 93,200 would weaken the bearish idea.

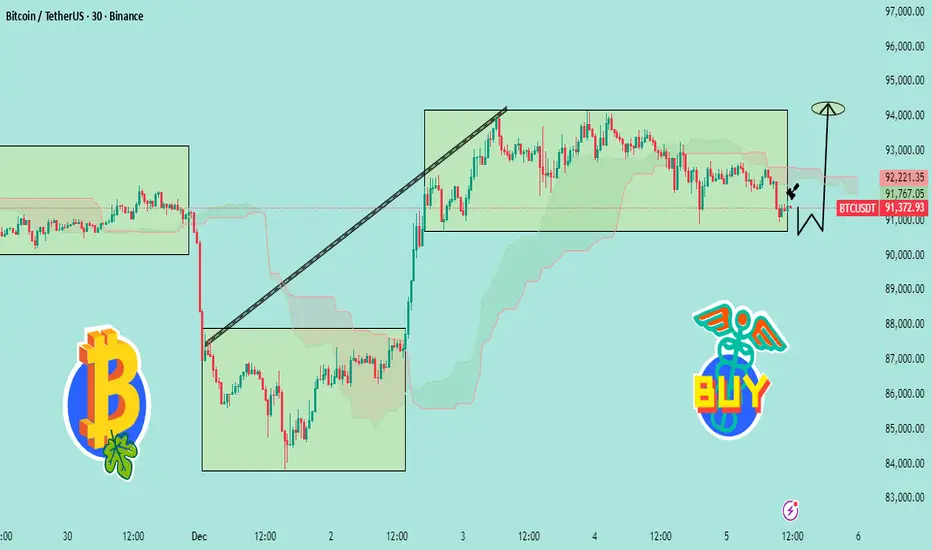
BTCUSDT – Major Distribution Zone Detected! Potential Drop Ahead📉 BTCUSDT – Distribution Completed, Correction Likely
1️⃣ Previous Range Accumulation (Left Zone)
Price moved sideways in a tight consolidation box.
After holding for some time, BTC broke down sharply, showing clear supply pressure.
---
2️⃣ Strong Recovery Rally (Middle Zone)
After the breakdown, price created a bullish accumulation zone.
A strong impulsive move up followed — this is a classic liquidity grab + reversal.
The diagonal trendline shows the momentum slope of the recovery.
---
3️⃣ Current Market Structure (Right Zone)
Price is currently inside another consolidation box, similar to the first range.
This suggests distribution, not accumulation.
Momentum is weakening near 93,000–94,000, with repeated rejections.
---
4️⃣ Expected Move (Bearish)
Your drawn projection is correct:
After sideways movement, BTC is likely to break down from this range.
Target region shown (~91,000 zone) makes sense because it aligns with:
Previous support
Unfilled imbalance
Ichimoku lower cloud support
---
5️⃣ Key Levels
Resistance: 93,800 – 94,200
Support: 92,000 → 91,000
Break Confirmation: Closing below 92,200
Bearish target: 91,000 – 90,800
---
🔍 Summary
BTC is forming a distribution zone after an overextended move. Market shows signs of exhaustion.
Unless BTC breaks above 94,200, the probability favors a move down toward 91,000.

BTC 2026 Outlook - Roadmap Speculation to $300KHello BTC Watchers.
Let's talk about BTC in the Logarithmic view.
I mapped out the date-ranges, as well as how far the price fell logarithmically after each top. You'll see the word "lines" on the chart. This simply indicates the amount of diagonal trendlines it has fallen. By using this pattern-dedicated approach, a commonality is found which may be useful in speculating a future price. Because if not for past history, how else would we speculate on the future?
It's interesting to note that the past 3 ATH's (all time high's) are each lower than the previous if you compare it not to price but to the "lines". Even the fifth high (the one coming next) will be on a lower click-line than the previous, and that estimate is already over 300k. This is a really helpful way to speculate a future high because usually on a regular-view chart, the zone above the ATH is uncharted territory. You could use a Fibonacci trend-based extension, but this is limited to the cycle that you're using for input points. Logarithmic chart + indicators factor in the entire history of the price.
This would mean the new peak could be in 2026 around USD 300k.
It's important to note that this ay not be a straight line up. As you'll see, although the price has been increasing exponentially, there have been periods of hard pullbacks or corrections. These are great times to enter the market, NOT when the price is close to the peak of the curve (in green).
So could it be that this is just another dip in the road towards a new ATH - despite the recent market liquidation?

DeGRAM | BTCUSD will test the $80k level📊 Technical Analysis
● BTC is retesting the multi-month support zone near 80K, aligning with the long-term ascending base and the lower boundary of the falling trend, creating conditions for a medium-term rebound.
● A break above the descending resistance line could trigger recovery toward 92K as the structure shows exhaustion of bearish momentum.
💡 Fundamental Analysis
● Recent ETF inflows and easing macro pressure from U.S. yields support accumulation near major support zones.
✨ Summary
● Bullish bias from 80K support. Targets: 88K → 92K. Key support: 80K.
-------------------
Share your opinion in the comments and support the idea with a like. Thanks for your support!

DeGRAM | BTCUSD will rebound to $92k level📊 Technical Analysis
● BTC/USD formed a false break below the 82K support zone while bouncing off the long-term dynamic support line, signalling seller exhaustion and a potential mid-trend reversal.
● Price is reclaiming structure inside the descending channel; a push toward 90–92K becomes likely if buyers break the local diagonal resistance.
💡 Fundamental Analysis
● Bitcoin sentiment improves as risk appetite stabilizes and institutional inflows show signs of recovery.
✨ Summary
Support: 82K. Targets: 90K → 92K. Medium-term bullish bias while above dynamic support.
-------------------
Share your opinion in the comments and support the idea with a like. Thanks for your support!

DeGRAM | BTCUSD continues to decline below $85k📊 Technical Analysis
● BTC/USD continues to move within a broad descending channel, rejecting the dynamic resistance line multiple times and forming lower highs.
● Price is failing to reclaim the 88–90K resistance zone, and the structure points toward a continuation lower into the 82–80K support region as momentum weakens.
💡 Fundamental Analysis
● Bitcoin remains under pressure as risk sentiment cools and ETF inflows slow, with stronger USD liquidity weighing on crypto.
✨ Summary
Resistance: 88–90K. Targets: 82K → 80K. Medium-term bearish bias while below channel resistance.
-------------------
Share your opinion in the comments and support the idea with a like. Thanks for your support!

A+++ Setup That Completed My Prop Firm Challenge
(Structure · Precision · Patience · Faith)
This trade wasn’t luck.
It wasn’t guessing.
It wasn’t hope.
It was pure structure, multi-timeframe alignment, perfect execution, and flawless risk management—and it ended up completing my Prop Firm Challenge.
Here’s the full story, exactly how the setup unfolded from the first signal all the way to final execution.
⸻
📌 Higher-Timeframe Context: The Bearish Top Was Already Set
Everything began with the 4H BOS around 93,900, which officially broke structure and created the macro bearish environment.
Then price formed a clear 4H Lower Low at 89,000, confirming the downtrend.
But the real clue came next:
👉 Price aggressively pulled back to 92,900–93,000, retesting the old 4H BOS zone
👉 Then failed to reclaim it
👉 Entered a tight range directly underneath the level
👉 Volume dropped
👉 Candle bodies got smaller
👉 Wick pressure increased
That’s redistribution—not accumulation.
I knew sellers were loading.
⸻
📌 LTF Alignment Begins: The Dominoes Fall One by One
Once I had the HTF context, I waited for LTF confirmation.
1️⃣ 1M BOS below 92,900
Signaled the first crack in the bullish micro-flow.
2️⃣ 5M Displacement + BOS
Not noise — real intent.
Selling pressure was confirmed.
3️⃣ 15M Market Structure Shift (MSS)
This was the decisive moment.
The bullish internal structure broke.
Momentum flipped.
The range under 92,900 was officially a distribution block.
4️⃣ 30M & 1H candle closes below 92,880
This erased any bullish reclaim attempt.
HTF + MTF now perfectly aligned.
At that point, the short wasn’t a prediction — it was a requirement.
⸻
📌 The Entry: Precision at the Retest
I placed my short on the retest of 92,900, right into the ceiling of the redistribution.
Entry: 93,055
Stop Loss: 93,943
Target: 90,955 (MTF sell-side liquidity)
⸻
📌 Risk Management That Passed the Challenge
I didn’t gamble.
I executed professionally:
✔️ 33.33% partial at 92,000 → +$96.75
✔️ SL moved to 93,210 → protected profits
✔️ 33.33% partial planned at 91,050 (SSL target)
✔️ 33.33% runner for extended continuation
When FTMO notified that I had completed the challenge, I closed the entire position at 91,950.
Clean. Controlled. Disciplined.
⸻
📌 Outcome: Challenge Completed by Structure Alone
No indicators.
No fundamentals.
No emotions.
No guesswork.
Just:
• 4H BOS
• LTF MSS
• Displacement
• Retest
• Liquidity targets
• Risk management
• And unshakable patience
My trade went from A+ to A+++ the moment all timeframes aligned perfectly.
This is the kind of setup you wait for — not the kind you chase.
⸻
📌 Final Words
I’m extremely grateful —
to God first,
to the journey second,
and to the discipline that carried me through.
If this breakdown gave you clarity and shows you how powerful clean structure can be…
👇
Leave a like, drop a comment, share it, and hit Follow.
Your support motivates me to keep bringing high-level breakdowns to the community.
more legendary setups to come.
COINBASE:BTCUSD OANDA:XAUUSD OANDA:EURUSD

DeGRAM | BTCUSD is testing the $90k level📊 Technical Analysis
● BTC/USD is testing a major support cluster near 88–90K, where price aligns with the long-term dynamic support line formed from previous triangle and flag breakdowns.
● The new rejection wick at support and the descending channel structure suggest a potential medium-term rebound toward 95–97K if buyers defend this level.
💡 Fundamental Analysis
● Bitcoin sentiment stabilizes as ETF inflows resume and risk assets recover after easing US inflation expectations.
✨ Summary
Support: 88–90K. Rebound potential: 95–97K. Medium-term bullish scenario valid while holding the dynamic support.
-------------------
Share your opinion in the comments and support the idea with a like. Thanks for your support!

Bitcoin trading idea 15-minute time frameHi traders
While Bitcoin has seen its liquidity targets (see the link below), we have reached the 4-hour support area in the lower time frame and we will have a few conditions to continue the path:
First, the 15-minute candle must stabilize within the specified support range, ultimately above the buyers' equilibrium level, i.e. 96.633. In this case, the pullback will have a buying position at this equilibrium level and then if it can see a 15-minute consolidation above 97.633, it will be a confirmation for the continuation of the rise for the high liquidity targets specified in the 4-hour chart.
Main chart link:

Bitcoin 4-hour updateHi traders
As expected, the market has collected all the liquidity areas drawn on the chart a few weeks ago and has entered the desired support area. So far, if you had followed my analysis, you would have made a profit of over $17,000, and of course, friends who followed along made good profits.
There are a few conditions to continue the path, which we will examine in the next post on the lower time frame.
Link to the main charts:

DeGRAM | BTCUSD BTCUSD is aiming to reach a key support level.📊 Technical Analysis
● BTC is approaching a major confluence zone where the long-term support line meets the key demand area near 94k–92k. This level previously triggered strong reversals.
● Price remains inside a broad falling structure, and a bounce from the lower boundary would confirm trend exhaustion and open room for recovery toward 102k–108k.
💡 Fundamental Analysis
● FXStreet reports renewed inflows into BTC ETPs and improving risk sentiment as markets expect milder Fed policy, supporting medium-term bullish pressure.
✨ Summary
BTC nearing 94k–92k demand; bounce may target 102k–108k. Key support: 92k. Break above falling trend = continuation.
-------------------
Share your opinion in the comments and support the idea with a like. Thanks for your support!

Bitcoin: Liquidity CycleTypical liquidity cycle is 5-6 years long (65m). Buy bitcoin before an upswing (or end of QT) and sell when liquidity tightens. Macro is the best way to analyze markets?
Adjust your stakes based on position of the cycle.
Markets can have risk-on, risk-off episodes. Where Bitcoin is a risk-on asset.
Use 10Y-02Y for guidance.
