BTC Strong resistance around 110k! only one direction -> downBTC is having a tough time crossing 110k due to strong resistance. It's now under SMA9/50 and there's a lot of room for it to continue dropping. With the gov shutdown looming next week, it could be a good recipe for BTC to continue dropping. Proceed with caution!
Btcusdanalysis

BITCOIN SIGNAL: PROBABILITIES SHOWING THIS NOW!! (careful) Yello Paradisers! Enjoy the video!
And Paradisers! Keep in mind to trade only with a proper professional trading strategy. Wait for confirmations. Play with tactics. This is the only way you can be long-term profitable.
Remember, don’t trade without confirmations. Wait for them before creating a trade. Be disciplined, patient, and emotionally controlled. Only trade the highest probability setups with the greatest risk to reward ratio. This will ensure that you become a long-term profitable professional trader.
Don't be a gambler. Don't try to get rich quick. Make sure that your trading is professionally based on proper strategies and trade tactics.

BTC 110K IS A NEW UPTREND FOR LOW TIME FRAME UPDATE 26/09/2025BTC/USDT Update
On the low time frame, BTC is still in a breakdown structure, trading around 109.5K – 109.7K.
However, the market is now approaching a key reversal zone where a new uptrend could start.
Key levels:
110K → first confirmation level. A strong reclaim and close above this would be the first signal for a potential uptrend after more than a day under pressure.
113,296 – 113,892 → main trend resistance zone. Only a breakout and confirmation above this range would flip the structure fully bullish again.
Upside scenario: A move back above 110K confirms low time frame strength, opening the path to test 113K+.
Downside risk: Failure to reclaim 110K keeps BTC under bearish momentum, with risk of continuation toward 108K or lower.
📌 Summary
BTC remains in breakdown mode but is close to reversal territory.
Above 110K → first low time frame uptrend confirmation.
Above 113K+ → stronger trend reversal back into bullish cycle.
Below 110K → downside risk stays active.

BTC 1H: Selling pressure remains dominant.1. Trend Context
The short-term structure remains bearish, with the price trading below the EMA.
After breaking through the 111,200 – 112,000 zone, the market is forming a small correction.
2. Key Levels
Nearest Resistance: 110,700 – 111,800. Important zone to watch during this correction.
Main Support (Demand Zone): 108,000 – 108,500. Next target if the downtrend continues.
3. Scenario
Key Scenario : Currently, an uptrend line has been formed, indicating a slight recovery after the previous sharp decline. Wait for the EMA to move closer to the price and form a momentum accumulation zone, after which a first breakout through the uptrend line will appear.
Alternative scenario : If BTC sustains recovery to 110,700, sell-off at this level could be considered.
Please like and comment to support our traders. Your feedback motivates us to produce more analysis in the future 🙏✨

DeGRAM | BTCUSD will retest the $106900 level📊 Technical Analysis
● BTC/USD rejected dynamic resistance and broke lower within the falling channel, confirming short-term bearish momentum.
● The price targets the 106,900 support zone, with continued pressure from lower highs and strong resistance near 124,000.
💡 Fundamental Analysis
● Bitcoin is weighed down by risk-off sentiment as U.S. yields rise, while weaker liquidity and stronger dollar outlook add to downside pressure.
✨ Summary
BTC/USD remains under dynamic resistance, targeting 106,900 support as bearish momentum dominates. Short-term outlook stays negative unless 114,000 is reclaimed.
-------------------
Share your opinion in the comments and support the idea with a like. Thanks for your support!

BTC Breakdown: Watching 112.6K-113.5K for Rejection Toward 109kHello guys!
Trend Structure:
The price was moving in a clear ascending channel, but recently broke down below the lower boundary with strong bearish momentum. This confirms a structural shift from bullish to bearish sentiment.
Current Price Action:
After the breakdown, BTC attempted a relief rally but is now struggling around the 112,682 – 113,581 resistance zone (marked in blue). This area was previously support inside the channel and is now acting as resistance (role reversal).
Scenarios (Entries):
Rejection at 112,682 zone:
If BTC fails to break above this resistance, sellers could step in and push the price lower. A clean rejection here would open the way toward 109,884 (next major support).
Deeper pullback to 113,581:
If bulls manage to push higher, the 113,581 level becomes the last line of resistance. A rejection here would be a high-probability short entry, also targeting 109,884.
Target Zone:
Both rejection scenarios point to 109,884 as the key downside target. A break below that level would increase bearish momentum toward 108,000 and possibly lower.

BTC where are going from here?See the analysis I have made with BTC still some lows to be had however if we break that high then possible run up to the 120's makes sense
Stay cautious
Kris/Mindbloome Exchange

BITCOIN, BITCOIN DOMINANCE, ETHEREUM ANALYSIS 9-14-25Bitcoin has done a nice pullback from the initial sell off from the all time high and found a good support on the 21 EMA on the weekly chart. From the 21 EMA on the weekly chart it's now at a fib resistance level of 0.5 and could potential push up to the 0.618 fib level( 118k) otherwise my expectation is that the pullback is done and another sell off is likely to send price done to the 200 EMA on the daily chart or potential target of $105,530 in the coming week.
Ethereum is also struggling at the 2021 resistance high and more likely to pullback to the 0.382 level ($3,823) before it's continuation to higher high breakout of the 2021 resistance level.
BTC dominance is still in a strong down trend but quite oversold and likely to bounce up a little to the 58% level before continuation of the down trend. I think BTC. Dominance will ultimately reach a bearish Pennant Target of about 55% before a potential reversal.
Thank you for reviewing my analysis and don't hesitated to share your thoughts in the comments section. cheers and I wish you the best of trades this week.

BTCUSD update May 22nd, 2025I have returned and here is my updated chart. I'm such a perfectionist sometimes when it comes to lines that it takes my hours to get them exactly how I envision. To start off, yes I am bullish on Bitcoin and believe that this cycle hasn't ended yet but I will admit that I think the end of it is closer than the beginning. With that being said, I will not disappear when the bear market starts, I will simply make updates and try to catch the bottom like I did in the past. So far I am going with history and my bottom target is above 66,800 and I expect the floor to fizzle out around 71-73k; if it ends up being higher than that, great! Overall this idea is just an update for my own personal records and my prediction is based on what has happen that last time this pattern was brought to us.
Stay safe out there, happy trading, and as always--Cheers!

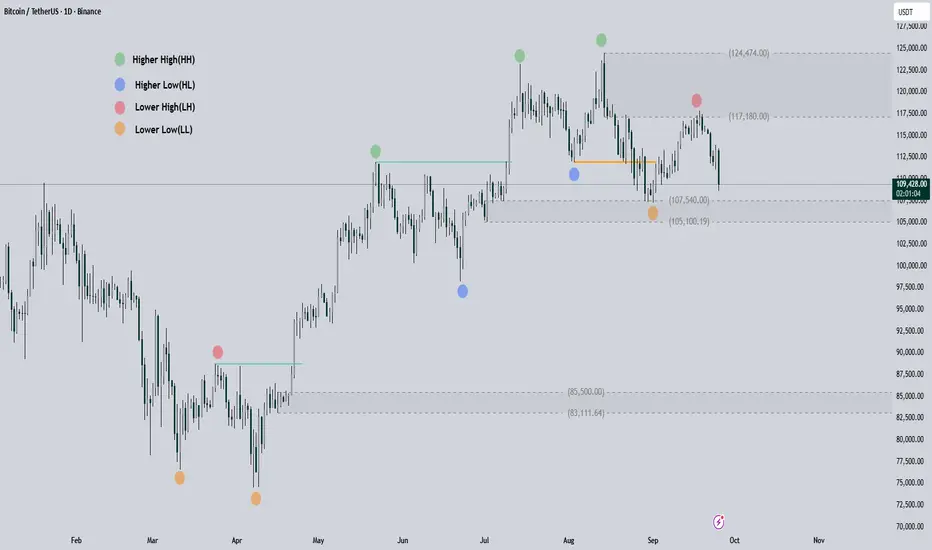
Bitcoin Price Analysis and PredictionIn my opinion, $124k was the highest price BINANCE:BTCUSD would see in this cycle, and the downtrend has started a long time ago.
The colored dots you see on the chart represent the main pivots of the weekly candles that were forming the bullish structure. Now we are seeing this structure being broken one after the other. You can see the key/legend for the colored dots on the chart.
Current Situation
Bitcoin broke the first weekly candle's Higher Low (HL) on August 22nd. Since then, we've seen a Lower Low (LL) and a Lower High (LH) on the weekly chart.
Now, the price is moving back towards that LL to break this LOW and form a new LL.
Last time, we saw good support at $107K and this area could be a support zone this time as well. However, the bearish structure has formed, and we will likely only face temporary reactions. In this area, we will either see the price range or a break of support and the start of a larger trend towards $85k.
Please note that this is just my opinion and it could be completely wrong. Even if it is correct, it might take a long time, or perhaps we'll move towards it with a sharp move!
$BTC More bleeding to come. Will cross SMA200BTC is in a downward channel and is going from SMA50 to SMA200 (down!). We'll see what happens, but Fridays it's typically softer and over the weekend less upside (if there is any at this point). Expect to drop and consolidate around SMA200 low 100k, and could cross 100k very soon. CBOE:MSTZ CBOE:UVIX are nice "insurance" policies right now :)

#BTC/USDT THE ONLY BITCOIN CHART YOU NEED!BTC : Almost There!
BTC is currently following the trajectory shown in my last chart. It took some time, but it’s playing out exactly as expected. Sooner or later, a bounce is coming — there’s no reason to panic unless we break below $103.5K, which is the key support level.
You need to understand that only when money moves out of BTC and big-cap alts will THE MID AND THE SMALL CAPS will have their time to shine. And sooner or later, you'll realise all this happened for good if you played it right. Even if not, many opportunities are coming ahead.
You’ll see this happen soon.
MY MESSAGE TO YOU ALL:
If you've been in crypto for a few years, you know this moment: it’s when the market is on the brink of a big move.
Be patient, it won’t happen overnight, but sooner or later, it will.
If you're currently in the red, take it as a lesson. It happens to the best of us. I've had four positions stopped out, too. It could have been worse if I hadn’t had a STOP LOSS in place.
The silver lining? I can re-enter at a better price.
A lesson I’ve learned over the years: STOP LOSS is a life-saver.
Stay strong and don’t give up right before the big opportunity we’ve all been waiting for.
Opportunities are ahead, manage your risks and remember to take a break, touch some grass. I’m with you.
I'll drop more charts shortly.
Stay strong, folks.
WAGMI!
Do hit the like button, and if you have any doubts, questions, or chart requests, drop them in the comments.
Thank you
#PEACE

Can't say I didn't warn you! BTC and VIXI hate to say it, but it will be worse than I thought! I've been telling folks to watch out as history repeats itself and the market is way too hot esp. in this crappy environment. There is more room to bleed. If you have a position, take the inverse like this second! CBOE:UVIX CBOE:MSTZ $ BTCZ could be nice plays

BTCUSD - Bitcoin short?Not easy to be a seller on bitcoin, but this looks really good.
This is not a trade recommendation; it’s merely my own analysis. Trading carries a high level of risk so carefully managing your capital and risk is important. If you like my idea, please give a “boost” and follow me to get even more.

Zoom out and $BTC is dropping like a rockDon't shoot the messenger! Zoom out and we can clearly see there's a lot more room to fall! There's always a little pullback when it drops; whales make sure to get good price when retail investors become exit liquidity. BTC dropping below key indicators and just wait until it crosses 110k! Proceed with caution. Good play for inverse CBOE:BTCZ / $MTSZ since MSTR will likely drop below $300 very soon. Best of luck out there!

Bitcoin Breaks Through Key Support Band — Price May Crash SoonAt the time of writing, Bitcoin trades at $111,542, reflecting a 4.7% weekly decline. The crypto king remains stuck below the $112,500 resistance, unable to attract enough momentum to flip the level into support.
If bearish pressure persists, Bitcoin could break through $110,000 support, opening a path to $108,000. Continued selling could extend the drawdown further, dragging BTC to $105,000 in the near term.
However, if investors step in to stabilize price action, Bitcoin could reclaim $112,500 as support. A successful bounce from that level would challenge the prevailing bearish narrative, potentially setting the stage for recovery and invalidating the downside outlook.

BTCUSD on the 30m timeframe1. Trend Context
BTCUSD on the 30m timeframe remains in a clear downtrend, forming consistent Lower Highs and Lower Lows.
2. Key Zones
SZ (Supply Zone): 114,250 – 114,750. Origin of the strong selloff, major resistance if price retraces upward.
SR (Structure Reversal): 113,000 – 113,250. Previously marked a short-term structural shift, now likely to act as dynamic resistance.
DZ (Demand Zone): 111,200 – 111,750. Price is currently testing this zone, which serves as short-term support.
3. Trading Scenarios
If DZ holds, a short-term bounce toward SR is possible.
If price rejects at SR, it offers a favorable short setup in line with the prevailing downtrend.
If DZ breaks, the downtrend may extend with a target around 110,000 or lower.
Please like and comment below to support our traders. Your reactions will motivate us to do more analysis in the future 🙏✨

BTC:ConsolidatingFor BTC, the short-term key support level isstill 111000, which is the starting point of the recent rebound. The strong support range is 105000–109000, while the strong resistance zone above remains at 115000. The overall trend is biased toward oscillating upward: if it breaks through the resistance level, it may accelerate its rise; if it falls below the key support, it may pull back.
At the same time, the approaching options expiration may intensify late-session volatility. It is recommended to gradually reduce leveraged positions after 16:00. Overall, Bitcoin's trend today will feature "oscillating to build a bottom and waiting for a breakthrough"—the competition between bulls and bears at key technical levels will determine the short-term direction. Investors should remain rational: they need to be alert to the potential pressure from the "September effect" while paying attention to the possibility of a rebound from oversold levels, and prioritize risk control when responding to market fluctuations.
Buy 111000 - 115000
TP 112000 - 112500 -113000
Daily-updated accurate signals are at your disposal. If you run into any problems while trading, these signals serve as a reliable reference—don’t hesitate to use them! I truly hope they bring you significant assistance

BTC PLAN TODAY | SEP.25 | BEARISH TREND 👉 1. Market Structure
Around 114,000, price made a Break of Structure (BOS) to the downside → confirming a bearish short-term bias.
After that, a CHoCH followed by another BOS down reinforced the bearish trend.
The descending red trendline shows momentum is still bearish.
4. Trade Scenarios
Scenario 1 (primary bias – bearish continuation):
Wait for price to retrace into 112,600 – 113,200 (Fib confluence + FVG + Supply).
Look for bearish confirmation to Sell.
Short-term TP: 112,000 → Extended TP: 111,600.
Scenario 2 (less likely – bullish reversal):
If price breaks and sustains above 113,400, structure may shift bullish.
In that case, look for Buy opportunities targeting 114,000 – 114,200.
👉 Summary:
BTC on the 30m timeframe is still in a bearish structure. Best sell zone is 112,600 – 113,200, with downside targets at 112,000 and 111,600.

BTC Bearish in a Daily Technical AnalysisHeya, i'm sharing my insights on BINANCE:BTCUSDT.P
Based from this chart, BTC is showing a bearish divergence signaling a POTENTIAL move downwards.
Using Fibb tool, I have marked the potential supports once it does move downwards.
This idea is on a daily perspective.
Comment down your insight and let us all learn.

Bitcoin key demand zone and movement scenariosOn the 4H BTCUSD chart price is consolidating around 111,000–112,000 under selling pressure. The key demand zone lies between 107,000–105,000 with the next strong support at 100,800. Losing these levels could accelerate bearish momentum. On the upside, a breakout above 115,800 and confirmation above 117,500 would open the path toward 120,000 and potentially higher. Investor interest in Bitcoin remains strong, with institutions continuing to hold positions despite local corrections. The market is closely watching the Federal Reserve’s policy and USD dynamics, both of which directly impact risk assets. In times of uncertainty cryptocurrencies continue to serve as an attractive diversification tool. BTC remains highly volatile, with 105,000 as key support and 117,500–120,000 as resistance. If risk appetite returns, growth scenarios could develop, yet a decline toward 100,000 cannot be ruled out. Risk management and partial entries remain essential.

BAD NEWS for Bitcoin :(. BE CAREFUL!My last Prediction was PERFECT . i know this will UPSET many bulls, but this is how the MARKETS WORK. After a strong uptrend and extreme greed environment, its time for Bitcoin to CORRECT and have strong PULLBACK. Look at the channel and trendlines, I expect bitcoin to reach a price of 100k/96k in the coming weeks. That will be a GOOD BUY opportunity. BE CAREFUL AND STAY WISE.
See My Previous PERFECT prediction:
BINANCE:BTCUSD COINBASE:BTCUSD CRYPTO:BTCUSD OKX:BTCUSD

BITCOIN SIGNAL: IS IT ABOUT TO GET WORSE??!! (scary) Yello Paradisers!
Together, we go through multiple timeframes. We are going through an ultra-long timeframe, breaking of the channel. How proper reclaims look, what the preceded price action is that is going to happen next and what preceded before that, and what the cycles are. We are taking a look at the bearish divergence, a shooting star which increased the truncation probability on lower timeframes.And that we are in the first motive mode wave of a higher-degree impulse.
On a high time frame chart, we are going through the secondary wave, the bearish divergence, resistances, and with the highest probability, the secondary wave is not yet finished. We are looking for confirmations from a high time frame perspective.
On a medium timeframe, we are deeply calculating the sub-waves. I'm sharing with you the fourth wave that, with the highest probability, is finishing, and we are about to have a fifth corrective mode wave because we are in an ending diagonal.
On a low timeframe chart, I'm sharing with you the expanding triangle and the upcoming price action with the highest probability.
Paradisers! Keep in mind to trade only with a proper professional trading strategy. Wait for confirmations. Play with tactics. This is the only way you can be long-term profitable.
Remember, don’t trade without confirmations. Wait for them before creating a trade. Be disciplined, patient, and emotionally controlled. Only trade the highest probability setups with the greatest risk to reward ratio. This will ensure that you become a long-term profitable professional trader.
Don't be a gambler. Don't try to get rich quick. Make sure that your trading is professionally based on proper strategies and trade tactics.
