BITCOIN SIGNAL: ANOTHER PERFECT PREDICTION (warning) Yello Paradisers! As always, as professional traders in this video, once again, we will go through multi-timeframe analysis. We are using Elliot Wave, indicators, advanced technical tools, and price action reading. Enjoy it. I love you.
Paradisers! Keep in mind to trade only with a proper professional trading strategy. Wait for confirmations. Play with tactics. This is the only way you can be long-term profitable.
Remember, don’t trade without confirmations. Wait for them before creating a trade. Be disciplined, patient, and emotionally controlled. Only trade the highest probability setups with the greatest risk to reward ratio. This will ensure that you become a long-term profitable professional trader.
Don't be a gambler. Don't try to get rich quick. Make sure that your trading is professionally based on proper strategies and trade tactics.
Btcusdanalysis

$BTC fake pump, you won't be savedSo there's some consolidation taking place, and that's normal at these levels. But let's zoom out for a bit and see the forest vs. the trees. What do we see? Downward channel SMAs / support resistance levels. What does that mean? it will bounce within the downward channel. The direction is way too strong moving it down to it's true support levels. Liquidity is down for retailers and institutions don't have the appetite to experiment with ultra high volatility esp. with YoY diminishing returns. Blackrock is dumping, and some are looking to get luck and hope for an upside. Hope is not a strategy! Maybe one day it will go up higher, but first it will cross 75k and many will get completely wiped out. I've see this many times before. Best of luck and always do your own dd!

BTC/USDTAnalysis:
BTC/USDT is currently showing weakness after breaking below a key support level, which has now turned into resistance (highlighted zone). Price is retesting this area, and if it fails to break above convincingly, it may confirm continuation to the downside.
Key Points:
The highlighted red zone is a strong supply area where sellers previously took control.
Price is forming lower highs, showing bearish momentum.
A rejection from this zone could trigger another leg down.
Trade Idea:
Entry: Wait for bearish confirmation around the resistance zone.
Target: Next support levels below.
Stop Loss: Above the red zone to protect against invalidation.
This setup is based on a classic support-turned-resistance scenario and market structure continuation.

DeGRAM | BTCUSD is retesting the support area📊 Technical Analysis
● BTC is holding above the 111,450–112,000 support zone, forming rejection candles that confirm demand strength.
● Price action indicates a potential rebound toward 118,000 with a breakout possibility if momentum sustains.
💡 Fundamental Analysis
● Optimism from institutional inflows and ETF accumulation continues to support medium-term bullish sentiment, while reduced miner selling adds stability.
✨ Summary
BTC shows bullish momentum from the 111,450 support, eyeing 118,000 as the next resistance with room for continuation if demand persists.
-------------------
Share your opinion in the comments and support the idea with a like. Thanks for your support!

BTC BIAS IS STILL BEARISH, CAREFULLY AT ZONE 113.20 - 113.50 📊 Market Overview
The market remains in a downtrend, with price still trading below the descending trendline. Buyers are showing some short-term reaction, but overall momentum favors the sellers.
🔑 Key Potential Zones
Upside: price is likely to face strong reaction around the 113.20 – 113.50 area.
Downside: if rejection occurs, price can revisit 112.00 – 111.80 as the next potential target.
✅ Trading Plan
Scenario 1 (Bearish Continuation):
If price rejects around 112.80 – 113.40 (Fibo + FVG), potential short entries targeting 112.00 and then 111.40.
Scenario 2 (Bullish Breakout):
If price breaks and closes above 113.50 trendline, it may test higher FVGs around 114.00 – 114.40 before any continuation.
👉 Summary:
Market bias is still bearish. Watch carefully how price reacts at 113.20–113.50. Rejection = continuation down. Breakout = potential retest higher zones.

@BTC shows thick red candles....yikesBTC is cross key technicals showing weakness across the board and there's a lot more to give! If you're holding and waiting, don't! Just sell and park before you become a bag holder or support lines. It's now moving downwards and that's the set direction. Always make trades with the flow with strength, not weakness. At this rate, it will cross below 110k this week (or lower).
Best of luck!

Following BTC’s retracement and corrective phaseBTC underwent a sustained retracement yesterday, yet it failed to breach our downside support level at 111000. Subsequent price action formed a range-bound consolidation phase above this support zone. Consequently, we assess that following yesterday’s sharp pullback and corrective phase, BTC is now in a state of short-term oscillatory movement within the context of its broader uptrend.
Buy 112000 - 112500
TP 113000 - 113500 -114000
Daily-updated accurate signals are at your disposal. If you run into any problems while trading, these signals serve as a reliable reference—don’t hesitate to use them! I truly hope they bring you significant assistance

BTC Key Support Test - Will the Bulls Defend?📊 NFX COINBASE:BTCUSD Trade Update
OKX:BTCUSD currently at a major crossroad and key area of interest.
Price sits right at the supply-demand zone and around the 200D SMA on the H4, which is holding up as strong support. What happens here will be critical for the coming weeks and the remaining days of September.
There’s always the possibility of a dip lower to test the 108K zone, but that seems unlikely for now. Then again, this is BINANCE:BTCUSD - the Wild West - where a 10K dump and 10K recovery can happen within 24 hours. ⚡
My bias: expecting a bullish reversal from current support , but I’m keeping close watch on the conditions below.
✅ Conditions for Bullish Trade:
Breakout above the 38.2% FIB
Close above the Trend Resistance
Reclaim the Supply-Demand Zone
Established Bullish Divergence
👀 Watching price action very closely - the next moves from here could set the tone for the rest of September.

BTC at Crossroads: Next Bullish Leg Loading?📢 NFX COINBASE:BTCUSD Trade Update
In this video analysis, we took a deep dive into the BINANCE:BTCUSD market - what happened, where we are now, and what’s likely to happen next.
📍 OKX:BTCUSD is currently sitting at a key area of interest. While there’s a lot of uncertainty among traders, I believe we’re positioned for the next strong bullish leg up. I shared my detailed thoughts in the video.
💬 Let me know what you think and drop your charts in the comments below.

Bitcoin’s Breaking Point: Why Price Needs To Stay Above $111,500At the time of writing, Bitcoin trades at $112,960, holding slightly above the $112,500 support level. Within the last 24 hours, BTC slipped from $115,100 and touched $111,478 during its intra-day low. This volatile action underscores the importance of maintaining current levels.
The crypto king has so far managed to stay above $111,400, the STH cost basis. By securing $112,500 as support, Bitcoin has the potential to bounce back toward $115,000, which would help prevent a bear market structure from taking shape.
However, any renewed selling pressure could drag Bitcoin through $112,500 and toward the $110,000 support. If that occurs, the bullish thesis would be invalidated, and BTC could slide further, officially marking the onset of bearish momentum.

Bitcoin Price Update and Trading Plan
**Current Situation**:
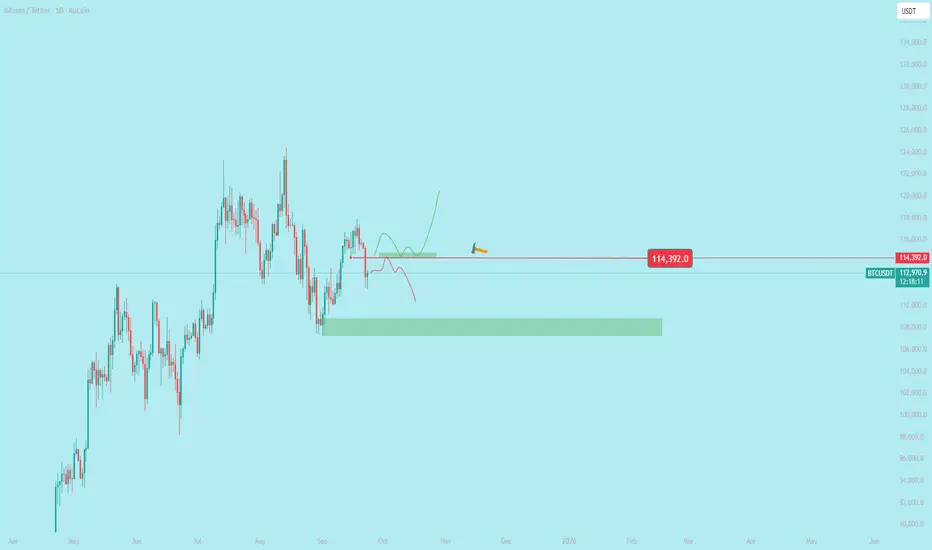
Bitcoin (BTC) is at a critical level, and its weekly closing price is highly important for traders. A strong bounce from the current price, followed by a weekly close above **$114,500**, is needed to confirm bullish momentum. This could lead to a significant upward move, allowing traders to capitalize on the next strong price movement. However, BTC should first retest its key support level, which it previously broke, to confirm its strength. If rejected at this support, a downward move toward **$108,000** is possible.
**Trading Plan**:
1. **Bullish Case**:
- **Condition**: If BTC bounces from its current level and closes above **$114,500** on the weekly chart, it signals strong bullish momentum.
- **Action**: Enter a long position targeting higher levels, such as **$117,200-$120,000**.
- **Stop Loss**: Place below **$114,000** to manage risk.
- **Rationale**: A close above **$114,500** confirms support and sets the stage for the next upward move.
2. **Bearish Case**:
- **Condition**: If BTC fails to hold above **$114,500** and breaks below the key support, it may retest the **$108,000-$110,000** zone, where it previously found support.
- **Action**: Wait for confirmation of a bounce at **$108,000** for a potential long trade, or short if rejection occurs at this level.
- **Stop Loss**: For shorts, place above **$115,000** to limit risk.
- **Target**: A downward move could target **$108,000**, with further declines possible if selling pressure increases.
- **Rationale**: A rejection at **$108,000** after breaking key support indicates bearish pressure, potentially leading to a deeper correction.
**Key Levels to Monitor**:
- **Support**: **$114,500** (immediate), **$108,000-$110,000** (major support zone).
- **Resistance**: **$117,200-$118,000** (immediate), **$120,000+** (next target).
- **Weekly Close**: The weekly close on September 28, 2025, will determine whether BTC confirms bullish strength or signals a deeper pullback.
**Conclusion**:
For a bullish outlook, BTC needs to close above **$114,500** to confirm a bounce and target higher levels. If it fails, traders should prepare for a potential retest of **$108,000**, where a rejection could lead to further downside. Monitor price action closely and use tight risk management due to BTC’s volatility.
*Disclaimer*: Cryptocurrency trading is highly risky. This is not financial advice; always conduct your own research before trading.
DeGRAM | BTCUSD is testing the $110k📊 Technical Analysis
● BTC/USD remains within the rising channel, with the current pullback testing the 110,000–109,700 support cluster. This aligns with both the mid-channel trendline and prior demand.
● A bounce from this zone would confirm the complex correction as complete, setting the stage for a retest of 117,686 and, on breakout, a drive toward the 126,961 resistance band.
💡 Fundamental Analysis
● On-chain data highlights persistent whale accumulation during this dip, while ETF inflows remain robust despite market pullbacks. This structural demand continues to exceed miner supply, keeping the broader trend supportive.
✨ Summary
Bullish above 109,700; rebound eyes 117,686 → 126,961. Invalidation below 109,700.
-------------------
Share your opinion in the comments and support the idea with a like. Thanks for your support!

BTCUSD 1H: Short Opportunity on Support Break & EMA Confluence🟨 Main Trend:
Based on the EMA indicator, the BINANCE:BTCUSD market is currently in a short-term downtrend. Pullbacks have only reached the EMA before facing renewed selling pressure.
🟨 Accumulation & Support Zone:
The price is moving sideways around a key support zone at ~112,800 – 113,200. This area has repeatedly attracted buying interest but has not yet produced a clear breakout.
🟨 Entry & Risk Management:
A valid short entry can be considered once a candle closes below the support zone, in confluence with the EMA continuing to slope downward.
Stop-loss should be placed above the EMA zone or the nearest resistance.
🟨 Targets:
Potential downside extension toward deeper support levels around 110,000 – 109,000.
🟨 Scenarios to Watch:
Bearish continuation (primary scenario): Wait for a support break and confirmation with a closing candle.
Alternative scenario 2: If the price breaks out above resistance, wait for confirmation that an uptrend is forming before looking for long opportunities.

BTC 4H BTC analysis for 4H TF. Regular divergence is spotted on 4H time frame. We can se upward movement from here. Important resistance level is given on chart.

Bitcoin Rebounds from 112k – Bulls Eyeing 120kAfter reaching a local high around the 118k zone, Bitcoin corrected down to the 112k support, building a clean technical structure.
From that area, the market is now reversing, showing strong bullish control.
As long as 112k remains intact, we can expect a new leg higher, with the first target set at 120k.
Patience is key here – the market gave us the correction, and now it’s about following the trend 🚀

BTCUSD POSSIBLE BUY SETUP💡 BTCUSD 4H Outlook – Recovery Setup in Play
After a strong sell-off that created a Change of Character (ChoCH), price has now tapped into the demand zone around 112,000 – 113,000. From here, I’m watching for signs of accumulation and potential continuation back to the upside.
🔼 Bullish Scenario
If buyers hold this demand, we could see a rally toward the first supply zone near 116,000.
A clean break above that would open the way for a push toward the major resistance at 118,000 – 119,000.
🔽 Bearish Scenario
Failure to hold 112,000 support could trigger further downside. Next liquidity sweep would likely come below 111,500 and possibly deeper.
⚔️ Key Levels to Watch
Support: 112,000 | 111,500
Resistance: 116,000 | 118,000 – 119,000
📊 Current structure suggests bulls may try to defend this zone, giving a possible recovery leg.
✅ If this analysis helps you, hit the boost and follow for more updates on BTC and other pairs.
💼 For traders looking for account management services (personal or funded accounts), reach out — I can help with risk-managed growth and consistent strategies.

BTCUSDT Short Trade SetupTrend: Bearish
Divergence: None
Continuation Pattern: Bearish Flag
Harmonics : AB=CD
Bias: Bearish
Scenario: Sell Stop entry at B point Breakout
*Trade Plan*
Stop Loss: 113100
Entry Level: 111450
TP1: 109800

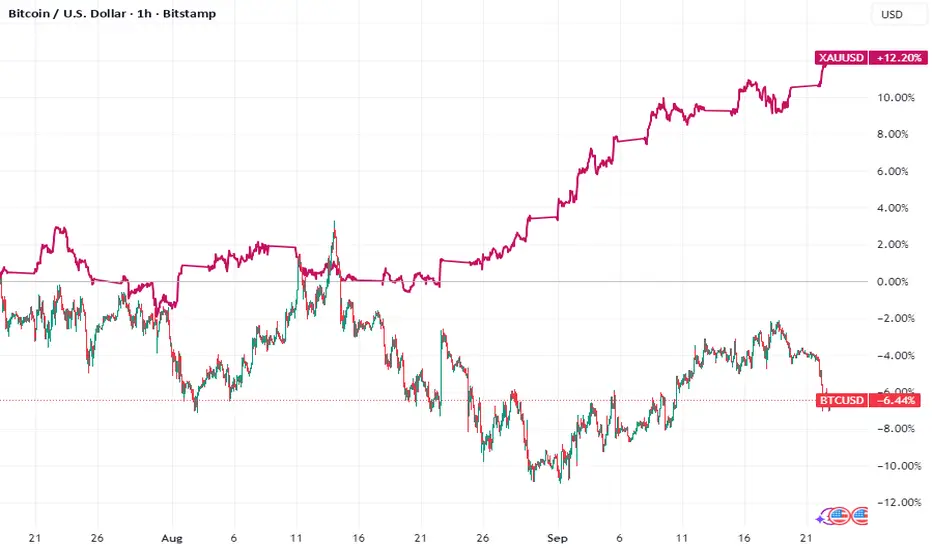
How Bitcoin Profits Are Fueling Gold's Record Surge
In the intricate dance of global markets, a subtle yet significant choreography unfolded, revealing a profound shift in investor sentiment. As Bitcoin, the volatile flag-bearer of the digital asset revolution, stumbled, a powerful wave of capital appeared to flow into a more ancient store of value. Roughly an hour after Bitcoin’s pronounced drop, gold, the timeless emblem of wealth and stability, surged to notch yet another record high. This sequence of events was more than a random fluctuation; it was a clear signal of a sophisticated market maneuver: a profit rotation from the speculative froth of cryptocurrency into the hard certainty of precious metals.
The divergence highlights a critical test of the "digital gold" narrative that has propelled Bitcoin for years. While safe-haven flows have traditionally sought refuge in bullion during times of uncertainty, the recent price action suggests a more complex, multi-layered dynamic is at play. Investors, having reaped substantial gains from the crypto market, appear to be de-risking and preserving those profits in an asset benefiting from its own powerful macroeconomic tailwinds. This "digital-to-physical shuffle" offers a compelling glimpse into the evolving relationship between these two assets and the strategic thinking of modern investors navigating a landscape of persistent inflation, geopolitical tension, and shifting monetary policy.
Anatomy of the Divergence: Why Bitcoin Stumbled While Gold Rallied
The recent price action did not occur in a vacuum. Bitcoin’s slide was a culmination of factors signaling potential "cycle exhaustion." The drop triggered a brutal leverage washout, with a massive volume of bullish crypto wagers liquidated, hitting smaller tokens particularly hard. This cascade of liquidations suggests that the recent rally was fueled by speculative excess, making it vulnerable to a sharp correction. The narrative of Bitcoin as a stable safe haven has been challenged, as its behavior mirrored that of a high-beta risk asset, sensitive to shifts in market liquidity and sentiment.
Conversely, gold's ascent to a record high is built on a much firmer, multifaceted foundation. The rally is powerfully supported by several key drivers. A primary driver is the aggressive and sustained accumulation by the world’s central banks. For several years running, official sector buying has reached historic levels, with institutions in emerging markets leading the charge to diversify their reserves away from the U.S. dollar and hedge against geopolitical risk. This sustained, large-scale demand creates a strong underlying price support that is independent of speculative flows.
Furthermore, expectations of monetary easing have further fueled gold's appeal. Lower interest rates decrease the opportunity cost of holding non-yielding bullion, making it more attractive to investors. With markets anticipating a cycle of rate cuts, the macroeconomic environment appears highly conducive to further gold upside. Finally, ongoing geopolitical conflicts and stubborn inflation have amplified demand for gold as the ultimate monetary insurance policy. Faced with currency devaluation risks and systemic uncertainty, both institutional and retail investors have flocked to the yellow metal, which has a multi-millennia track record as a reliable store of value. This confluence of factors has propelled gold's rally, leading many market observers to revise their forecasts upward.
The Rotation Thesis: Locking in Digital Profits in Physical Metal
The most compelling aspect of the market action was the timing. The roughly one-hour lag between Bitcoin’s significant drop and gold’s subsequent rally is a tell-tale sign of a deliberate capital rotation. This is not the instantaneous reaction of an algorithmic panic, but the considered move of traders and fund managers observing a trend, assessing the risk-off sentiment, and redeploying capital.
This is not the first time this pattern has emerged. In previous market cycles, steep liquidations in cryptocurrency futures have often been followed by noticeable inflows into gold-backed investment vehicles. The current scenario appears to be a larger, more pronounced version of this dynamic. Traders who have enjoyed Bitcoin's run-up are choosing to lock in those volatile, digital gains by moving them into a more stable asset that is itself in a powerful bull market.
This rotation challenges the simplistic notion that Bitcoin is a direct substitute for gold. While both are seen as hedges against fiat currency debasement, their behavior reveals different risk profiles. Bitcoin's recent performance confirms its status as a high-risk, high-reward asset, often correlated with speculative liquidity and risk appetite. Gold, meanwhile, is reasserting its traditional role as a core wealth preservation tool and a hedge against systemic risk, supported by the immense and steady buying pressure from the world's central banks. The market seems to be making a clear distinction: Bitcoin is for speculation; gold is for preservation.
Broader Implications: A New Dance for Modern Investors
The divergence between gold and Bitcoin carries significant implications for investors and asset allocators. It serves as a powerful reminder that despite the maturation of the crypto market, gold’s role in a diversified portfolio remains unique and irreplaceable. The "digital-to-physical shuffle" is a new market dynamic that investors must understand and navigate.
For institutional players, this rotation represents a sophisticated strategy to manage portfolio risk. After a period of high returns in a speculative asset, rebalancing into a stable asset with strong fundamentals is a prudent move. The rise of regulated investment vehicles for both gold and Bitcoin has made executing such cross-asset strategies more seamless than ever, suggesting this dynamic will become a more common feature of market corrections.
Looking ahead, the outlook for both assets remains complex. Some analysts believe Bitcoin's correction is a healthy cleansing of speculative excess before it continues its upward trajectory. Others argue that Bitcoin's volatility and regulatory hurdles continue to limit its appeal as a true safe haven compared to gold.
What is undeniable, however, is the structural bull case for gold. The powerful trend of de-dollarization and reserve diversification by central banks is not a cyclical fad but a long-term strategic shift. As nations continue to seek a neutral reserve asset to insulate themselves from geopolitical pressures and the weaponization of finance, gold is re-emerging as a tangible monetary anchor.
In conclusion, the recent market events were a masterclass in modern market dynamics. Bitcoin's stumble, met with gold's powerful rally, was not a sign of the crypto market's demise, but rather its integration into a more sophisticated global financial ecosystem. It revealed a class of investors capable of harvesting profits from high-risk digital ventures and strategically redeploying them into the time-tested security of precious metals. While Bitcoin continues its volatile journey toward maturity, the episode was a resounding affirmation of gold's enduring power. In a world of increasing uncertainty, the ancient allure of physical gold is not just holding its own—it is shining brighter than ever.
D
BTC 4H Analysis - Key Triggers Ahead | Day 45😃 Hey , how's it going ? Come over here — Winter got something for you!
⏰ We’re analyzing BTC on the 4-Hour timeframe.
👀 On the 4-hour timeframe, Bitcoin formed a lower low followed by a lower high and lost its key support around $115,115 at the start of the new week, pushing price further down. Currently, BTC is testing support at $112,500, and if this level breaks, it could move toward lower supports.
🧮 The RSI oscillator shows that BTC fell below the 40 level toward oversold territory, triggering significant selling pressure. Bitcoin is now attempting to stabilize above the 30 level. If it fails, further downward movement is likely.
🕯 Red candle sizes and volumes have surged sharply at the start of this week, generating considerable FOMO in the market. If a large candle forms, it is likely to be bearish. The key question: will buyers step in to defend Bitcoin at this level?
🧠 Focus on short positions; long positions are removed for now.
A break of the current support could trigger additional short opportunities.
Watch the RSI carefully: if it exits oversold in the higher timeframe, short positions can be opened with more confidence. RSI acts as a multi-timeframe indicator, helping indicate market direction.
❤️ Disclaimer : This analysis is purely based on my personal opinion and I only trade if the stated triggers are activated .

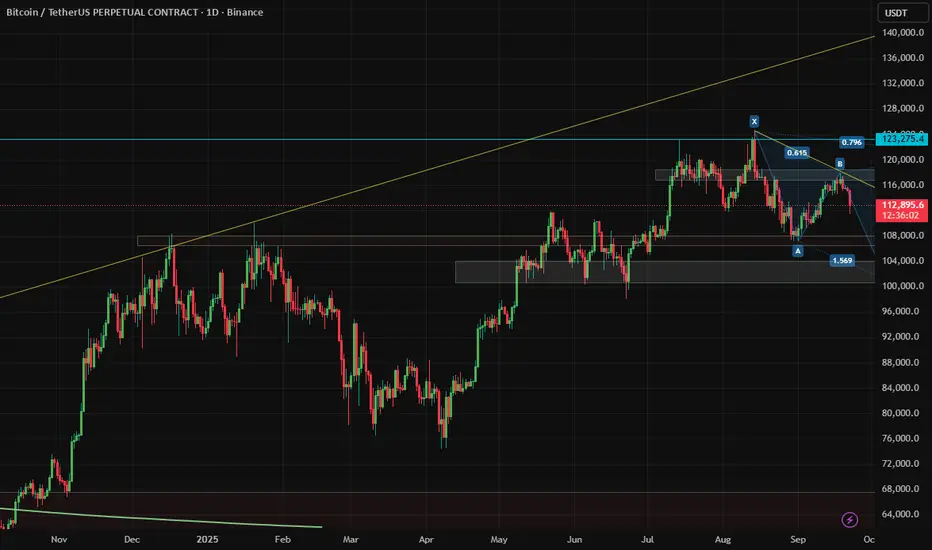
Short: BTC Liquidity SweepIdea: Short
Conviction Medium
Bitcoin rejected off its highs on the daily timeframe and is currently stalling from the golden pocket fib retracement level. There are many equal lows and a daily FVG gap below which I think could be a magnet for price. Entry condition is a sweep of last week's high, stop loss at the range high.TP targets are the equal lows and daily FVG shown on the chart.

BTCUSDT – 4H Harmonic pattern📉 BTCUSDT – 4H
Harmonic pattern reacting bearish from D.
Trendline break → upside losing strength.
🔺 Resistance: 115K–116K
🔻 Support: 111K–112K → 105K–107K
✅ Main view: correction extends to 105K–107K
⚠️ Only a strong break above 116K opens bullish continuation.
❌ Not financial advice.
Bitcoin BTC: Watching for Support and Accumulation📊 Bitcoin (BTC) has been pushing lower and is now appearing overextended to the downside. Recently, price has staged a deep correction that may be nearing exhaustion.
🔎 I’ll be watching closely to see if BTC can hold key support levels and potentially begin forming an accumulation base 🏗️.
📈 Should price confirm strength with a bullish break of market structure, that would signal a possible long opportunity 🚀. Until then, patience is required to let the setup fully develop.
⚠️ Disclaimer: This is educational analysis only and not financial advice. Always trade responsibly and manage risk carefully.

$BTC Crucial range!BTC attempted to break above the lower resistance zone and the descending channel, but failed to sustain momentum. ⚠️
📉 If rejection continues from this level, we could see a move towards the lower side of the channel, where multiple support zones await around:
$114,700
$112,000
$110,400
This will be a key area to watch for potential bounce setups or further breakdown confirmation.
🔎 Stay cautious — until BTC reclaims and holds above $116,700–117,300, downside pressure remains in control.
