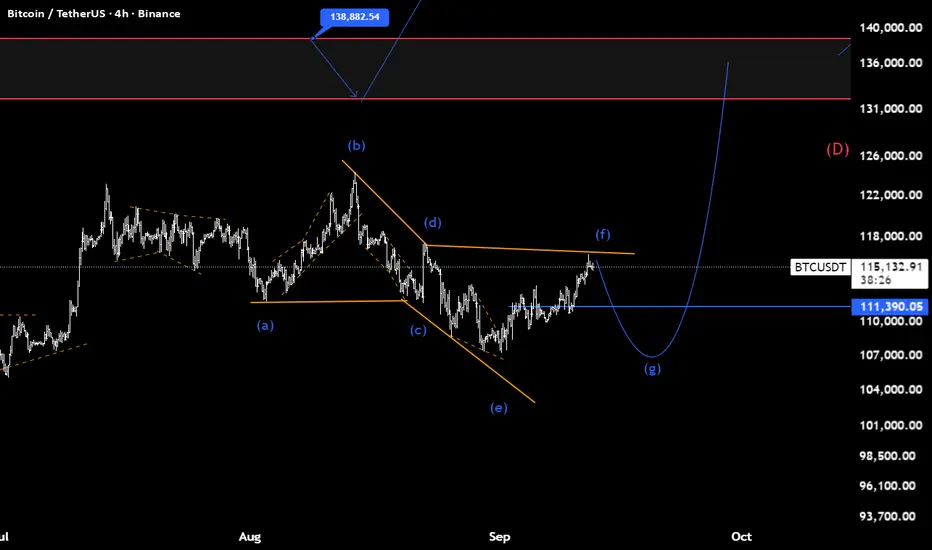
BTC(based on NEo wave)bitcoin is making a bow-tie diametric and finale wave is starting.
pay attention: do not buy bitcoin on this final correction,its a good time to buy altcoins like eth,doge,sol and others.
Btcusdanalysis
BITCOIN PREDICTION: NEXT MASSIVE MOVE TO HERE - INCOMING!!!!!!!Yello Paradisers! In this video, we have been going through multi-time frame analysis as professional traders using Elliott Wave Theory and other advanced technical indicators and analysis techniques.
On the ultra-high time frame, we have been going through the Elliott Wave price section since 2023. We have taken a look at the Moving Average Trendline Touch, which worked perfectly, the Channel Retest that is incoming, and the Bearish Divergence with Bearish Cross.
On medium and high timeframe charts, I have been sharing with you the completed zigzag and first wave. We are currently in the secondary wave, waiting for it to finish, along with resistances and bullish and bearish divergences.Together with that, there are shooting star patterns, and on a low timeframe, I have been sharing with you the triple top reclaim and the next possible resistances, and what the next resistance and target are from a multiple timeframe perspective.
Paradisers! Keep in mind to trade only with a proper professional trading strategy. Wait for confirmations. Play with tactics. This is the only way you can be long-term profitable.
Remember, don’t trade without confirmations. Wait for them before creating a trade. Be disciplined, patient, and emotionally controlled. Only trade the highest probability setups with the greatest risk to reward ratio. This will ensure that you become a long-term profitable professional trader.
Don't be a gambler. Don't try to get rich quick. Make sure that your trading is professionally based on proper strategies and trade tactics.

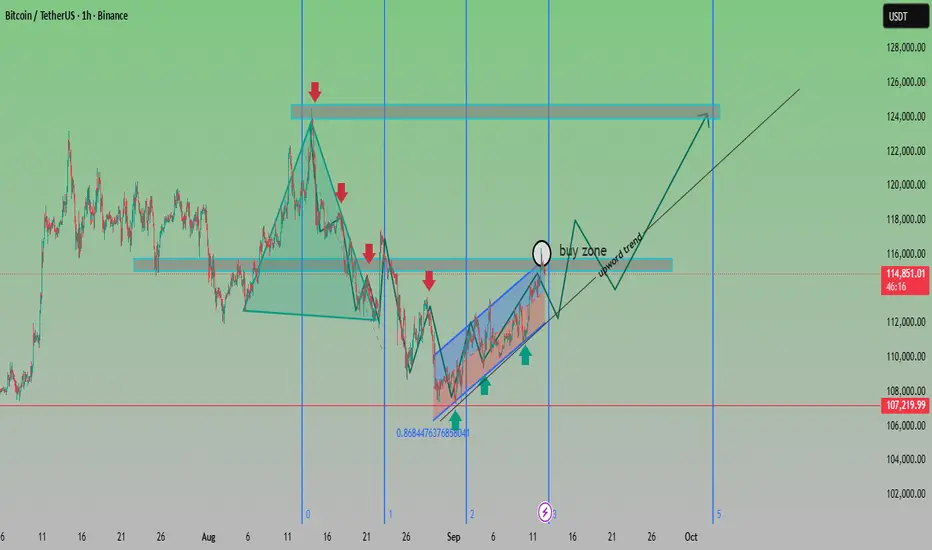
BTC Buy Zone Forming – Potential Bullish Breakout AheadAnalysis:
Trend Structure: After a corrective decline from the $124K resistance area, BTC has rebounded strongly, forming a rising channel (highlighted in blue).
Support Levels: Strong demand observed near $107,200, aligning with the 0.868 Fibonacci retracement, making it a crucial support zone.
Buy Zone: Chart highlights the $114K–$116K range as a buy zone before continuation of the upward trend.
Resistance Levels: Key resistance remains around $124K–$126K, which is the next major target if the bullish momentum sustains.
Outlook: As long as BTC stays above $114K support, the bias remains bullish, with a potential rally towards $120K–$124K. A breakdown below $112K would invalidate the bullish scenario.
✅ Bias: Bullish continuation
🎯 Targets: $120,000 → $124,000
🛑 Invalidation: Break below $112,000
Can Bitcoin still break through the highs?Today, Bitcoin's price has moved upward to test the key resistance level we mentioned earlier as expected, and this trend is fully in line with our previous strategic prediction of "exchanging time for space". Looking back at the previous market consolidation phase, we repeatedly emphasized that "there is no need to rush for short-term operations; let the bullets fly for a while" — this judgment was based on the understanding that the market needs time to accumulate momentum and wait for the trend to become clear. Now, as the price gradually reaches the target resistance level, the strategy of holding positions patiently in the early stage has reached a realization node. Currently, we can prioritize taking partial profits by closing some positions: this move not only locks in the considerable profits already obtained and avoids profit retracement caused by market pullbacks but also retains flexible space for subsequent operations.
From the perspective of subsequent market deduction, if the price is accompanied by significant volume expansionwhen testing the resistance level this time and successfully breaks through it, it indicates that the bullish momentum already has the energy to continuously drive the market. At this time, there is no need to rush to chase the rally; instead, we can wait for the price to retrace to confirm the validity of the breakout before following up to add positions and seize the new round of upward market. If the breakout fails to be supported by volume, we need to be alert to the risk of short-term pullback and maintain the existing positions for observation. In addition, we need to focus on the next resistance level above — around the 118,000 mark. This level is not only an important resistance zone formed by previous transactions but also highly correlated with market psychological expectations, and will become a core node for whether the subsequent market can further open up upward space.
If you lose your direction amid such market moves, you can follow me or leave me a message.

BTC/USDT Short Trade Setup📉 BTC/USDT Short Trade Setup 📉
🔹 Entry Price: $114,632
🔹 Targets:
TP1 → $113,900
TP2 → $113,250
TP3 → $112,400
🔹 Stop Loss (SL): $115,450
🔹 Leverage: 25x–50x (trade safe, don’t over-leverage)
📊 Analysis:
Bitcoin has hit a key resistance zone around $114,600–$114,800. Multiple rejections on the chart suggest a potential pullback is near. If the bearish momentum confirms, BTC could retrace toward the $112,400 support zone.
⚠️ Risk Management Tip: Always use SL to avoid liquidation. Remember, smart trading is about consistency, not chasing every move.
💬 What do you think — will BTC reject from here or surprise us with another breakout? Share your views below!
CRYPTOCAP:BTC
#BTC #Bitcoin #CryptoTrading #ShortTrade #TradingView #BinanceFutures

BTC/USDT: Bitcoin Surge to 118K?🚀 BINANCE:BTCUSDT is shaping up for a bullish move on the 4-hour chart , with an entry zone between 109000-110000 near a key support and rising trendline.
🎯 First target at 113500 marks initial resistance, second at 114500 , and a third at 118000 could signal a major breakout! 📈 Set a stop loss on a 4hours close below 107240 to manage risk.
🌟 A break above 110500 with strong volume could trigger this rally, driven by market sentiment and whale activity. Watch BTC dominance! 💡 Ready for this lift-off? Drop your take below! 👇
📝 Trade Plan:
✅ Entry Zone: 109,000 – 110,000 (support)
❌ Stop Loss: close below 107,240 to manage risk
🎯 Target 1: 113,500 (first resistance)
🎯 Target 2: 114,500 (secondary resistance)
🎯 Target 3: 118,000 (final target)

BTC Breaks out ! Classic breakout .
Let's see if we this breakout holds up or not.
We will watch this one closely....

Bitcoin Price Eyes Breakout as ETF Inflows Mirror ATH TrendBitcoin’s price is trading at $114,192 at the time of writing, facing resistance at $115,000. Sustained buying interest at this level will be crucial to trigger the next stage of upward movement.
If ETF inflows remain strong, BTC could flip $115,000 into support and rally toward $117,261 before targeting $120,000. This level would represent a critical milestone in Bitcoin’s ongoing bull cycle.
However, if the breakout attempt fails, Bitcoin may consolidate between $112,500 and $110,000. Such a pullback would invalidate the immediate bullish thesis but still keep BTC within its broader uptrend channel.

Bitcoin – Trend Update Ahead of PPIBitcoin – Trend Update Ahead of PPI
Hello Traders,
The current picture for Bitcoin is unfolding broadly in line with expectations, with the uptrend continuing to build momentum. Price movements are backed by solid volume, and the overall structure is developing as anticipated.
Key Levels
The price has cleared the 113k area, confirming that the bullish trend remains intact. This strengthens the probability of completing the final leg of the inverse head-and-shoulders pattern.
The next area to monitor is around 116k, where a modest reaction or short-term pullback could occur before the trend resumes towards the 121k region.
Close attention should be paid to the 117k level, as this represents the potential completion of the inverse head-and-shoulders structure. At this point, price may consolidate before establishing a fresh primary trend.
Trading View
For the moment, it remains important to follow the prevailing uptrend. Any shift in market structure will call for re-assessment, with updated strategies to be applied only once clear confirmation emerges.
This is my latest outlook on Bitcoin ahead of the PPI release. I trust this perspective will assist in shaping your trading approach.

$BTC Bounce Holds Strong: Eyes on $124.5K NextCRYPTOCAP:BTC is holding steady around $114,000 after bouncing right off the $111,600 support zone.
Buyers stepped in strongly at that level, showing they’re not ready to let the price drop further.
This green zone is acting as a solid base, and if BTC can continue to close above it, momentum is likely to shift back toward the upside.
The next key target sits near $124,500, which lines up with the last major swing high.
As long as we remain above $111,600, the market structure appears healthy, and bulls still hold the upper hand.
DYOR, NFA

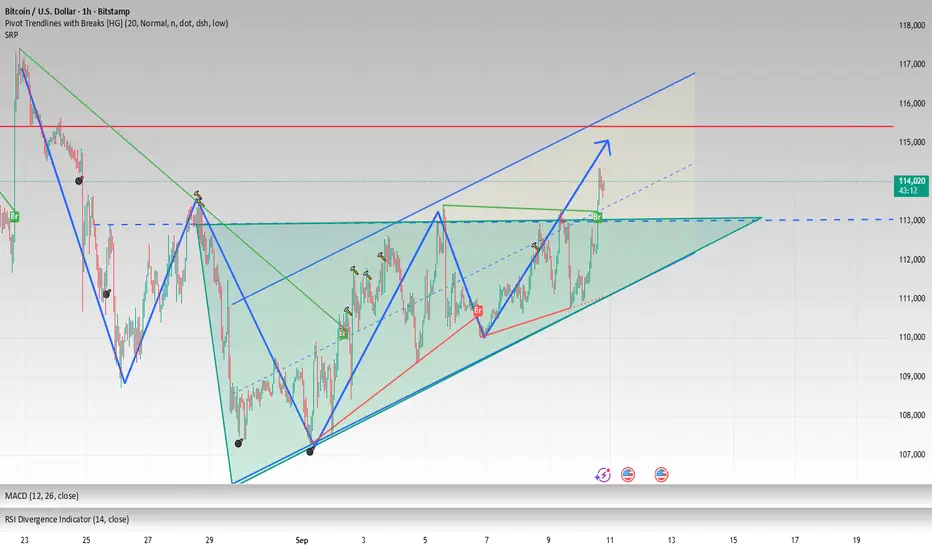
BTCUSD POSSIBLE BUY SETUP -----118K Break of Structure (BOS): Multiple bullish BOS indicate a trend reversal from bearish to bullish.
Change of Character (CHoCH): Confirmed trend shift early on.
Descending trendline broken: Signaling the end of bearish momentum.
Price broke above resistance (~$113,250): Now acting as a support zone (highlighted in green).
Current price: ~$114,272
Bullish target zone: Between $116,000 – $118,000, marked in maroon.

BTC Inverse Head and ShouldersThe chart clearly shows an inverse head and shoulders formation:
Left Shoulder: ~Aug 26 low.
Head: ~Aug 29 low.
Right Shoulder: ~Sep 5-7 low.
This is a bullish reversal pattern after a prolonged downtrend. The breakout above the neckline (around 113,200 – 113,500) confirms the bullish bias.
Fib & Extension Targets :
Immediate target: Fibonacci 1.0 extension ~119,600.
Extended target: 1.618 extension ~123,500.
These align well with previous resistance levels (early August highs).

Bitcoin rises as expected how to trade next?After Bitcoin broke upward out of the descending triangle consolidation zone this time, it did not repeat the "breakout followed by a pullback" trend seen in previous days. In the past, after the price broke through key patterns, it often fell rapidly and returned to the oscillating range; however, after this breakout, the price has remained firmly above the support level at the upper edge of the descending triangle, forming an effective breakout confirmation, and the market's bullish momentum has significantly strengthened compared to before.
For those who followed the strategy to establish long positions near the support level earlier, they have now gained a floating profit of 2,000 to 3,000 points, and the short-term profit target has been initially achieved. From the current technical perspective, the primary resistance level above is concentrated around the 115,000 mark. This level is not only an intensive resistance zone formed by previous transactions but also overlaps with the psychological expectation of integer levels, so a certain amount of selling pressure is likely to occur here. Therefore, it is recommended to consider taking partial profits by closing some positions near this level: on the one hand, it locks in the profits already obtained to avoid profit retracement caused by market pullbacks; on the other hand, retaining some core positions allows you to seize further upward space if the price breaks through the 115,000 resistance level later.
If there are key changes in the market later—such as a breakout of key levels, a significant change in trading volume, or an adjustment in the trend direction—I will update the strategy and notify everyone as soon as possible to ensure that the operation rhythm is synchronized with market changes and help everyone cope with market fluctuations more steadily.

BTC forms an ascending triangle, 113000 is just the beginningBITSTAMP:BTCUSD BTC saw a slight rise during the day. From the hourly and 4H charts, the MACD technical indicator formed a golden cross and broke through the upper short-term pressure of 113000. The short-term trend formed an ascending triangle. Bold and aggressive investors can rely on 113500-112000 to go long, with the target looking at 115500-116500.
Bitcoin Warming Up- Like always, everything in the graphic to simplifies the information, stay simple is better.
- Bitcoin is known for its extreme price volatility, which can lead to major fluctuations, such as a significant crash in value followed by a rapid doubling of its price in a very short period, for that simple reason i avoid to predict low timeframe moves.
- Now check the hidden bullish divergence, check the level of BBW, the volality could be low, but TheKing could be ready to make parabolic move soon or later.
- I do my best to try to post at the good time for medium long term investment.
- Don't forget that 125,000$ is far to be enough.
Happy Tr4Ding !

BTC Inverse Head and ShouldersThe chart clearly shows an inverse head and shoulders formation:
Left Shoulder: ~Aug 25 low.
Head: ~Aug 29 low.
Right Shoulder: ~Sep 5-7 low.
This is a bullish reversal pattern after a prolonged downtrend. The breakout above the neckline (around 113,200 – 113,500) confirms the bullish bias.
Fib & Extension Targets :
Immediate target: Fibonacci 1.0 extension ~119,600.
Extended target: 1.618 extension ~123,500.
These align well with previous resistance levels (early August highs).

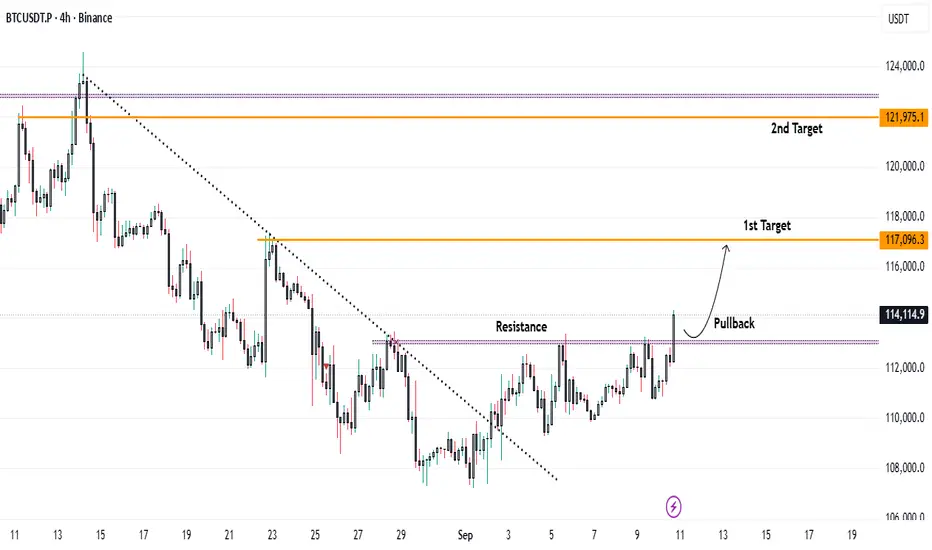
Bitcoin Breaks Key Resistance – Upside Targets in Focus...Bitcoin has been consolidating below the $113,000 resistance level over the past few sessions. On the hourly timeframe, price has now successfully broken above this barrier and is sustaining the breakout.
📈 Trading Outlook:
* A pullback towards $113,000 could offer a favorable long entry opportunity.
* Upside Targets:
* First target: $117,000
* Second target: $122,000
The breakout and successful close above resistance suggest strong bullish momentum, provided price holds above the $113,000 zone.
BITCOIN PREDICTION: IS USA MANIPULATING THE MARKET?! (big move) Yello Paradisers! We have been taking a look at what's going on with the new data release from USA. We have been taking a look at the CME futures gap. We have been taking a look at the multi-timeframe analysis on the ultra-high timeframe chart. We have been going through the moving average touch channel possible reclaim and the Elliott Wave Theory on multiple timeframes. I've shared with you where, with the highest probability, the next move will happen and what kind of confirmations we are waiting for.
Paradisers! Keep in mind to trade only with a proper professional trading strategy. Wait for confirmations. Play with tactics. This is the only way you can be long-term profitable.
Remember, don’t trade without confirmations. Wait for them before creating a trade. Be disciplined, patient, and emotionally controlled. Only trade the highest probability setups with the greatest risk to reward ratio. This will ensure that you become a long-term profitable professional trader.
Don't be a gambler. Don't try to get rich quick. Make sure that your trading is professionally based on proper strategies and trade tactics.

Who's ready to lose money (again) on BTC?The ups and downs are becoming just to obvious at this point. BTC struggling to make substantial progress on the price moves now that major whales have moved on due to buying at the TOP. What could go wrong? Diminishing YoY returns, high transaction cost, doesn't solve any real problems, and ultra high volatility. Historically, we are due very soon for a major correction and BTC will very likely come down substantially (next support levels before 100k is around 70k). Not anti-tech or BTC! Just calling out technicals, fundamentals, and historical behavior with tulip-type of hype and have seen many many people lose money from BTC and digital assets (remember NFTs, FTX, Trump's coin that was rugged etc...). Proceed with caution, if you're up on BTC, just sell and park for a breather. There is no escaping macro trends and a big one is coming. We are not at levels not seen since the dot.com bubble, and this one will be harder.

Another upside breakout—can this rally continue?Bitcoin has broken upward again. However, for those who haven't entered the market yet, there's no need to rush into chasing the rally. Looking back at the characteristics of recent market trends, after the price made multiple breakout moves, it has been difficult to sustain the upward momentum, often followed by a rapid pullback. Blindly chasing high prices can easily leave you in a passive situation of being trapped in the short term.
As for those who have already established long positions near key support levels in line with the previous strategy, there's no need to adjust your positions frequently at present—just continue to hold firmly. From a technical perspective, if this breakout can effectively hold above the key resistance level, the subsequent upside potential of the market will be far beyond the current minor fluctuations. The short-term consolidation is more like a period of momentum accumulation before the trend begins. It is recommended that everyone stay patient, hold onto your positions well, and give the market sufficient time to develop—"let the bullets fly for a while."
I'm Matthew, an analyst focused on technical analysis. If you have any questions regarding specific operations or trend judgments, feel free to communicate and discuss with me at any time. Let's learn trading logic together and move forward steadily in the market!

Bitcoin BTC is at a Critical Level: Equal Highs Trade Plan💰 Bitcoin (BTC) Update 💰
BTC is currently trending upward 🟢📈 on the 30M timeframe ⏰ and has reached a critical level ⚖️. We’re seeing a shift in structure 🔄, but there are equal highs forming 📍, leaving the question: will price break higher and continue bullish 🚀, or reject and move lower 🔽?
📊 My trade plan is simple:
✅ Wait for a break above the current range/equal highs 📈
✅ Look for a retrace + retest 🔄
✅ Enter long on confirmation 🎯
If this setup fails to play out, then the idea is invalidated ❌ and we stand aside.
⚠️ This analysis is for educational purposes only and not financial advice. 📚

A flat trend; continue with the previous strategy. Recently, the Bitcoin market has generally been trapped in a range-bound consolidation pattern, with trading activity remaining persistently low. The price has mainly fluctuated repeatedly within the narrow range of 110,000 to 113,000, failing to achieve an effective directional breakout. From the perspective of market performance, the occasional small-scale breakout moves seen earlier have all failed to sustain the trend; instead, the price quickly reverted to within the range. The competition between bulls and bears within this range has shown a temporary state of balance, and the market lacks clear driving forces to break the current deadlock.
Fortunately, however, in response to the current oscillating market, the long-position entry points we supplemented and advised on later are quite ideal. Based on this, there is no need to adjust positions at present, and we can simply continue holding. At the strategic level, we still adhere to the previous core idea of "exchanging time for space" — we will not rush to pursue profits from short-term fluctuations. Instead, through patient position-holding, we will wait for the market to complete sufficient consolidation within the range and for the balance between bulls and bears to be broken. Only then will a clear trending breakout occur, allowing us to further seize greater profit opportunities.

Bitcoin – Current Trend UpdateBitcoin – Current Trend Update
Good day Traders,
Bitcoin continues to respect the structure of an inverse head-and-shoulders formation, which remains intact at this stage. Following a test of the 113.5k region, price once again reacted lower – this marks the third rejection from this level, highlighting its importance as a pivotal zone. For the bullish momentum to extend and complete the final wave of the formation, this resistance must eventually be overcome.
Scenarios to Monitor
Bullish Scenario: The upward bias remains valid while price holds above 109k. In this context, long positions remain the preferred approach.
Bearish Scenario: Should price sustain a break beneath 109k, the bullish case would be invalidated and a bearish outlook activated. Confirmation will be required before considering such positions.
Short-Term Dynamics
On the intraday timeframes, BTC is trading within a sideways channel. For short-term participants, range-based strategies such as buying near support and selling into resistance may remain effective until a decisive breakout occurs.
Market Context
At present, broader market attention is focused more heavily on gold rather than Bitcoin. As a result, BTC may continue to consolidate within a narrower range, requiring traders to temper expectations for immediate volatility.
This represents my current outlook for Bitcoin. Traders are encouraged to use this as a reference and compare it with their own perspectives.
