BTC 2026 Outlook - Roadmap Speculation to $300KHello BTC Watchers.
Let's talk about BTC in the Logarithmic view.
I mapped out the date-ranges, as well as how far the price fell logarithmically after each top. You'll see the word "lines" on the chart. This simply indicates the amount of diagonal trendlines it has fallen. By using this pattern-dedicated approach, a commonality is found which may be useful in speculating a future price. Because if not for past history, how else would we speculate on the future?
It's interesting to note that the past 3 ATH's (all time high's) are each lower than the previous if you compare it not to price but to the "lines". Even the fifth high (the one coming next) will be on a lower click-line than the previous, and that estimate is already over 300k. This is a really helpful way to speculate a future high because usually on a regular-view chart, the zone above the ATH is uncharted territory. You could use a Fibonacci trend-based extension, but this is limited to the cycle that you're using for input points. Logarithmic chart + indicators factor in the entire history of the price.
This would mean the new peak could be in 2026 around USD 300k.
It's important to note that this ay not be a straight line up. As you'll see, although the price has been increasing exponentially, there have been periods of hard pullbacks or corrections. These are great times to enter the market, NOT when the price is close to the peak of the curve (in green).
So could it be that this is just another dip in the road towards a new ATH - despite the recent market liquidation?
Btcusdanalysis

DeGRAM | BTCUSD will test the $80k level📊 Technical Analysis
● BTC is retesting the multi-month support zone near 80K, aligning with the long-term ascending base and the lower boundary of the falling trend, creating conditions for a medium-term rebound.
● A break above the descending resistance line could trigger recovery toward 92K as the structure shows exhaustion of bearish momentum.
💡 Fundamental Analysis
● Recent ETF inflows and easing macro pressure from U.S. yields support accumulation near major support zones.
✨ Summary
● Bullish bias from 80K support. Targets: 88K → 92K. Key support: 80K.
-------------------
Share your opinion in the comments and support the idea with a like. Thanks for your support!

DeGRAM | BTCUSD will rebound to $92k level📊 Technical Analysis
● BTC/USD formed a false break below the 82K support zone while bouncing off the long-term dynamic support line, signalling seller exhaustion and a potential mid-trend reversal.
● Price is reclaiming structure inside the descending channel; a push toward 90–92K becomes likely if buyers break the local diagonal resistance.
💡 Fundamental Analysis
● Bitcoin sentiment improves as risk appetite stabilizes and institutional inflows show signs of recovery.
✨ Summary
Support: 82K. Targets: 90K → 92K. Medium-term bullish bias while above dynamic support.
-------------------
Share your opinion in the comments and support the idea with a like. Thanks for your support!

DeGRAM | BTCUSD continues to decline below $85k📊 Technical Analysis
● BTC/USD continues to move within a broad descending channel, rejecting the dynamic resistance line multiple times and forming lower highs.
● Price is failing to reclaim the 88–90K resistance zone, and the structure points toward a continuation lower into the 82–80K support region as momentum weakens.
💡 Fundamental Analysis
● Bitcoin remains under pressure as risk sentiment cools and ETF inflows slow, with stronger USD liquidity weighing on crypto.
✨ Summary
Resistance: 88–90K. Targets: 82K → 80K. Medium-term bearish bias while below channel resistance.
-------------------
Share your opinion in the comments and support the idea with a like. Thanks for your support!

A+++ Setup That Completed My Prop Firm Challenge
(Structure · Precision · Patience · Faith)
This trade wasn’t luck.
It wasn’t guessing.
It wasn’t hope.
It was pure structure, multi-timeframe alignment, perfect execution, and flawless risk management—and it ended up completing my Prop Firm Challenge.
Here’s the full story, exactly how the setup unfolded from the first signal all the way to final execution.
⸻
📌 Higher-Timeframe Context: The Bearish Top Was Already Set
Everything began with the 4H BOS around 93,900, which officially broke structure and created the macro bearish environment.
Then price formed a clear 4H Lower Low at 89,000, confirming the downtrend.
But the real clue came next:
👉 Price aggressively pulled back to 92,900–93,000, retesting the old 4H BOS zone
👉 Then failed to reclaim it
👉 Entered a tight range directly underneath the level
👉 Volume dropped
👉 Candle bodies got smaller
👉 Wick pressure increased
That’s redistribution—not accumulation.
I knew sellers were loading.
⸻
📌 LTF Alignment Begins: The Dominoes Fall One by One
Once I had the HTF context, I waited for LTF confirmation.
1️⃣ 1M BOS below 92,900
Signaled the first crack in the bullish micro-flow.
2️⃣ 5M Displacement + BOS
Not noise — real intent.
Selling pressure was confirmed.
3️⃣ 15M Market Structure Shift (MSS)
This was the decisive moment.
The bullish internal structure broke.
Momentum flipped.
The range under 92,900 was officially a distribution block.
4️⃣ 30M & 1H candle closes below 92,880
This erased any bullish reclaim attempt.
HTF + MTF now perfectly aligned.
At that point, the short wasn’t a prediction — it was a requirement.
⸻
📌 The Entry: Precision at the Retest
I placed my short on the retest of 92,900, right into the ceiling of the redistribution.
Entry: 93,055
Stop Loss: 93,943
Target: 90,955 (MTF sell-side liquidity)
⸻
📌 Risk Management That Passed the Challenge
I didn’t gamble.
I executed professionally:
✔️ 33.33% partial at 92,000 → +$96.75
✔️ SL moved to 93,210 → protected profits
✔️ 33.33% partial planned at 91,050 (SSL target)
✔️ 33.33% runner for extended continuation
When FTMO notified that I had completed the challenge, I closed the entire position at 91,950.
Clean. Controlled. Disciplined.
⸻
📌 Outcome: Challenge Completed by Structure Alone
No indicators.
No fundamentals.
No emotions.
No guesswork.
Just:
• 4H BOS
• LTF MSS
• Displacement
• Retest
• Liquidity targets
• Risk management
• And unshakable patience
My trade went from A+ to A+++ the moment all timeframes aligned perfectly.
This is the kind of setup you wait for — not the kind you chase.
⸻
📌 Final Words
I’m extremely grateful —
to God first,
to the journey second,
and to the discipline that carried me through.
If this breakdown gave you clarity and shows you how powerful clean structure can be…
👇
Leave a like, drop a comment, share it, and hit Follow.
Your support motivates me to keep bringing high-level breakdowns to the community.
more legendary setups to come.
COINBASE:BTCUSD OANDA:XAUUSD OANDA:EURUSD

DeGRAM | BTCUSD is testing the $90k level📊 Technical Analysis
● BTC/USD is testing a major support cluster near 88–90K, where price aligns with the long-term dynamic support line formed from previous triangle and flag breakdowns.
● The new rejection wick at support and the descending channel structure suggest a potential medium-term rebound toward 95–97K if buyers defend this level.
💡 Fundamental Analysis
● Bitcoin sentiment stabilizes as ETF inflows resume and risk assets recover after easing US inflation expectations.
✨ Summary
Support: 88–90K. Rebound potential: 95–97K. Medium-term bullish scenario valid while holding the dynamic support.
-------------------
Share your opinion in the comments and support the idea with a like. Thanks for your support!

Bitcoin trading idea 15-minute time frameHi traders
While Bitcoin has seen its liquidity targets (see the link below), we have reached the 4-hour support area in the lower time frame and we will have a few conditions to continue the path:
First, the 15-minute candle must stabilize within the specified support range, ultimately above the buyers' equilibrium level, i.e. 96.633. In this case, the pullback will have a buying position at this equilibrium level and then if it can see a 15-minute consolidation above 97.633, it will be a confirmation for the continuation of the rise for the high liquidity targets specified in the 4-hour chart.
Main chart link:

Bitcoin 4-hour updateHi traders
As expected, the market has collected all the liquidity areas drawn on the chart a few weeks ago and has entered the desired support area. So far, if you had followed my analysis, you would have made a profit of over $17,000, and of course, friends who followed along made good profits.
There are a few conditions to continue the path, which we will examine in the next post on the lower time frame.
Link to the main charts:

DeGRAM | BTCUSD BTCUSD is aiming to reach a key support level.📊 Technical Analysis
● BTC is approaching a major confluence zone where the long-term support line meets the key demand area near 94k–92k. This level previously triggered strong reversals.
● Price remains inside a broad falling structure, and a bounce from the lower boundary would confirm trend exhaustion and open room for recovery toward 102k–108k.
💡 Fundamental Analysis
● FXStreet reports renewed inflows into BTC ETPs and improving risk sentiment as markets expect milder Fed policy, supporting medium-term bullish pressure.
✨ Summary
BTC nearing 94k–92k demand; bounce may target 102k–108k. Key support: 92k. Break above falling trend = continuation.
-------------------
Share your opinion in the comments and support the idea with a like. Thanks for your support!

Bitcoin: Liquidity CycleTypical liquidity cycle is 5-6 years long (65m). Buy bitcoin before an upswing (or end of QT) and sell when liquidity tightens. Macro is the best way to analyze markets?
Adjust your stakes based on position of the cycle.
Markets can have risk-on, risk-off episodes. Where Bitcoin is a risk-on asset.
Use 10Y-02Y for guidance.

BTC/USD: Testing Key Support (M/FVG) After Strong DowntrendKey Observations
Downtrend: The price has been moving lower, defined by the downward-sloping black trendline, indicating a period of bearish momentum.
Break of Structure (BOS): A "BOS" (Break of Structure) label is placed below a recent low, confirming the continuation of the bearish structure as the price moved lower.
Current Support Zone: The price is currently testing a significant support zone (the grey rectangular box) around the $96,000 - $98,500 area. This level appears to be a historical reaction zone.
Market Structure/Fair Value Gap (M/FVG): The support zone is also labeled as "M / FVG" (Likely Mitigation or Market Structure combined with a Fair Value Gap), suggesting this area holds significance for potential institutional/smart-money activity.
Future Scenarios (Projected Paths):
Scenario 1 (Black Arrow): The main projected path shows a potential bounce/reversal from the current support zone, aiming to push the price higher. This suggests a buy/long opportunity might be imminent if the support holds.
Scenario 2 (Curved Arrow): The alternative (and often less-likely, as it's secondary) projection suggests a continuation of the downtrend after a potential minor bounce or consolidation, indicating a break below the support zone and further declines.

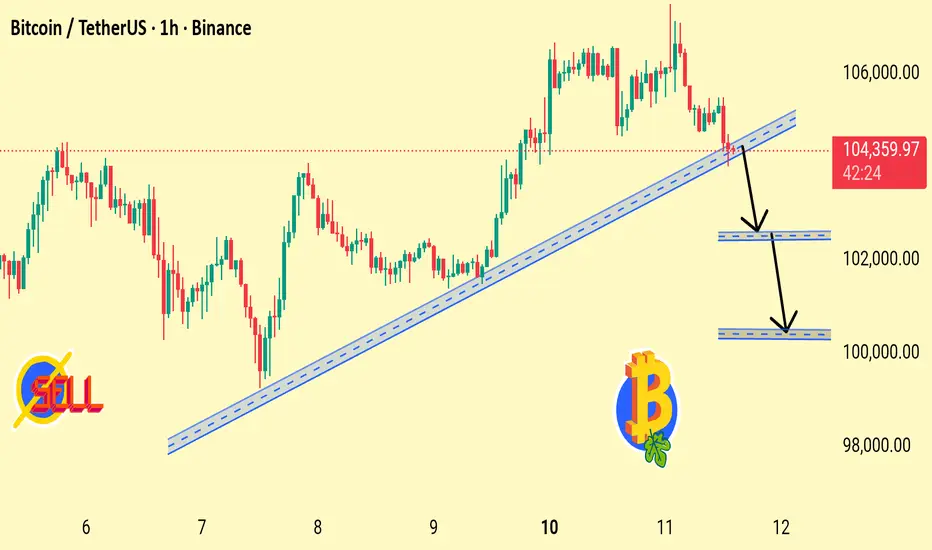
Bitcoin Losing Trendline Support Possible Drop Toward Key DemandBTC has broken below the rising trendline, signaling weakening bullish momentum. Price may retest $102,500 and potentially dip toward the $100,000 support zone if sellers continue to dominate.
1. Trendline Break Detected
BTC has fallen below the rising trendline that supported the uptrend from Nov 7–11. This signals weakening bullish structure.
2. Momentum Turning Bearish
The rejection near 105,000 and sharp drop indicate sellers are stepping in aggressively.
3. First Support Zone: $102,500
Chart shows the first demand zone here. If BTC stabilizes above this level, a bounce is possible — but weakness still remains.
4. Second Support Zone: $100,000
A deeper drop could test the psychological round number. Strong liquidity is expected at this level.
5. Trend Structure Changing
Breaking the trendline + lower highs = possible shift from bullish to short-term bearish trend.
DeGRAM | BTCUSD will rebound from the $100k level📊 Technical Analysis
● Bitcoin is trading above the long-term support zone near $100 K, where a double-bottom formation took shape, suggesting base formation ahead of a potential breakout.
● The market approaches a descending resistance line around $106 K–$108 K, with recent upside momentum hinting at a retest of this resistance while preserving the higher-low structure.
💡 Fundamental Analysis
● Bitcoin’s bullish case is reinforced by renewed institutional accumulation and broader digital-asset adoption, while improving macro risk sentiment lessens safe-haven crowding.
✨ Summary
• Support: ~$100 K region
• Resistance: ~$106 K–$108 K
• Bias: Long above support with breakout potential toward ~$110 K on momentum and accumulation signals.
-------------------
Share your opinion in the comments and support the idea with a like. Thanks for your support!

DeGRAM | BTCUSD will test the $101k level📊 Technical Analysis
● BTC/USD is approaching a key confluence of descending resistance lines after rebounding from the $101,000 support area. This level aligns with the broader resistance channel that has capped price since mid-September.
● Despite recent recovery attempts, the structure remains bearish, with lower highs signaling that sellers may regain control near $107,000–$108,000, potentially driving a retest of $101,000.
💡 Fundamental Analysis
● Bitcoin faces pressure from stronger U.S. economic data and rising Treasury yields, reducing appetite for risk assets in the near term.
✨ Summary
● Resistance: $108,000. Support: $101,000. Rejection at resistance could trigger a correction toward $98,000–$101,000.
-------------------
Share your opinion in the comments and support the idea with a like. Thanks for your support!

Bitcoin Update Time Frame 4 Hours
Hi Traders
Bitcoin Update Time Frame 4 Hours So far, according to the analysis, we have had losses and profits above $12,000, and as expected, three of the four liquidity levels we are considering have been hunted, and only the liquidity level of 98,000 remains, which, with the hunt of this fourth level at the support of 94,000 to 96,000 (more precise number on the chart), was looking for a trigger buy for high liquidity. I hope you are also in profit
Analysis link:
Bitcoin | Long | 3 Hrs This technical analysis is for informational and educational purposes only. It does not constitute financial advice. Remember to always research and consult with a professional before making investment decisions. Good luck! 📈💼🚀

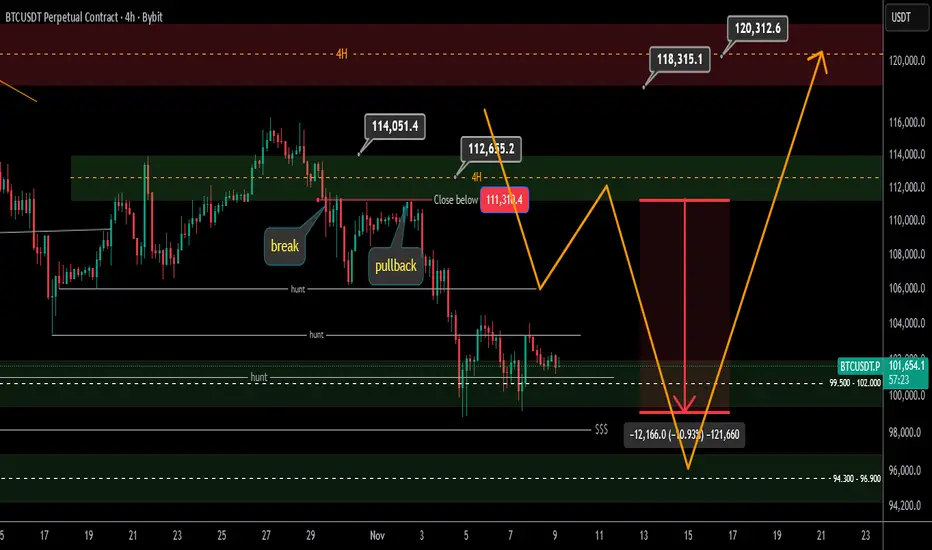
BTC/USD Monthly Forecast: Targeting $128K After FVG MitigationKey Observations:
Current Price Action: The price has seen a significant pullback over the last month(s) after a strong bullish run.
Support/Demand Zone: The price is currently approaching a critical shaded green zone labeled "M / FVG" (Likely standing for Mitigation Block / Fair Value Gap). This zone, roughly between $95,000 and $97,500, is anticipated to act as a strong support or demand area where buyers are expected to step in.
Bullish Structure: The prior price action showed a "BOS" (Break of Structure) to the upside, indicating that the overall market structure remains bullish on this higher timeframe.
Liquidity Targets ($$$$ $):
The first major target above is indicated as a liquidity pool ($$$$ $) around $110,000 - $112,000.
The ultimate higher target is another, more significant liquidity pool ($$$$ $) around $126,000 - $128,000.
Projected Path: The dotted line illustrates a potential bullish scenario:
A final drop into the M / FVG demand zone for mitigation/re-accumulation.
A strong reversal and rally toward the first liquidity target (approx. $112,000).
A potential continuation to the higher liquidity target (approx. $128,000).

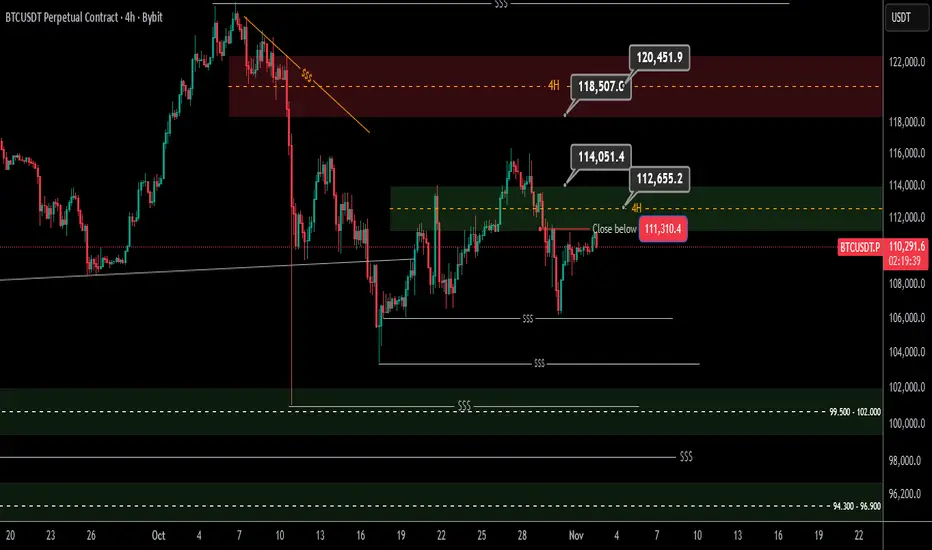
DeGRAM | BTCUSD is continuing to correct📊 Technical Analysis
● BTC/USD is testing the main support trendline of a long-term ascending structure. A confirmed close below this level could trigger a decline toward the $100,000–$97,000 zone.
● The price has repeatedly rejected from the descending resistance channel, showing weakening bullish momentum and confirming potential continuation of the correction phase.
💡 Fundamental Analysis
● Bitcoin faces pressure as risk sentiment cools following Fed comments about higher-for-longer rates and slowing institutional inflows.
✨ Summary
● Short bias below $107K; targets $100K–$97K. Breakdown confirmation may extend medium-term bearish movement.
-------------------
Share your opinion in the comments and support the idea with a like. Thanks for your support!

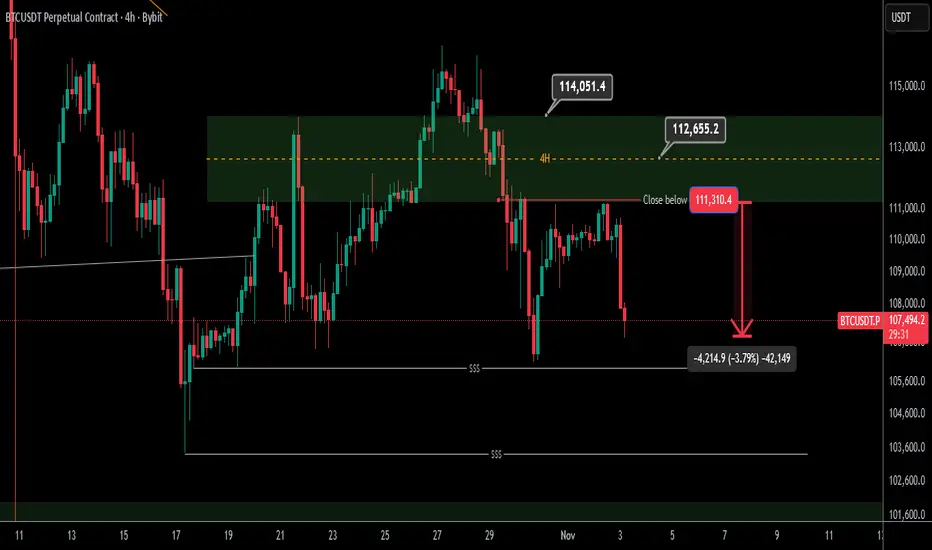
DeGRAM | BTCUSD returned to the $111k level📊 Technical Analysis
● BTC/USD has rejected the dynamic resistance line near 114,000, confirming continuation of the descending structure visible since mid-October.
● A breakdown below 111,000 could accelerate losses toward the 106,000–105,000 dynamic support zone, completing a corrective leg within the broader channel.
💡 Fundamental Analysis
● Bitcoin faces pressure from hawkish Fed expectations and reduced ETF inflows, while profit-taking among large holders weighs on sentiment.
✨ Summary
● Short bias below 114,000; target 106,000–105,000. Technical rejection and macro tightening support bearish continuation.
-------------------
Share your opinion in the comments and support the idea with a like. Thanks for your support!

BTCUSD — Pre-London Session 🧭 Context
Heavy dollar buying is underway and the crypto market appears ready to exit its range-bound phase.
We’ve tagged the daily volume low at 106 463.30, a key structural mark, and next clear target under the weekly range is around 100 996, representing engineered liquidity.
Price could rotate to that zone today or tomorrow given the alignment of flows.
📈 Technical POV
We’ve never yet shifted price decisively higher — the recent range bounce failed to ignite momentum.
My hope was for range-bound expansion, but the market is telling a different story: adapt.
If price holds above the 106 463.30 node, bullish leg remains plausible, but if it closes below, acceleration to the 100 996 liquidity target is on the table.
🌍 Macro View
Crypto is under pressure as global capital rotates toward the dollar.
A stronger US Dollar Index (DXY) tends to suppress Bitcoin, since investors pull risk assets when the dollar climbs. Meanwhile, institutional flows into Bitcoin are mixed — despite headline ETF inflows, the macro drag of dollar strength and leveraged crypto exposure is creating headwinds.
tradingnews.com
🎯 Plan
Look for bull-back opportunities into the 106 463.30 node if price retests and holds.
But note the risk-to-reward is skewed: a break below invites faster movement toward 100 996.
Stay ready for a 1-hour structure shift to identify bias.
🧠 CORE5 Note
The market doesn’t wait for your opinion — it demands alignment.
Stay responsive. Stay disciplined.
— CORE5DAN
Institutional Logic. Modern Technology. Real Freedom.

4-hour Bitcoin Analysis Update
Hello Traders
So far, the 4-hour timeframe has dropped and gained about $4,000 from the first announced resistance, and if it returns, the second resistance level of 112 is still clear on the chart, and the previous analysis remains valid
Analysis link:
Bitcoin Trend Analysis Time Frame 4 Hours
Hello Traders
Update of Bitcoin 4-hour analysis, which I will post below
According to the description of the relevant post, in 4 hours the price was able to stabilize below 111,000 and its first pullback reached this level and made a significant profit, and in the second time it is pulling back to the same level of 111,000, and the resistance of 112,000 is also important. I expect the correction to continue to low liquidity areas.
Link to previous post:
BITCOIN HIGH PROBABILITY SETUP SOON!!!🚨 BTC HIGH PROBABILITY SELL/BUY SETUPS 🚨
* Here We Can See Clearly The Next Potential Moves For BTCUSD Coming Hours/Days.
* Keep Your Eyes Close On Your Trading Positions.
* Happy PIP Hunting Traders.
FXKILLA.
