Btcusdanalysis

BTC Short Trade Setup – Bearish Momentum
🎯 **BTC Short Trade Setup – Bearish Momentum**
📌 **Instrument:** BTC
📉 **Direction:** SHORT
💰 **Entry Price:** \$115,200
🛑 **Stop Loss:** \$116,500
🏹 **Take Profit:** \$111,500
📏 **Position Size:** \$5M (1% of \$500M account)
💪 **Confidence:** 65%
⏰ **Timing:** Enter at market open
⚠️ **Key Risks:**
* Market volatility can trigger rapid moves.
* Breakout above \$116,500 invalidates setup.
* Macro correlations may amplify risk.
✅ **Rationale:**
* Lower highs & lower lows = bearish momentum
* Price below key MAs, weakening bullish conviction
* Technical indicators support short entry
🔥 **TradingView / Social Tags:**
\#Bitcoin #BTCShort #CryptoTrading #CryptoAnalysis #FuturesTrading #TechnicalAnalysis #TradingSignals #RiskManagement #MarketAnalysis #CryptoAlerts #HighConvictionTrade #BearishSetup #PriceAction #TradingStrategy #CryptoMarket

Bottom-building stage, waiting for riseYesterday, Bitcoin experienced a minor rebound after testing the support level near $112,000. However, during the early trading session, it fluctuated and declined, erasing yesterday's gains. As shown on the hourly chart, the $112,000 level has proven to be a strong support, having withstood three tests under pressure. Currently, Bitcoin is in a consolidation phase, and once this phase is completed, we can expect a significant upward movement. For those who are bullish on Bitcoin, it is recommended to consider entering long positions around $113,000, with a stop-loss set near $112,000.

Bitcoin – Silence at the 0.618, Fate Awaits Beyond the Citadel.⊣
⟁ BTC/USD - BINANCE - (CHART: 1D) - (Aug 21, 2025).
◇ Analysis Price: $113,851.76.
⊣
⨀ I. Temporal Axis - Strategic Interval - (1D):
▦ EMA9 - $115,774.47:
∴ Price currently trades below EMA9, confirming short-term bearish control;
∴ Recent candles show rejection at EMA9 with no sustained recovery;
∴ EMA9 is now acting as immediate dynamic resistance.
✴️ Conclusion: Short-term bias remains bearish.
⊢
▦ EMA21 - $116,406.15:
∴ EMA21 overlaps with Bollinger midline, reinforcing resistance;
∴ Market has repeatedly failed to reclaim this level;
∴ Confirms mid-range structural weakness.
✴️ Conclusion: EMA21 = critical rejection zone.
⊢
▦ EMA50 - $114,864.59:
∴ Price hovering around this level in confluence with Fib 0.618;
∴ Sustained breakdown may unlock deeper retracements;
∴ Acts as battlefield between bulls and bears.
✴️ Conclusion: EMA50 = structural pivot under pressure.
⊢
▦ EMA200 - $103,250.81:
∴ Long-term trend support, still untouched;
∴ Represents final defense line for macro-bullish structure;
∴ Bears will target it if Fib 0.5 and 0.382 fail.
✴️ Conclusion: EMA200 = macro fortress below.
⊢
▦ Bollinger Bands (21, 2, base EMA9) - $121,471.73 / $116,406.15 / $111,340.57:
∴ Price moving towards lower band after rejection at midline;
∴ Bands widening, signaling volatility expansion;
∴ Downward trajectory consistent with bearish volatility regime.
✴️ Conclusion: Bands confirm ongoing bearish expansion.
⊢
▦ RSI (21, 9) - 46.86 / 50.67:
∴ RSI trending below neutral 50;
∴ No bullish divergence spotted;
∴ Momentum favors sellers.
✴️ Conclusion: RSI validates bearish control.
⊢
▦ MACD (9, 21, 9) - Line: –766.13 / Signal: –631.35 / Histogram: –134.78:
∴ Bearish crossover intact, histogram negative;
∴ Acceleration of bearish momentum confirmed;
∴ No signal of reversal yet.
✴️ Conclusion: MACD reinforces bearish regime.
⊢
▦ ADX (21, 9) - 25.31:
∴ Above 25 = trend gaining strength;
∴ Directional bias negative;
∴ Confirms transition from range into downtrend.
✴️ Conclusion: Bearish trend strengthening.
⊢
▦ MFI (21) - 40.14:
∴ Below 50 = capital outflows dominate;
∴ No oversold conditions yet;
∴ Space for further selling pressure.
✴️ Conclusion: Flow aligned with bearish market.
⊢
▦ OBV (21, BB2) - (–86.16K):
∴ Downward OBV shows distribution phase;
∴ Confirms sellers in control of volume dynamics;
∴ Bears dominate liquidity.
✴️ Conclusion: OBV confirms distribution bias.
⊢
▦ StochRSI (3, 3, 21, 9) - K: 8.01 / D: 7.62:
∴ Oversold condition;
∴ May allow short-term relief bounces;
∴ But no confirmed bullish reversal yet.
✴️ Conclusion: Short-term oversold, but within bearish context.
⊢
▦ Fibonacci Retracement (0.000 / 1.000):
0.618 -> $114,049.13 - (current battlefield, price at edge);
0.500 -> $111,058.33 - (next target if broken);
0.382 -> $108,067.53 - (deeper continuation);
0.236 -> $104,367.05 - (bear extension);
EMA200 confluence near 0.236 zone = macro defense.
✴️ Conclusion: 0.618 = last defense before accelerated bearish continuation.
⊢
⨀ II. Derivatives Sentiment – Skew, 180D Deribit - (Source: Amberdata & Coindesk):
▦ Call-Put Skew (180D / –0.42) - (Aug 21, 2025):
∴ Most negative since Jun/2023;
∴ Reflects strong demand for puts vs calls = hedging / defensive positioning;
∴ Institutional sentiment aligned with technical bearish regime.
✴️ Conclusion: Skew confirms institutional bearish caution.
⊢
🜎 Strategic Insight - Technical Oracle:
∴ The 1D chart reveals a bearish regime shift. Price rejected EMA21 + Bollinger midline, failing to regain momentum;
∴ EMA50 + Fib 0.618 ($114K) is under siege, and breakdown would expose $111K and $108K zones;
∴ Momentum indicators (MACD, RSI, ADX) align with bears, while OBV + MFI confirm capital outflows and distribution;
∴ The only counterpoint is StochRSI oversold, which may fuel minor relief rallies, but not structural reversal.
⊢
⚚ Coupled with the (Deribit 180D) Skew plunging to (–0.42 = most negative in 2 years), the institutional derivative market validates the caution: Risk aversion dominates ahead of Jackson Hole, with Powell’s speech poised as catalyst for either breakdown or miraculous reclaim above EMA21 - ($116.4K).
∴ The battlefield is set:
Above ($116.4K) = reclaim & neutralization;
Below ($114K) = bear continuation -> ($111K / $108K);
If EMA200 breaks ($103K) -> full structural collapse.
⊢
𓂀 Stoic-Structural Interpretation:
✴️The BTC/USD daily structure now embodies the essence of stoic fate: inevitable compression leading to directional release.
∴ Structure of Trend: EMA's (9, 21, 50) breached, with price now clinging to the (Fib 0.618 - $114K) - the last bastion before surrender to deeper retracement ($111K / $108K). EMA200 ($103K) stands as the final citadel of macro structure;
∴ Momentum of Will: RSI below neutrality, MACD in decisive bearish cross, ADX strengthening - the market’s will bends toward decline. Only the StochRSI whispers of oversold respite, a fleeting breath amid descent, not yet salvation;
∴ Flow of Capital: MFI and OBV confirm distribution, liquidity escaping upward promise into the void. Volume contracts, yet each rejection seals the bearish dominion further;
∴ Derivative Oracle: The 180D Deribit Skew (–0.42), most negative since 2023, signals that institutions cloak themselves in protection. Demand for puts over calls mirrors stoic prudence: fortify the self, expect the storm.
✦ Structure Thus:
The market is bound by fatum;
Only a reclaim above $116.4K reopens the gates of neutrality;
Failure below $114K drags the structure into its stoic descent, step by step, until the macro fortress at $103K is tested.
✴️ Conclusion: Bitcoin stands in compression before expansion. The silence of charts echoes the discipline of Stoicism: prepare for loss, endure the storm, and only act when the structure allows.
⊢
· Cryptorvm Dominvs · MAGISTER ARCANVM · Vox Primordialis ·
· Dominivm Cardo Gyratio Omnivm · Silence precedes the next force. Structure is sacred ·
⊢

Wait for confirmation and execute SELL BTCUSD signal✏️BTCUSD is trading in a narrow range of 117000 and 114500. It is quite difficult to have a trading strategy in this range. The best is to wait for the sellers to be strong enough to break 114500 to find SELL signals to a stronger support zone. Or wait for the buyers to react around the upper resistance zone of 117000. Because this is a breakout zone in the past with retests.
📉 Key Levels
SELL Rejection 117000
SELL DCA Trigger Break of Support Zone 114500
Target 110000
Leave your comments on the idea. I am happy to read your views.
Feeling the charts, forecast for August 21, 2025.
I am engaged in the extrasensory of stock charts, that is, feeling the energy of the future chart, this is a meditative technique, and the sensations are mainly tactile.
Forecast for August 21, 2025: I have drawn my feelings about tomorrow on the chart, a strong growth at the beginning of the day UTC, and consolidation, maybe a little up at the end of the day.
At the moment, I am not analyzing the prices, only paying attention to the price movement impulses. I consider my forecast to be good if the outline of the real chart matches the outline of the chart I drew as a forecast, meaning that the direction and time period of the price movement are correctly indicated.

$BTC at a Critical Support: Bounce or Breakdown?CRYPTOCAP:BTC lost momentum after the breakout and is back near 116K.
The key zone is 111.5K–113K support; hold it, and a bounce toward 124K is likely to lead to a loss, with more downside opening up.
DYOR, NFA

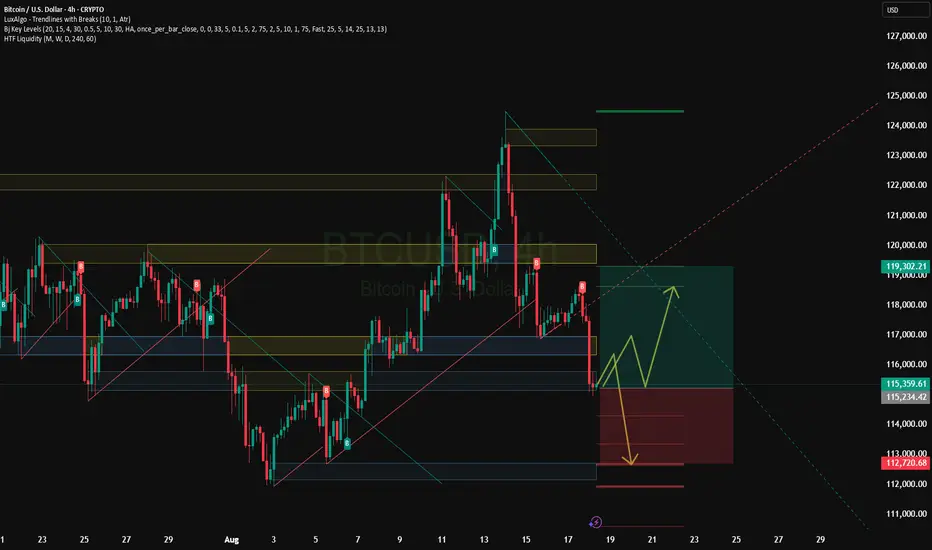
“Bitcoin (BTC/USD) – Ascending Support Holding,Eyes Set on $119KChart Analysis
Price Structure & Pattern
The chart shows Bitcoin (BTC/USD) on a 30-minute timeframe, revealing a rising support trendline—price has rebounded from this upward-sloping base.
Previously, price formed a rising green channel, climbed toward the resistance zone near $119K, but was drawn back—creating a consolidation beneath that key level.
A horizontal resistance line at $119,582.80 marks a crucial ceiling. The drawn blue arrow suggests a potential bounce from trendline support aiming to test that resistance again.
Key Technical Levels
Support: The ascending trendline acts as dynamic support—if it holds, it may support another test of resistance.
Resistance: The $119K area remains a key barrier. Breaking above this level could be a strong bullish trigger.
Broader Technical Context & Market Sentiment
From recent technical insights and market commentary:
Resistance at $119K and Beyond
Analysts note Bitcoin is testing long-term resistance near $119K, a level tying back to major peaks. A breakout could catalyze a renewed bullish momentum
AInvest
+1
Brave New Coin
.
Described by some as a descending wedge or consolidation, this structure suggests a potential breakout toward $123K–$125K if $119K is breached with conviction
AInvest
Brave New Coin
.
Support & Consolidation
BTC has been channeling between roughly $116K support and $119K resistance, setting up a tightening range ripe for breakout
Brave New Coin
TradingView
+1
.
Short-term support zones near $115K–$116K align with buyers stepping in, and a hold above these levels supports bullish continuation
TradingView
Mitrade
.
Technical Sentiment & Momentum
Key resistance around $118.6K–$119K is underscored by moving averages and trendlines, with MACD and RSI metrics still nudging upward on hopes of a breakout
Mitrade
.
Some analysts highlight a cup-and-handle pattern and potential for a 14% rally toward $134.5K if price breaks through and sustains above current highs
Business Insider
.
Summary Table
Zone Description Potential Impact
Ascending Trendline Support Price recently bounced here Offers a base for bullish continuation
$119K Resistance Established ceiling of current range Breakout could fuel a rally to $123K–$125K
$115K–$116K Support Lower bound of consolidation Holds the structure—break below could trigger deeper pullback
Final Thoughts
Your chart beautifully captures BTC’s moment of decision—riding support and potentially preparing for another rally attempt at $119K. Watch for:
Bullish scenario: A bounce off the ascending support trendline, followed by clear volume-backed break above $119K—opening a path to $123K+.
Bearish scenario: A failure at resistance leads to trendline breach, risking a slide back toward the $115K or lower support zones.

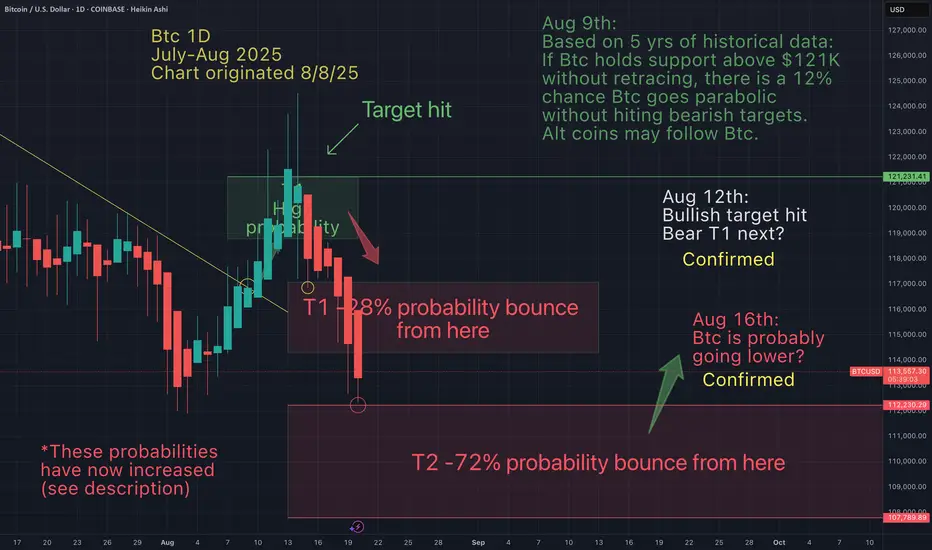
You ask yourself "how did he know that Btc would do that" As anticipated Btc is about to hit my high probability bearish target (T2). Question is how much lower into this historical range will Btc go (108K-112K). What do you think?
BITCOIN PREDICTION: HERE IS WHERE THE CRASH WILL STOP!!! (deep) Yello Paradisers! In this video, I'm sharing with you an Ultra High Time Frame: the double-top shooting star candlestick pattern formation plus bearish divergence, plus that we are trying to break below our channel.
On a high timeframe chart, I'm sharing with you the ABC zigzag, explaining that right now we are in the C wave, which is a motive mode wave. That means five waves to the upside, and with the highest probability, right now we are in the secondary wave that on its primary waves is creating a zigzag formation.
The 0.786 Fibonacci retracement level needs to hold, and the channel can't be reclaimed. I'm sharing with you the kind of confirmations for both short and long positions we are waiting for with the ParadiseTeam.
On a medium timeframe, we are seeing the first bullish signs and a bullish divergence, where we need to wait for confirmations before taking action. We are also looking at the Fibonacci support that is supporting the finishing of Wave 2.
On the low timeframe chart, we are analyzing the higher degree secondary wave, which is a zigzag. A and C waves are motive mode waves, so we are waiting for the completion of the five-moonstone downside inside of the C wave. This might perfectly confluence with the 0.618 Fibonacci's extension of Wave A, which is usually where the C Wave ends.
Paradisers! Keep in mind to trade only with a proper professional trading strategy. Wait for confirmations. Play with tactics. This is the only way you can be long-term profitable.
Remember, don’t trade without confirmations. Wait for them before creating a trade. Be disciplined, patient, and emotionally controlled. Only trade the highest probability setups with the greatest risk to reward ratio. This will ensure that you become a long-term profitable professional trader.
Don't be a gambler. Don't try to get rich quick. Make sure that your trading is professionally based on proper strategies and trade tactics.

BITCOIN PREDICTION: BIGGER CRASH INCOMING!?? (warning) Yello Paradisers! In today's video, I'm revealing the truth to you. I'm sharing the Ultrahigh timeframe chart, which includes the shooting star double top formation, plus bearish divergence and the channel. And I'm revealing the Elliot wave theory on the Ultrahigh timeframe.
On the high timeframe chart, I'm revealing to you the ABC zigzag and the possibility that we have already concluded the five moves to the upside. I'm sharing with you the bearish divergence and the confirmation that is needed, and what needs to happen for us to go down to $108,000.
On a medium timeframe, we are seeing the triangle reclaim on low volume, but we are also checking the bullish divergence where we are waiting for confirmation. If the Elliott Wave breaks below $112,000, we will go lower toward $108,000. Then, the structure from an Elliott Wave perspective is going to turn bearish, and we will be treating the market as bearish and looking for short opportunities. But if you are able to reclaim it, we are looking for buying opportunities if you are able to defend the low. I'm sharing with you what kind of confirmations I'm waiting for so you can tactically also approach the market.
On the low timeframe chart, we are concluding the wave structure and waiting for its next move.
Paradisers! Keep in mind to trade only with a proper professional trading strategy. Wait for confirmations. Play with tactics. This is the only way you can be long-term profitable.
Remember, don’t trade without confirmations. Wait for them before creating a trade. Be disciplined, patient, and emotionally controlled. Only trade the highest probability setups with the greatest risk to reward ratio. This will ensure that you become a long-term profitable professional trader.
Don't be a gambler. Don't try to get rich quick. Make sure that your trading is professionally based on proper strategies and trade tactics.

$BTC — I’ve entered a short position as the September rate cut CRYPTOCAP:BTC — I’ve entered a short position as the September rate cut looks more like a sell-the-news scenario than a bullish catalyst. I expect price to slide toward 110K first, with potential continuation down to 100K if sellers keep control. Market makers might still spike price into the 120K–125K zone before the dump, but overall structure suggests lower levels ahead.
🎯 BTC Downside Targets:
110K → 105K → 100K → 95K → 90K
BTC/USD) Technical analysis Read The captionSMC Trading point update
Technical analysis of BTC/USD daily chart analysis you shared:
---
Analysis Idea – Bitcoin (BTC/USD)
1. Key Resistance Zone (Yellow Box):
BTC faced multiple rejections from the highlighted resistance area (shown by red arrows), indicating strong selling pressure.
2. Trendline Break:
A clear break below the ascending trendline confirms weakness in bullish momentum and suggests a shift toward bearish structure.
3. EMA 200 (Blue Line):
The 200-day EMA at 103,179 acts as a dynamic support. If price continues downward, it will likely test this area.
4. Target Zone:
Bearish continuation points toward the 100,720 – 100,419 support zone, marked as the target point on the chart.
5. RSI (42.74):
RSI is trending lower, supporting bearish momentum but not yet oversold — indicating more room for downside before a potential bounce.
Mr SMC Trading point
---
Idea Summary:
Bitcoin is showing signs of a bearish reversal after repeated resistance rejections and a trendline break. Price is likely to head lower toward the 100,700 region, with the 200 EMA providing possible short-term support.
Please support boost 🚀 this analysis)

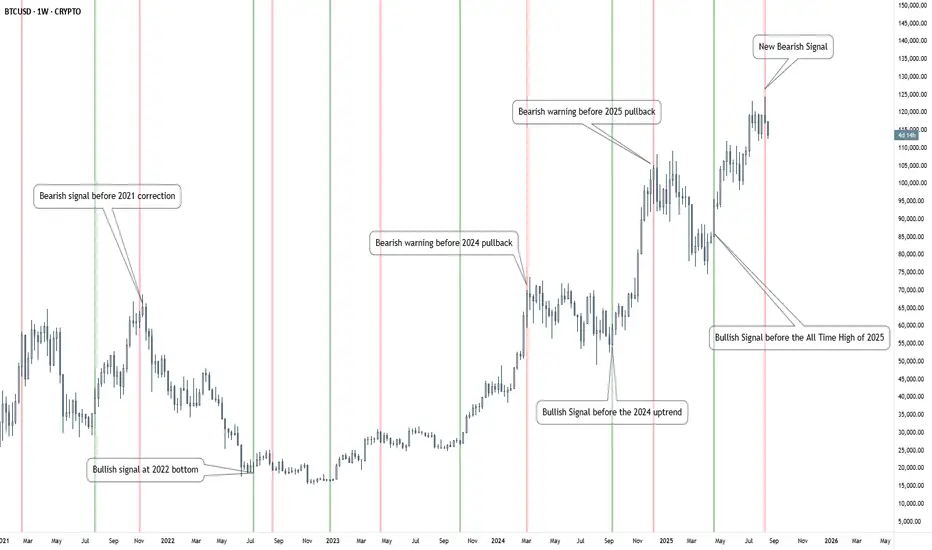
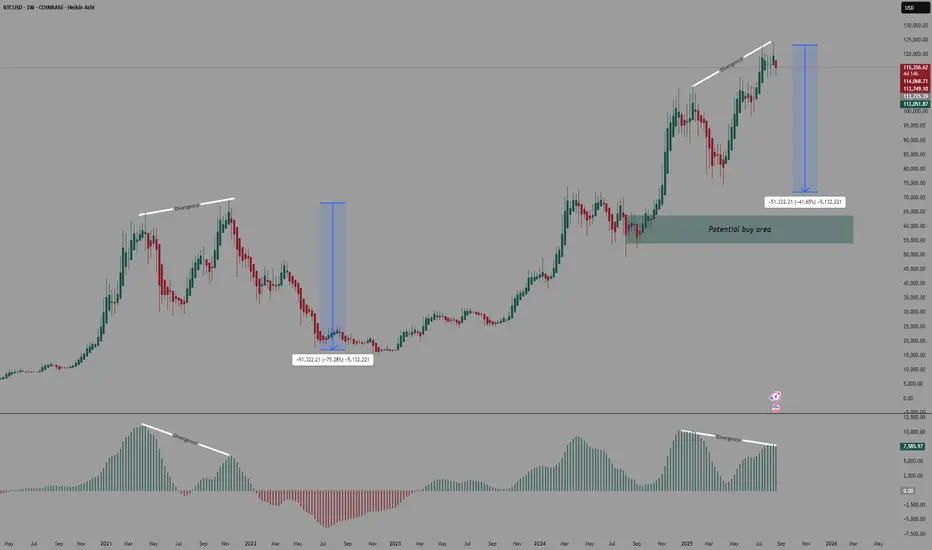
Bitcoin | Following the Smart Money Trend🔴 Smart Money positioning just triggered a new Bearish signal on Bitcoin.
This chart highlights how trend shifts in Bitcoin can be tracked by following changes in market positioning from major players – often referred to as Smart Money.
🟢 Bullish phases appear when institutional positioning suggests growing confidence.
🔴 Bearish phases emerge when Smart Money flows signal risk-off sentiment.
📊 The Custom Indicator Histogram visualizes the momentum behind these moves.
Historically, these signals have aligned with key turning points in Bitcoin’s long-term cycle.
👉 A new Bearish signal has just been triggered, suggesting caution for the weeks ahead.
⚠️ This analysis is for educational purposes only and should not be taken as financial advice.
Bitcoin possible correction?📈 Hey Traders!
Here’s a fresh outlook from my trading desk. If you’ve been following me for a while, you already know my approach:
🧩 I trade Supply & Demand zones using Heikin Ashi chart on the 4H timeframe.
🧠 I keep it mechanical and clean — no messy charts, no guessing games.
❌ No trendlines, no fixed sessions, no patterns, no indicator overload.
❌ No overanalyzing market structure or imbalances.
❌ No scalping, and no need to be glued to the screen.
✅ I trade exclusively with limit orders, so it’s more of a set-and-forget style.
✅ This means more freedom, less screen time, and a focus on quality setups.
✅ Just a simplified, structured plan and a calm mindset.
💬 Let’s Talk:
💡Do you trade supply & demand too ?
💡What’s your go-to timeframe ?
💡Ever tried Heikin Ashi ?
📩 Got questions about my strategy or setup? Drop them below — ask me anything, I’m here to share.
Let’s grow together and keep it simple. 👊
Bitcoin Update – Price Action Still on TrackBitcoin Update – Price Action Still on Track
Yesterday’s scenario has continued to play out with precision. BTC remains guided by the descending channel, each time touching the upper trendline it quickly rejects and moves lower. At present, price is reacting around the midline of the channel, near 113,000 – exactly the level highlighted earlier as an area to watch.
With this corrective move, there is scope for BTC to retest the 115,000 region before resuming its broader downtrend. The next downside target sits near 110,000, as larger timeframe structures usually require a corrective pullback before continuing with the main trend – something that aligns closely with Dow Theory principles.
Today’s focus is also on interest rate discussions, which could bring higher volatility across global financial markets as investors remain cautious. However, FOMC outcomes tend to have limited impact on Bitcoin given its nature as a relatively independent asset, unlike gold or forex markets that are more sensitive to macroeconomic drivers.
For short-term trading, traders may consider long positions near 113,000 with a tight stop just below the newly formed support, aiming for a move towards 115,000 before reassessing the broader trend.
Patience and discipline remain key. Sticking to a well-defined plan rather than reacting emotionally to intraday swings will often lead to stronger trading outcomes.
What’s your view on Bitcoin’s next move? Share your thoughts in the comments.
#BTCUSD #Bitcoin #CryptoAnalysis #TechnicalAnalysis #PriceAction #Trendline #DowTheory #CryptoTrading #SwingTrading #UKTrading
Bitcoin: $120K Breakthrough – Getting Ready for $130K–$134K!Bitcoin: $120K Breakthrough – Getting Ready for $130K–$134K!
🚀 Bitcoin (BTC/USD) – Technical Review, August 2025
• Support: $110K–112K holds — above it, bulls retain initiative.
• Momentum resumes: BTC broke through $120K, thanks to $260 million inflow into Bitcoin via ETFs and potential Bullish IPO. Drive is maintained. Possible target is $130K–$134K.
• Technical outlook: Recovery above $115K after record highs in July. Breakout — will give way to $128K. Hidden risks — fall below $110K.
• Long-term targets: Technical measurement points to potential up to $146,400 if above $112K holds and top is broken. RSI remains favorable, volumes on exchanges are declining — signal of institutional outflow.
Bottom line: Bitcoin is confidently holding above the key $110-120K zone. A breakout of $120K is a starting point for a move to $130-$134K, and then to $146K. Watch for consolidation or pullback near current levels.
Tactics:
- Buy on dip: around $112-115K with targets of $130-134K.
- Breakout buy: if it consolidates above $120K, target $130-$134K, then $146K.
- Stop loss: under $110K.
Feeling the charts, forecast for August 20, 2025.
I am engaged in the extrasensory of stock charts, that is, feeling the energy of the future chart, this is a meditative technique, and the sensations are mainly tactile.
Forecast for August 20, 2025: the continuation of the fall of Bitcoin, from the beginning to the end of the day, I have drawn my feelings on the chart posted in this post, the main downward movement, as I think, will be in the first half of the day.
At the moment, I'm not analyzing the prices, I'm only paying attention to the price movement's impulses. I consider my forecast to be accurate if the outline of the actual chart matches the outline of the chart I've drawn as a forecast, indicating the correct direction and time period of the price movement.

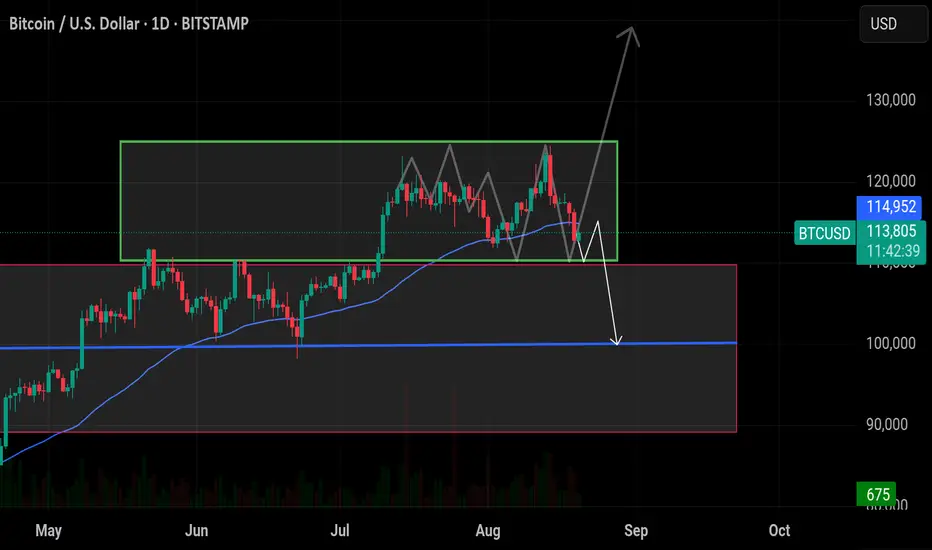
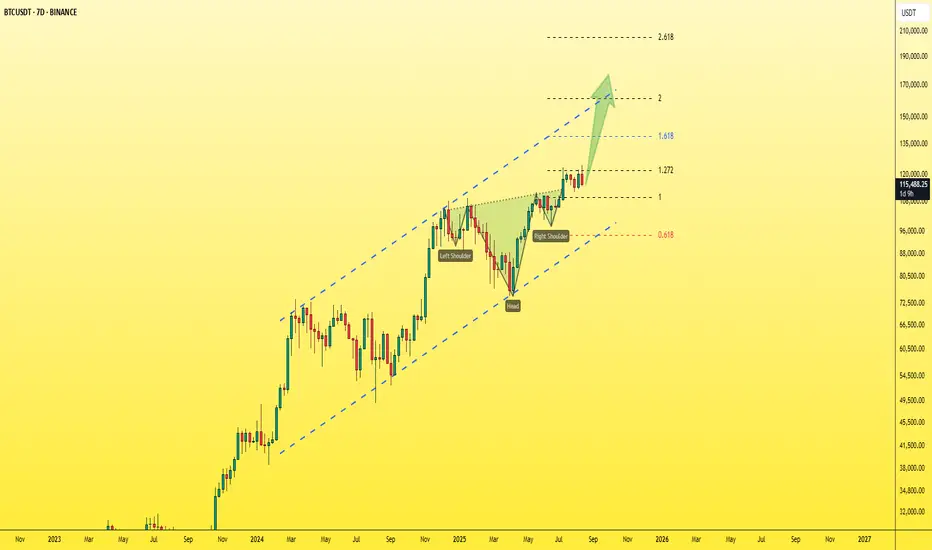
Bitcoin - Clean chart that outlines the next leg up seamlessly!The Bitcoin chart is crystal clear, simple, and very bullish.
We’ve talked about it over and over, and we’ve always said that 120K is a confirmed target — and now that it’s been hit, I’m telling you the next stop is 150K.
We’ve got a reverse Head & Shoulders pattern, the neckline has been broken, and price is now retesting it.
BTC also broke its previous ATH at 109,500 and is on its way to retest it right now.
All of this on the weekly chart are strong bullish signals that will at least push price to the upper side of the Ascending Channel that we’ve been tracking. Plus, the projection target of the reversal H&S perfectly aligns with this outlook — no coincidence here.
👉 150K is the next station. 🚀
Best regards:
Ceciliones🎯
Bitcoin 15-Minute Trade SetupAfter a sharp sell-off from the high of 124,571.2, Bitcoin has been consistently forming a series of lower lows and lower highs, indicating sustained bearish pressure.
Recently, we observed a break of structure (BoS) at 116,72, followed by a corrective pullback on the 15-minute timeframe. This pullback presents a short-term trading opportunity.
Entry: 115,310.9
Stop Loss (SL): 115,000
Target (1:4 RR): 116,551
Interestingly, the 116,551 level also aligns with a potential rejection zone on the 4-hour point of interest (POI), which could reinforce this setup.
Trade Idea:
Looking to take advantage of the pullback for a risk-defined entry with a favorable risk-to-reward ratio. Monitoring how price reacts around the 4H POI will be key in managing this trade.

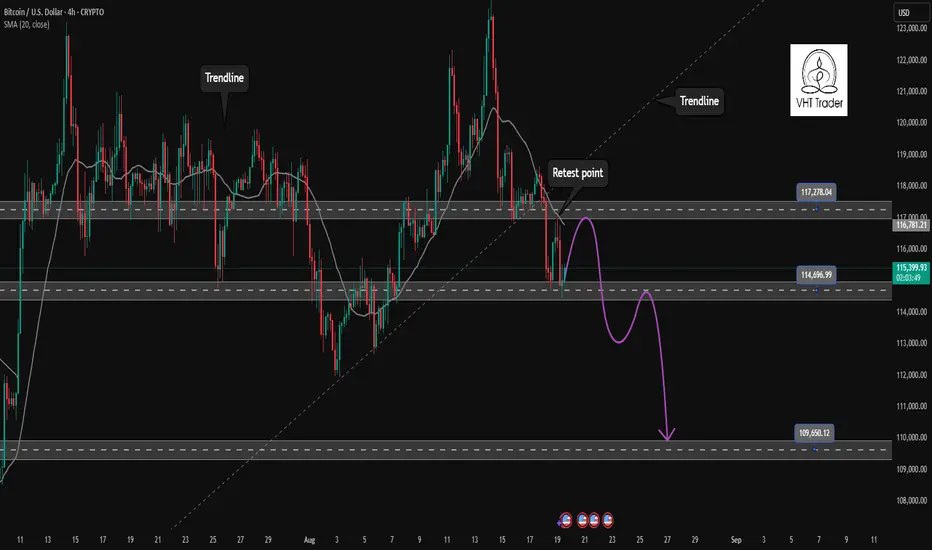
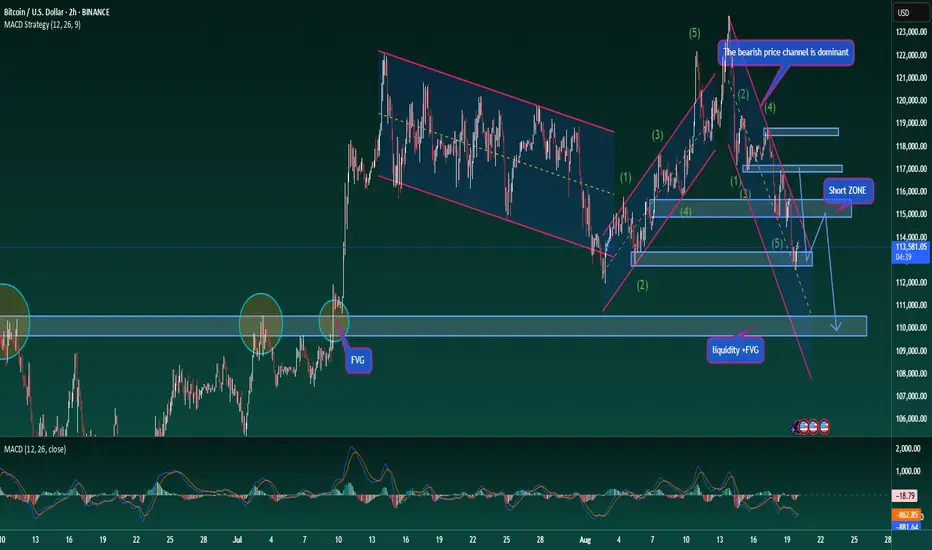
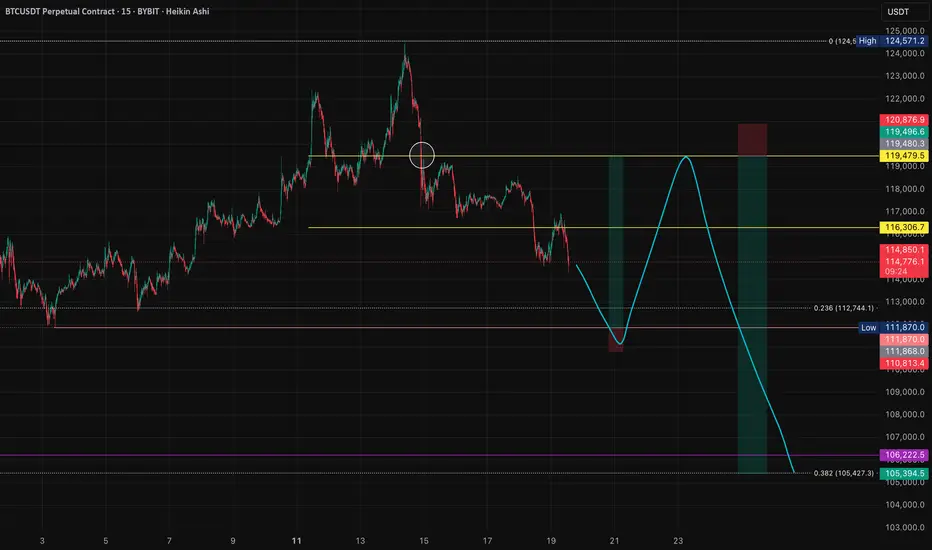
BTC: Multi-Phase Correction Scenario₿ BITCOIN: Multi-Phase Correction Scenario - Liquidity Hunt to Major Pullback
Sharing my broader outlook for Bitcoin's next major moves. This is a multi-timeframe analysis with several key phases. 🎯
**📍 Phase 1: Daily Dow Theory Reversal**
The pink line below marks the daily timeframe pivot point based on Dow Theory. I'm expecting a liquidity grab at this level first - sweeping out the stop losses parked below this key structural point. 🔄
**📈 Phase 2: The Counter-Trend Rally**
After the liquidity hunt, I'm looking for a recovery back toward the upper yellow horizontal line - this represents the recent range high. This would be a classic "fake-out" move to trap short-biased traders before the real decline begins. 🎭
**⏰ Time Factor Consideration:**
If this rally extends into next week or beyond, we might only see a recovery to the lower yellow horizontal line instead. **Time affects momentum** - the longer price takes to develop, the weaker the eventual bounce tends to be. 📅
**📉 Phase 3: The Main Event**
Finally, I'm anticipating a significant decline down to the purple line at the bottom - approximately the 0.382 Fibonacci level. This would represent the major corrective move. 🎯
**⚠️ Risk Management Note:**
I cannot provide a risk-to-reward ratio for this setup yet. **Why?** Because I don't know exactly how price will behave at each critical level, and the stop loss placement will depend on how the structure develops. The R/R calculation will determine whether I actually take this trade or pass on it. 📊
**🧠 Key Takeaway:**
This is a perfect example of why having a plan is different from having a trade. I know what I want to see, but I won't commit capital until the risk-to-reward makes sense. Patience pays in trading. ⏳
---
**Trading is simple.** You don't need multiple indicators or dozens of lines on your chart. A clean and simple chart often works best — it keeps your decisions consistent and reduces uncertainty. Sure, it might not look flashy, and my analysis may seem a bit "plain" compared to others… but that's how I like it. If you find this analysis useful, feel free to follow me for more updates.
---
*Disclaimer: This post is for general informational and educational purposes only. It does not constitute financial advice, investment recommendation, or a service targeting specific investors, and should not be considered illegal or restricted information in any jurisdiction.*
EURO Breakout Alert- Long Setup In Play EUR/USD is currently trading around 1.1660, showing strong bullish momentum after holding key support levels. The pair is forming higher lows, indicating sustained buying pressure. If price action maintains above 1.1650, the next upside target is 1.1700, with a potential extension towards 1.1730. Euro strength is driven by positive market sentiment and weakness in the dollar index. Watch for a clean breakout above 1.1675 for confirmation of further upside. Ideal buy entry remains around 1.1660 with stop loss below 1.1640. Short-term trend remains bullish as long as the pair stays above 1.1640.

Bitcoin : Stay heavy on positions
In the short term, there's a potential for a bounce off the previous "short-term overbought" zone, which now serves as support—a textbook pattern.
From a longer-term perspective, my view remains unchanged.
Bitcoin : Stay heavy on positions (2x)
** This analysis is based solely on the quantification of crowd psychology.
It does not incorporate price action, trading volume, or macroeconomic indicators.
