Bitcoin : Stay heavy on positions
In the short term, there's a potential for a bounce off the previous "short-term overbought" zone, which now serves as support—a textbook pattern.
From a longer-term perspective, my view remains unchanged.
Bitcoin : Stay heavy on positions (2x)
** This analysis is based solely on the quantification of crowd psychology.
It does not incorporate price action, trading volume, or macroeconomic indicators.
Btcusdanalysis

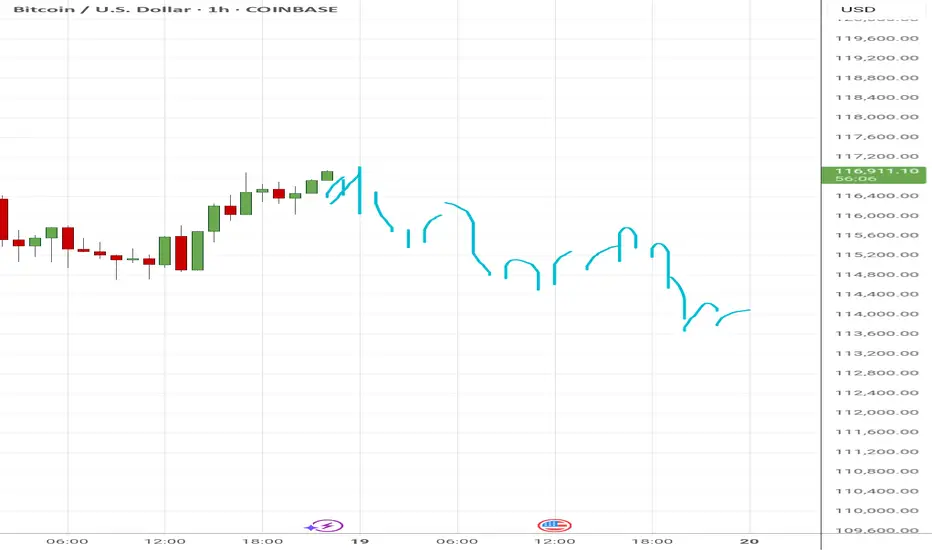
Feeling the charts, forecast for August 19, 2025.
I practice stock chart extrasensory, that is, feeling the energy of the future chart, this is a meditative technique, and the sensations are mainly tactile.
Forecast for August 19, 2025: I think there will be two strong downward impulses, around 6-7:00 UTC and 18-19:00 UTC, and perhaps the first two hours from 00:00 will also have a noticeable downward movement, and we will end the day lower than we started.
At the moment, I'm not analyzing the prices, I'm only paying attention to the price movement's impulses. I consider my forecast to be accurate if the outline of the actual chart matches the outline of the chart I've drawn as a forecast, indicating the correct direction and time period of the price movement.
BTC Crashing To 110kAfter taking out ATH last week, BTC broke structure to the downside on the 8h with a quick retest of the FVG. Price is now trending towards the next major support level at 111,930. If price breaks this level, we could see a retest and accumulation of new buy orders at 110k level.
Do you see price breaking below 110k?
#btc #short #analysis #smartmoney

BTCUSDT (bitcoin) towards the $115kHello guys!
1-BTC broke the ascending channel
Bitcoin was moving inside an ascending channel, creating higher highs and higher lows.
Recently, it broke below the lower trendline of this channel, signaling weakness and a potential shift in momentum from bullish to bearish.
2-Engulfed the last low
After breaking the channel, BTC formed a strong bearish candle that engulfed the previous swing low.
This indicates that sellers are now in control, confirming bearish pressure in the market.
3-Current bias: Bearish with possible short entries
Despite the bearish sentiment, BTC may retest previous supply zones before continuing lower.
Two possible short entry scenarios are highlighted:
Scenario 1: Near 118,600 USDT
Scenario 2: Around 119,700 USDT
Both levels align with potential retracement areas where sellers could step back in.
4-Target
The downside target is around 115,800 USDT.
This zone coincides with previous demand/support, making it a logical area where price might find buyers again.

BTC/USDT 4H Trade Idea – Demand Zone Rejection & Liquidity Sweep
Bitcoin is currently retesting a strong support zone after a sharp sell-off. Price dipped into the liquidity sweep / manipulation zone, triggering stop hunts below the support area. This often indicates accumulation by smart money before a potential reversal.
📌 Plan / Setup:
Watching for bullish confirmation in the highlighted demand zone.
Possible entry after rejection or confirmation candle.
Stop-loss: Below the liquidity sweep zone.
Target 1: 119,200 (immediate resistance).
Target 2: 121,000 (major resistance zone).
🔑 Why this setup looks strong?
Historical demand zone support respected multiple times.
Liquidity grab below support hints at reversal potential.
Clear risk-to-reward if price reclaims resistance levels.
⚠️ Risk Disclaimer: Trade with proper risk management. This is not financial advice, just an educational trade idea.
Hashtags & Keywords for TradingView
#BTCUSDT #Bitcoin #CryptoTrading #SwingTrading #DayTrading #PriceAction #LiquiditySweep #SupportAndResistance #DemandZone #SmartMoneyConcepts #TradingPsychology #RiskManagement #CryptoAnalysis

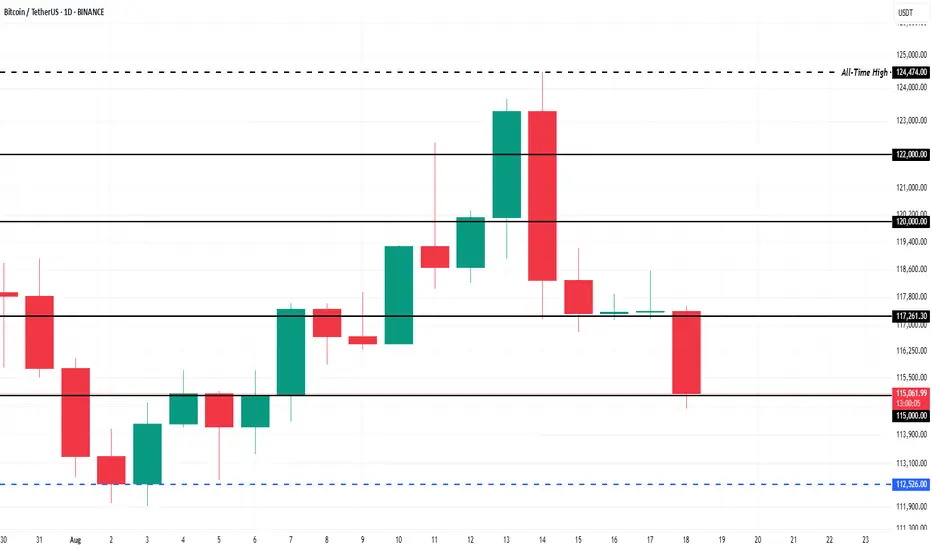
Bitcoin Price Forecast: Indicators Suggest $127,000 TargetAt the time of writing, BINANCE:BTCUSDT trades at $115,061, holding firmly above the $115,000 support. The models suggest that selling by STHs will remain limited until BTC approaches $127,000, which sits above the previous all-time high of $124,474 and marks the next major profit-taking level.
For BINANCE:BTCUSDT to reach this target, broader market support will be necessary. Geopolitical tensions remain a drag on sentiment, but renewed investor confidence could aid momentum. Reclaiming $117,261 as support and pushing to $120,000 would set the stage for a potential new all-time high in the near term.
If conditions worsen, BINANCE:BTCUSDT risks losing $115,000 support, with a possible decline to $112,526 or lower. Such a move would invalidate the bullish thesis and highlight the vulnerability of BTC to external pressures, reinforcing caution among traders while the market reassesses its trajectory.
BTC Deep Pullback Could Offer Strategic Long Opportunity Bitcoin📊 Bitcoin remains in a strong bullish trend on the higher timeframes 📈, which is clear on the weekly chart. However, we’ve recently seen an aggressive BTC selloff on both the daily and 4H charts 🔻. Price is now moving into key support zones, trading through a prior accumulation range visible on both the daily and 4H 🏦. This zone represents a significant liquidity pool, where Bitcoin may potentially find support. I’ll be watching closely for a bullish break of market structure on the 1H ⏰ — that would be my trigger for a potential long setup 🚀. This could present an opportunity to capitalize on a deep pullback within a bullish trend 💡 (not financial advice).

DeGRAM | BTCUSD is aiming to test the support zone📊 Technical Analysis
● BTC/USD is testing the critical support zone near 113,000–114,000, formed by the descending channel base and prior demand shelf—this aligns with the highlighted green zone as a strong buyer area.
● A rebound above ~120,300 resistance would suggest renewed bullish momentum, potentially unfolding toward the 124,100–124,500 supply zone. Price action favors a dip-and-leg-up setup.
💡 Fundamental Analysis
● The U.S. 401(k) rule change allowing Bitcoin inclusion could unlock over a trillion dollars in retirement capital, significantly lifting institutional demand.
● Spot Bitcoin ETFs continue to attract massive demand: over $50 billion inflows year-to-date, with daily highs exceeding $500 million; institutional demand exceeds mining supply by 5.6× in 2025.
● On-chain metrics show whales accumulating and miner reserves at monthly lows, reinforcing structural imbalance between supply and demand.
✨ Summary
Long from 113–114k area; breakout above ~120.3k targets 124–124.5k.
-------------------
Share your opinion in the comments and support the idea with a like. Thanks for your support!

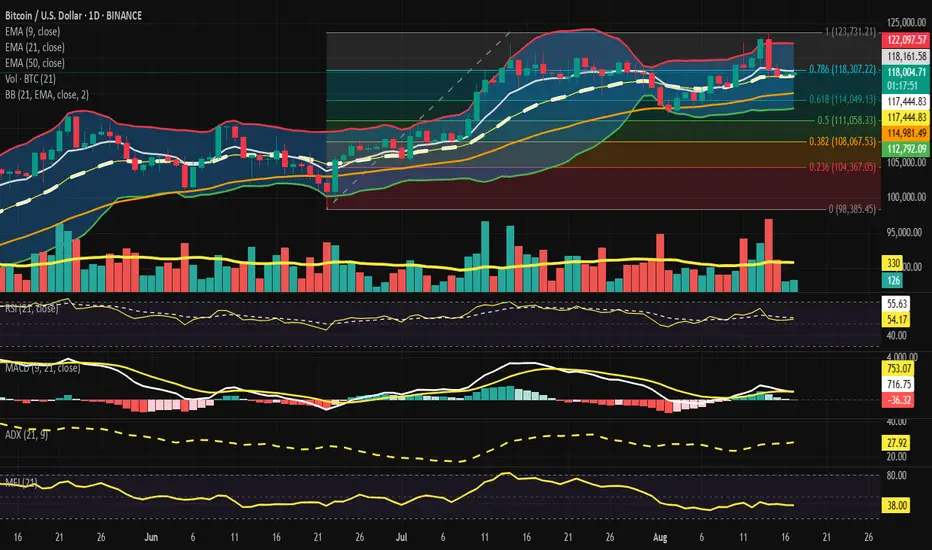
Bitcoin - Structural Compression, CME Pull Below.⊣
⟁ BTC/USD - BINANCE - (CHART: 1D) - (Aug 17, 2025).
◇ Analysis Price: $117,902.79.
⊣
⨀ I. Temporal Axis - Strategic Interval - (1D):
▦ EMA9 - $118,141.19:
∴ Current price sits $238.40 (−0.20%) below the EMA9, signaling short-term momentum cooling;
∴ The EMA9 is still aligned above EMA21 and EMA50, reflecting bullish micro-trend structure;
∴ However, the rejection from EMA9 suggests it is acting as immediate resistance rather than support.
✴️ Conclusion: The EMA9 transforms into a barrier for continuation; price must reclaim it promptly or risk sliding deeper into mid-range.
⊢
▦ EMA21 - $117,435.56:
∴ Spot trades $467.23 (+0.40%) above EMA21;
∴ EMA21 coincides with the Bollinger Basis, reinforcing its importance as the primary daily mean;
∴ The EMA21 serves as a pivot magnet - losing it would turn the short/mid bias neutral.
✴️ Conclusion: EMA21 remains structural support anchoring the trend, but pressure is visible from overhead EMA9.
⊢
▦ EMA50 - $114,977.49:
∴ Spot trades $2,925.30 (+2.55%) above EMA50;
∴ The bullish stack (EMA9 -> EMA21 -> EMA50) holds intact, confirming trend integrity on the mid horizon;
∴ A drop to EMA50 would mark a full corrective retracement, aligning with (Fibo 0.618 - $114,049.13).
✴️ Conclusion: EMA50 is the deeper structural defense; maintaining distance here preserves the bullish medium trend.
⊢
▦ BB (21, 2) - Basis: $117,435.56 / Upper: $122,084.15 / Lower: $112,786.98:
∴ Bandwidth (≈ 7.9%) of the basis -> market in a moderate volatility state;
∴ %B (≈ 0.54), situating price in the upper-mid envelope, not yet expansionary;
∴ Distance to upper band = (+3.54%), to lower band = (−4.34%), giving slightly more downside breathing room.
✴️ Conclusion: Market is balanced in volatility containment, with room both ways, yet downside slightly more open than upside.
⊢
▦ Volume (21) - 330 (current bar: 124):
∴ Current volume = (62.4%) below the rolling average -> weak participation;
∴ Weak volume on corrective candles indicates seller conviction lacking;
∴ Lack of strong volume also impairs breakout potential, keeping consolidation dominant.
✴️ Conclusion: Thin liquidity magnifies potential for wicks and mean reversions, reducing clarity of current move.
⊢
▦ RSI (21, 9) - RSI: 54.00 | Signal: 55.60:
∴ RSI resides in the neutral-positive range, above the 50-line;
∴ Momentum lags the EMA9 signal -> short-term bearish divergence;
∴ No oversold/overbought conditions (20–80 boundaries untouched).
✴️ Conclusion: RSI reflects fragile bullishness, vulnerable to further drift unless it recaptures momentum above signal.
⊢
▦ MACD (9, 21, 9) - Line: 705.63 / Signal: 750.84 / Histogram: –45.21:
∴ MACD line under signal confirms bearish crossover;
∴ Histogram remains negative yet shallow, consistent with corrective phase, not collapse;
∴ Momentum is softening, aligning with RSI’s neutral drift.
✴️ Conclusion: MACD indicates waning momentum but not trend failure - a corrective digestion phase is unfolding.
⊢
▦ ADX (21, 9) - 27.92:
∴ ADX -> 25 shows a moderate active trend;
∴ No extreme strength (>40), leaving market prone to external catalysts (macro/news);
∴ Combined with EMA stack, direction leans bullish, but ADX’s plateau signals loss of directional energy.
✴️ Conclusion: ADX affirms trend strength but hints that fuel is draining, requiring new impulse for extension.
⊢
▦ MFI (21) - 37.98:
∴ Sub-50 reflects capital outflows dominating inflows;
∴ Value remains far from oversold (<20), no exhaustion yet;
∴ Divergence emerges if price holds above EMA21 while liquidity bleeds.
✴️ Conclusion: Liquidity suggests buyers hesitating, weakening upside conviction.
⊢
▦ Fibonacci Retracement (0.000 / 1.000) - Low: $98,385.45 -> High: $123,731.21:
∴ 0.786 ($118,307.22) - Current price sits $404.43 (−0.34%) below, forming short-term ceiling;
∴ 0.618 ($114,049.13) - Key support, confluent with EMA50 ($114,977.49);
∴ 0.500 ($111,058.33) - Deeper retracement support, aligning with volatility lower structure.
✴️ Conclusion: Market trapped between 0.786 resistance and 0.618/EMA50 support -> pivotal compression zone.
⊢
🜎 Strategic Insight - Technical Oracle:
∴ The BTC/USD daily structure reveals a market in compression: EMA9 as immediate resistance, EMA21 as fragile pivot, and EMA50 + Fib 0.618 as deep anchor support;
∴ RSI and MACD both highlight momentum decay, while ADX confirms moderate but fading trend strength;
∴ MFI points to hesitant inflows, warning of liquidity weakness;
∴ Thus, the battlefield crystallizes: $118,307.22 (Fib 0.786 / EMA9 proximity) as resistance, and $114,049–114,977 (Fib 0.618 + EMA50) as structural defense. A break either way will dictate expansion.
✴️ Conclusion: Until resolved, the market remains in stoic compression - silence before expansion.
⊢
∫ III. On-Chain Intelligence - (Source: CryptoQuant):
▦ Exchange Inflow Total + EMA9 - (All Exchanges):
∴ Historically, surges in inflows correlate with distribution events - localized tops or sell pressure phases;
∴ The current inflow reading remains muted, far below major spikes (100K / 300K BTC) observed during prior capitulation or distribution clusters;
∴ Sustained low inflows indicate reduced immediate sell pressure, aligning with exchange reserves declining trend.
✴️ Conclusion: Current inflow profile is neutral-to-bullish, as supply entering exchanges is contained.
⊢
▦ Structural Pattern (2022 -> 2025):
∴ In 2022–2023, inflows frequently exceeded 200K BTC, triggering strong bearish legs;
∴ Since 2024, inflow peaks are smaller and less frequent, even as price advanced past $100K - showing increased holding conviction;
∴ Localized inflow upticks in early 2025 preceded short-term corrections, yet were absorbed without trend breakdown.
✴️ Conclusion: Market maturity visible - holders distribute less aggressively, supporting resilience of higher valuations.
⊢
▦ EMA9 Overlay (On-Chain Inflow Smoothing) - (not numerically explicit, observed visually):
∴ EMA9 of inflows remains flat-to-declining into mid-2025;
∴ Lack of sustained inflow uptrend -> exchanges not receiving systematic sell-side waves;
∴ This reduction aligns with macro hodling behavior dominating.
✴️ Conclusion: The inflow EMA reinforces quiet supply pressure, consistent with accumulation psychology.
⊢
🜎 Strategic Insight - On-Chain Oracle:
∴ Exchange inflow dynamics confirm a structurally quieter supply environment compared to previous cycles;
∴ While localized inflow bursts still produce short-term pullbacks, the overarching pattern is one of diminished distribution;
∴ In tandem with technical compression (Fib 0.786 vs 0.618 battle on daily chart), this on-chain restraint tilts risk asymmetry toward buyers - provided inflows remain subdued.
✴️ Conclusion: The silence of supply is itself a force: fewer coins offered into the market mean any liquidity shock could amplify upward expansion.
⊢
⟁ BTC/USD - CME Futures BTC1! - (CHART: 1D) - (Aug 17, 2025):
◇ Current Price: $118.150.
◇ Chart Link:
⊣
▦ CME Futures GAP - Observation & Ritual Closure:
CME Previous Close - $117,235.00;
CME Current Open - $117,995.00;
CME Last Print - $118,150.00.
∴ GAP CME (Open vs. Previous Close) = +760 pts (+0.65%);
∴ This leaves an upward GAP from ($117,235) -> ($117,995);
∴ GAP already in partial closure zone (low today $117,645).
✴️ Conclusion: CME opened with bullish GAP, partially tested intraday. Historical tendencies favor full gap closure within subsequent sessions (≈ 85% probability), yet persistence above $118K could normalize it as a continuation gap.
⊢
▦ Volume (CME - Session) - 38 contracts (low relative participation):
∴ Initial session prints show light activity;
∴ Weak volume reduces conviction of gap as an institutional “breakaway”;
∴ Implies gap more likely to be filled than sustained immediately.
✴️ Conclusion: Low conviction inflow reduces sustainability of gap.
⊢
🜎 Strategic Insight - CME Oracle:
∴ The CME chart reveals an upward opening GAP (+760 pts), currently under test. Historically, such gaps on BTC futures act as magnets until closure, unless validated by institutional surge volume;
∴ With today’s session showing thin activity, the odds tilt toward eventual closure at ($117,235);
∴ Thus, the institutional map places immediate magnetic risk below spot, even as the daily technicals (BTC/USD - 1D) compress between (Fib 0.786 and EMA50).
⧉ Together with subdued on-chain inflows, the structure suggests:
Spot chart = technical compression (awaiting breakout);
On-chain = low supply inflows, bullish undertone;
CME = gap pull magnet down toward ($117,235), unless denied by volume expansion.
⊢
𓂀 Stoic-Structural Interpretation:
∴ The daily BTC/USD frame manifests in compression - EMA9 overhead resistance vs. EMA21/EMA50 layered supports, with Fib 0.786 as ceiling and 0.618 as anchor;
∴ On-chain inflows remain muted, signaling reduced distribution and a silent, stoic restraint of supply;
∴ The CME Futures GAP (+760 pts) exerts a gravitational magnet toward ($117,235), yet its low-volume print weakens institutional conviction.
✴️ Stoic Arcane Conclusion: Structure stands at the threshold of stoic tension - supply muted, momentum fading, futures pulling. The silence of inflows aligns with a potential expansion, yet institutional gravity demands respect.
⊢
✦ Structure:
∴ BTC/USD (1D Spot) -> Compression defined between Fib 0.786 ($118,307) resistance and Fib 0.618 + EMA50 ($114,049–114,977) support; EMA9 acts as immediate friction, EMA21 as fragile pivot;
∴ On-Chain Inflows -> Exchange inflows remain muted (10.2K BTC recent), far from historic distribution surges, confirming supply silence and stronger holder conviction;
∴ CME Futures -> Market opened with an upward GAP (+760 pts) from $117,235–$117,995, partially tested but unresolved; low volume weakens breakout sustainability, implying magnetic pull back toward closure.
✴️ Structural Reading: Bitcoin stands at a convergent triad - technical compression, on-chain restraint, and institutional gap gravity. Expansion is imminent, but direction hinges on whether the spot chart breaks above ($118,307) or the CME magnet drags price to ($117,235).
⊢
· Cryptorvm Dominvs · MAGISTER ARCANVM · Vox Primordialis ·
· Dominivm Cardo Gyratio Omnivm · Silence precedes the next force. Structure is sacred ·
⊢
Feeling the charts, forecast for August 18, 2025.
I am engaged in the extrasensory of stock charts, that is, feeling the energy of the future chart, this is a meditative technique, and the sensations are mainly tactile.
Forecast for August 18, 2025, I feel growth, the strongest upward impulse will be around 09:00 UTC, the day will end at higher prices than it started.
At the moment, I am not analyzing the prices, I am only paying attention to the price movement impulses. I consider my forecast to be good if the outline of the real chart matches the outline of the chart I drew as a forecast, meaning that the direction and time period of the price movement are correctly indicated.

#Bitcoin Sunday Update: $BTC may look to grab liquidity below #Bitcoin Sunday Update:
CRYPTOCAP:BTC may look to grab liquidity below $115,900, possibly extending down to the 50 EMA near $115,000. If this level gives way, the next important support sits at $110,000, which could be tested sooner or later.
🔸 Upside Target:
After liquidity grab, BTC can push toward $120K, with extended momentum possibly reaching $125K.
🔸 Outlook:
Monitor liquidity sweeps around $115K–$115.9K for long entries. If broken, expect a deeper test toward $110K before a strong bounce to the upside.
#xrp #eth

What will happen to Bitcoin in the end?Hello friends
Bitcoin has made a correction in this 4-hour timeframe after its rise and is now in a range. Considering the waves formed, it is expected to move upwards and form wave D if the important resistance is broken by the buyers.
The price may remain in this range for a while, so be patient.
Now, for a safe entry, we can let the resistance or support be broken validly and then enter.
The specified price range can be our target and it makes sense to take profit in that area.

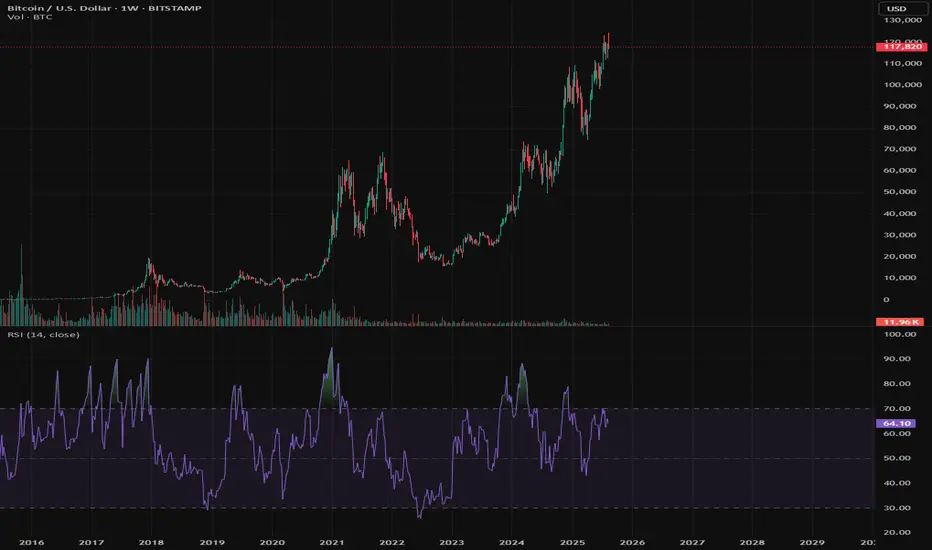
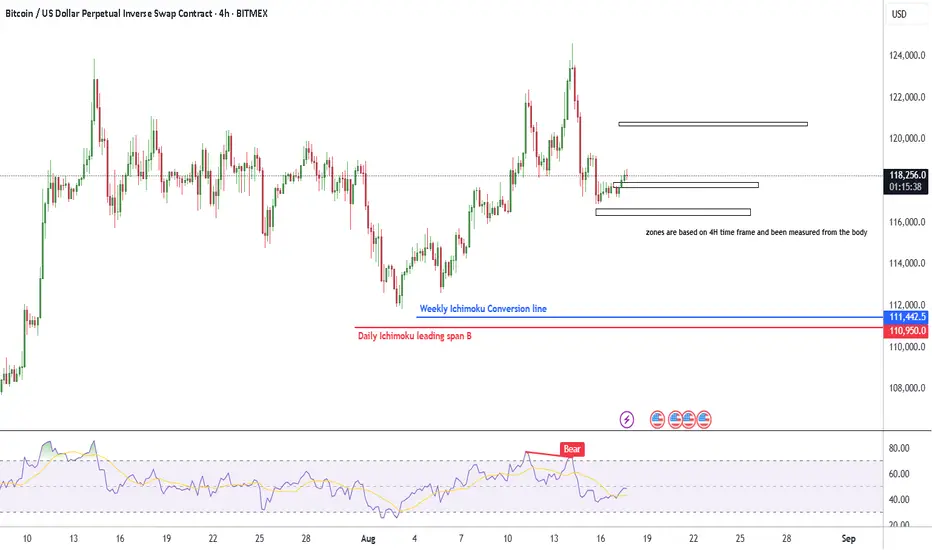
My analysis on BTC based on Fibs and IchimokuPic is self explanatory , my bet is short term short and long term long , If the price breaks through the highest zone then the possibility of retracing lower shrinks
If it fakes it , then the chances are rising
$BTC Bearish Divergence Warning Retest Likely Before CorrectionBitcoin has once again shown a strong upward wick similar to previous cycles, where such moves often aligned with bearish divergence signals. Historically, when these divergences appeared, the market either corrected or transitioned into a bearish phase. Right now, BTC may attempt a retest around the $120,000–$122,000 zone, potentially fueled by short-term hype or news. However, if the divergence plays out as in past cycles, the market could begin correcting soon after.
The first key liquidity zone sits near $98,000 — holding above this level keeps the structure healthy. But if BTC breaks below $98K support, the risk of a deeper bearish correction increases, possibly shifting the broader trend into a prolonged downcycle. Traders should be cautious here: watch the $120K retest for rejection and the $98K support for confirmation of the next major move.

BTC Back to 100.000You know the way market is beahaving the expanding Flat scenario looks more and more uncertain, zooming out and looking at the bigger picture I can count the rally up as 3 waves wich means it is part of the correction and not a new impulse, so 100.000 should be hitted once more time before a further up move

BITCOIN Rebound Ahead!
HI,Traders !
#BITCOIN made a retest
Of the wide horizontal support
Level again at 117102.1 and we
Are already seeing a bullish
Reaction so a local bullish
Rebound can be expected !
Comment and subscribe to help us grow !

Adam Back’s $2.1B Bitcoin Treasury Play // BTC SHORT:::!!!Bitcoin Standard Treasury Co.'s SPAC deal combines fiat financing and a bitcoin-denominated PIPE, aiming to debut on the Nasdaq with over 30,000 BTC and an aggressive growth plan. COINBASE:BTCUSD

BTC/USD: Seeking Bearish Continuation in Key Supply ZonesI'm sharing a detailed technical analysis on the potential next move for BTC/USD. The current structure suggests that after the recent bullish retracement, we might be approaching a high-probability area for sellers to regain control.
Detailed Technical Analysis
1. Context: The Dominant Bearish Impulse
The starting point of our analysis is the clear and strong bearish impulse observed on the daily timeframe. This establishes our bias for the coming weeks: to look for selling opportunities that align with this primary trend.
2. The Retracement: The Fibonacci Golden Pocket
Currently, the price is in a corrective bullish retracement. We've drawn a Fibonacci tool from the swing high (start of the impulse) to the swing low (end of the impulse). The price is now entering the key zone between the 0.618 and 0.786 levels. This area, often called the "Golden Pocket," is statistically an optimal zone for the main trend to resume.
3. The Confluence Zone: Daily Order Block
Within our Fibonacci zone, we've identified a Daily Order Block that acts as a strong supply and resistance area. The confluence of a key Fibo level with an institutional order block creates a very high-probability zone for a bearish reaction. It is in this area that we expect "smart money" to defend their short positions.
4. Watch Out for Liquidity!
Just above the recent high, and before reaching the upper part of the block, there is a clear liquidity pool (marked on the chart). It's highly probable that the price will make a quick, volatile move to "hunt" the stop losses of impatient sellers before initiating its true downward move. Patience here will be the key to success.
Targets and Strategic Trading Plan
This analysis leads to a clear and patient action plan. This is not about selling blindly, but about waiting for the right confirmation.
🎯 Potential Targets:
TP1: Our first target is located at the H4 Block with Inefficiency. Inefficiencies (Fair Value Gaps or FVGs) often act as a magnet for the price, making this an excellent level to take partial profits.
TP2: The final and most ambitious target is the previous low. A break of this level would confirm a full continuation of the bearish trend.
📈 Trading Plan:
Entry: The strategy is to WAIT for the price to enter the Daily Order Block. The entry should only be executed after observing a clear bearish confirmation signal on a lower timeframe (H1/H4), such as an engulfing candle, a rejection pin bar, or a reversal pattern.
Stop Loss (SL): The SL should be placed structurally, above the high that forms after the potential liquidity hunt, to give the trade room to breathe.
Take Profit (TP): A scaled exit strategy is recommended: secure partial profits at TP1, move the SL to Breakeven, and let the rest of the position run towards TP2.

BTC_USDT 4H Possible Scenario Expecting BTC will Rejecte From 120000-121000 Range. Keep Watching market to catch the best trade.
HAPPY TRADING 🥳
Bitcoin continues to go longBitcoin is trading in a narrow range today, with price movements confined to around 1,000 points, reflecting cautious market sentiment.
From a technical perspective, BTC continues to find strong buying support near key levels, displaying a classic bottoming formation on the 4-hour chart, accompanied by a bullish MACD divergence signal. The current price has entered a value investment zone, with smart money quietly accumulating positions and rebound momentum building. Traders may consider scaling into long positions in batches.
Thank you all for your likes, comments and follows, we really appreciate it!

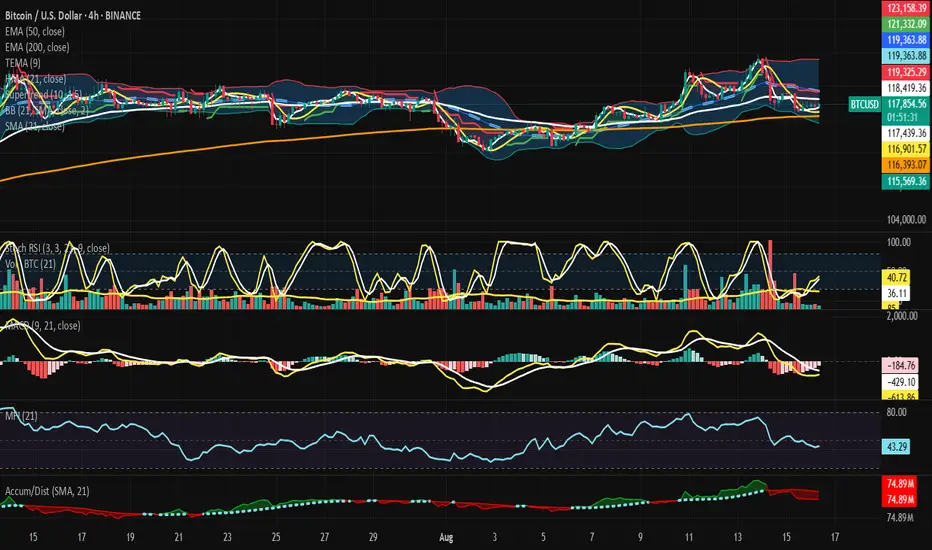
Bitcoin - Structure in Compression, Silence Before Expansion?⊣
⟁ BTC/USD - BINANCE - (CHART: H4) - (Aug 16, 2025).
◇ Analysis Price: $118,020.60.
⊣
⨀ I. Temporal Axis - Strategic Interval - (H4):
▦ EMA50 - $118,425.87:
∴ The EMA50 is currently positioned slightly above the active trading price - ($118,020.60), establishing a localized resistance zone, showing that the market is struggling to sustain momentum above this median dynamic level;
∴ In recent sessions, price action fluctuated around EMA50, but failed to reclaim it as stable support, indicating weakness in short-term recovery attempts;
∴ The slope of EMA50 remains almost flat, not strongly ascending, suggesting market indecision and lack of directional strength.
✴️ Conclusion: EMA50 is a resistance barrier, neutral-to-bearish unless reclaimed decisively.
⊢
▦ EMA200 - $116,394.72:
∴ The EMA200, being a long-term stability reference, is below the current market price, acting as structural support for the mid-term;
∴ The wide gap between EMA200 and EMA50 indicates a neutral compression phase — price oscillating between medium and long horizons;
∴ If the market falls back toward EMA200, buyers may attempt defense; a breach would confirm broader weakness in market structure.
✴️ Conclusion: EMA200 is a strong support anchor, still intact, but tested boundaries are plausible.
⊢
▦ TEMA9 - $117,520.39:
∴ TEMA9 is below the current price, serving as immediate dynamic support, often used by short-term traders;
∴ Market bounces in the last sessions respected this fast-moving indicator, giving temporary confidence to bulls;
∴ However, repeated retests weaken its authority, showing fragility in momentum if volume does not sustain.
✴️ Conclusion: TEMA9 is immediate support, fragile, requiring reinforcement by volume.
⊢
▦ HMA21 - $116,919.69:
∴ The HMA21 lies under market value, acting as secondary support, confirming alignment with EMA200 as part of the supportive axis;
∴ Its curve is slightly ascending, signaling a faint bullish rebound in the short horizon;
∴ Alignment below price confirms resilience but also dependency - if price collapses, this level could break swiftly.
✴️ Conclusion: HMA21 is secondary support, dynamic yet vulnerable to volatility.
⊢
▦ SMA21 - $119,371.78:
∴ SMA21 sits above current price, working as resistance, in opposition to the supports listed (HMA21/TEMA9);
∴ This creates a compression corridor: TEMA9 + HMA21 (support) vs SMA21 (resistance);
∴ Market structure indicates stagnation inside a tight channel, waiting for breakout or breakdown.
✴️ Conclusion: SMA21 is resistance, framing the price in a boxed range.
⊢
▦ SuperTrend (10, 1.5) - $119,325.29:
∴ The SuperTrend remains above the actual price, signaling a bearish bias;
∴ Market action is still below its trigger, rejecting short-term bullish confirmation;
∴ Only a sustained breakout above this level could alter the bearish sentiment.
✴️ Conclusion: SuperTrend = Bearish stance remains active.
⊢
▦ BB (21, 2) - Upper: $123,154.36 / Basis: $119,371.78 / Lower: $115,589.21:
∴ Price is compressed between the midline (basis) and lower band, showing weakness;
∴ Recent volatility spikes touched the upper band but were rejected, confirming lack of strength;
∴ The narrowing of bands signals imminent expansion - market preparing for stronger volatility move.
✴️ Conclusion: Bollinger = Compression near lower range, potential breakout ahead.
⊢
▦ StochRSI (3, 3, 21, 9) - K: 44.11 / D: 37.23:
∴ Both K and D lines are mid-range, neither oversold nor overbought, reflecting indecision;
∴ The slight upward crossing indicates a possible rebound attempt, but weak until confirmed by momentum;
∴ Position in neutral zone diminishes conviction - signal could reverse quickly.
✴️ Conclusion: StochRSI suggests fragile recovery, neutral-to-bullish bias.
⊢
▦ Volume (21) - 9 / 85:
∴ Current volume is extremely weak compared to the SMA21, showing low conviction;
∴ This volume drought reduces the probability of sustainable breakouts;
∴ Whales or institutions are not actively engaged at this moment.
✴️ Conclusion: Volume shows lack of strength; market drifting without strong participation.
⊢
▦ MACD (9, 21, 9) - MACD: -170.26 / Signal: -425.48 / Histogram: -595.74:
∴ MACD remains negative, showing bearish underlying pressure;
∴ Histogram is contracting, indicating that bearish momentum is slowing down, but not reversed;
∴ A bullish crossover is still distant, weakening bullish recovery chances in near term.
✴️ Conclusion: MACD = Bearish pressure moderating, no reversal confirmed yet.
⊢
▦ RSI (21, 9) - 43.19:
∴ RSI is below 50, confirming bearish bias;
∴ Position not yet oversold, showing market retains room for further downside;
∴ The flat slope reflects indecision - neither strong selling panic nor buying force.
✴️ Conclusion: RSI = Bearish-neutral, momentum still under equilibrium.
⊢
▦ MFI (21) - 43.19:
∴ MFI mirrors RSI levels, confirming lack of strong inflow or outflow;
∴ Volume-weighted money flow confirms market neutrality, slightly leaning bearish;
∴ No divergence spotted to suggest imminent reversal.
✴️ Conclusion: MFI = Neutral, aligned with RSI weakness.
⊢
▦ OBV (21) - 74.89M:
∴ OBV is flat, not rising in accordance with recent small price upticks, showing lack of buyer confirmation;
∴ Absence of strong accumulation suggests price is rising on weak grounds;
∴ If OBV fails to climb, rallies will likely fail at resistance points.
✴️ Conclusion: OBV confirms weak demand, neutral-bearish stance.
⊢
🜎 Strategic Insight - Technical Oracle:
∴ The H4 structure reveals a compressed battlefield: dynamic supports (TEMA9, HMA21, EMA200) try to sustain price above $116K–117K, while layered resistances (EMA50, SMA21, SuperTrend, BB basis) weigh down overhead near $118K–119K;
∴ Volume collapse and flat OBV expose the fragility of bullish attempts, showing lack of participation. RSI and MFI align at ~43, signaling neutrality with bearish tilt. MACD remains negative, albeit moderating, hinting bearish exhaustion rather than reversal;
∴ Thus, BTC/USD stands in tense equilibrium: support corridor anchored near $116K, resistance dome at $119K;
∴ Market awaits volatility ignition, and the Bollinger Band squeeze warns a breakout is imminent;
∴ Without volume, upward attempts risk collapse; with momentum reactivation, resistance layers may fracture.
⊢
𓂀 Stoic-Structural Interpretation:
∴ The chart reveals not strength, but suspension - Bitcoin hovers between its moving average guardians, caught within corridors of compression where price neither collapses nor ascends with conviction;
∴ EMA50 denies passage above, while EMA200 anchors from below - structure is preserved not by will, but by inertia;
∴ Indicators whisper the same tale: RSI and MFI linger at 43, momentum without fire, money without decisive flow;
∴ MACD stays in the shadows, still negative, showing the bear’s hand loosening but not releasing;
∴ OBV remains flat, silence of accumulation, a desert where no buyer’s army marches;
∴ Bollinger Bands coil tighter, warning of the coming storm - when silence stretches, force prepares.
✴️ Stoic Arcane Conclusion: The market does not yield to hope nor despair, it waits - stillness before expansion. To the disciplined observer, this is not chaos, but structure: a narrowing gate where patience is the true weapon.
⊢
✦ Structure:
∴ The H4 battlefield is confined within a narrow dominion - ($116,000 to $119,500) - where supports (TEMA9, HMA21, EMA200) forge the lower bulwark, and resistances (EMA50, SMA21, SuperTrend, BB Basis) construct the ceiling;
∴ Momentum oscillators (RSI, MFI, StochRSI) hover in neutrality, neither signaling exhaustion nor ignition, mirroring the market’s stoic posture;
∴ MACD remains submerged in negative territory, its histogram contracting, a sign of fading bearish strength but absent bullish conquest;
∴ Volume and OBV betray the truth: demand is hollow, accumulation is absent, and rallies lack the blood of conviction;
∴ Bollinger compression seals the chamber, a tightening coil foretelling release - structure bends, not breaks, awaiting its destined expansion.
✴️ Structural Seal: The architecture is one of suspended energy, a locked formation where silence is not weakness, but the breath before eruption.
⊢
· Cryptorvm Dominvs · MAGISTER ARCANVM · Vox Primordialis ·
· Dominivm Cardo Gyratio Omnivm · Silence precedes the next force. Structure is sacred ·
⊢