DeGRAM | BTCUSD rebound from the demand zone📊 Technical Analysis
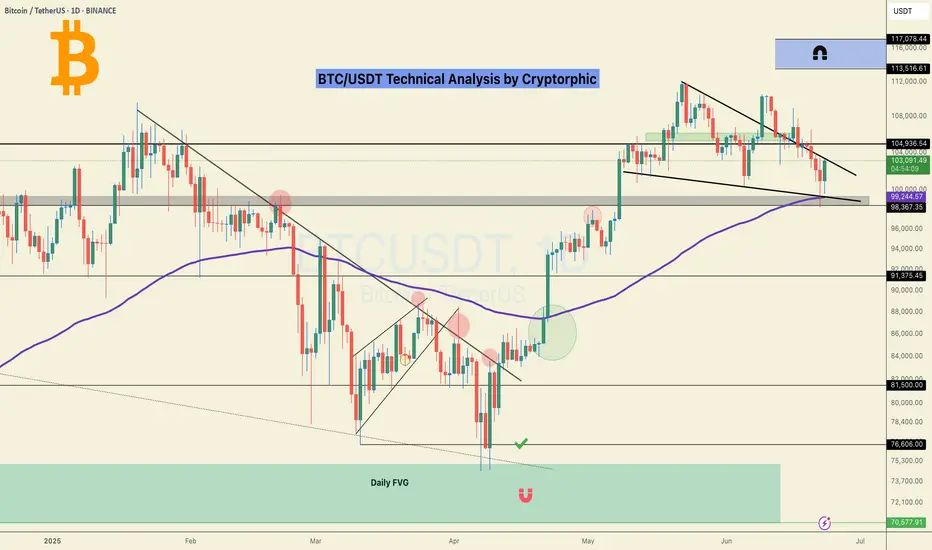
● The BTCUSDT 4-hour chart on KUCOIN highlights a pronounced descending channel, with price action recently rebounding from a well-defined demand zone between 98,000 and 100,000. This green-shaded area has repeatedly acted as a springboard for bullish reversals, as evidenced by the strong wick and immediate recovery after the latest test. The chart also marks a series of lower highs and lower lows, but the most recent price action shows a break in bearish momentum, with a projected zigzag path indicating a potential move toward the 104,970 resistance. The confluence of the lower channel boundary and the demand zone suggests that buyers are stepping in aggressively at these levels, aiming for a retest of the upper resistance band.
● The technical setup is further reinforced by the presence of a major resistance level at 111,977, which has capped previous rallies. The chart’s structure, with its clear trendlines and highlighted resistance and support zones, points to a tactical opportunity for bulls to capitalize on the oversold conditions. The anticipated path, as drawn on the chart, suggests a gradual recovery with intermittent pullbacks, targeting the 104,970 area as the next significant hurdle. The overall pattern indicates that while the broader trend remains bearish, the immediate outlook favors a corrective rally from the current demand zone.
💡 Fundamental Analysis
● Recent fundamentals support the technical case for a short-term recovery. Over the past two days, Bitcoin has experienced heightened volatility due to escalating geopolitical tensions, notably US military action in the Middle East, which triggered a sharp sell-off and flushed out leveraged positions. Despite this, institutional accumulation remains robust, with over $1.2 billion in Bitcoin added to corporate treasuries in the last week, and Texas officially establishing a state-managed Bitcoin reserve. On-chain data shows sustained negative netflows from exchanges, indicating that large holders are moving coins to cold storage, a historically bullish signal. Meanwhile, derivatives data reveals a cautious market, with open interest skewed toward protective puts, but spot ETF inflows and long-term adoption trends continue to underpin the market.
✨ Summary
● BTCUSDT is rebounding from a key demand zone, with technicals pointing to a corrective move toward 104,970. The bullish scenario is supported by strong institutional accumulation and strategic adoption, even as short-term volatility persists. A sustained close above 104,970 would open the path to the 111,977 resistance, while a drop below 98,000 would invalidate the recovery thesis.
-------------------
Share your opinion in the comments and support the idea with a like. Thanks for your support!
Btcusdanalysis

$USDT.D Reversal Incoming USDT.D is facing rejection at key resistance near 5% within a descending wedge.
If the trendline holds, we could see a sharp - 35% drop, a strong bullish signal for altcoins and the possible start of altseason.
DYOR, NFA

Bitcoin Order Book - How To Trade ItBitcoin Order Book Analysis | Massive BTC Liquidity Zones You Need to Watch
In this video, we break down the Bitcoin (BTCUSD) order book and highlight the biggest buy and sell levels currently driving market sentiment. These are the exact price zones where whales and institutions are placing large orders—often creating powerful support and resistance that can trigger breakout or reversal setups.
In This Breakdown:
• Where major buy/sell walls are forming in the BTC order book
• How order book depth can predict short-term price direction
• Real-time liquidity pockets traders are watching now
• Key price levels to watch for possible long/short entries
This is a must-watch if you’re actively trading BTC and want to track where the smart money is stacking their positions.
⸻
Tools Featured:
• BTCUSD real-time chart
• Order book heatmap / depth
• Liquidity zone visualizations
• Volume profile overlays
• Sentiment Tool
⸻
Use this insight to position your trades around high-probability reversal or breakout zones. Comment your BTC target below, and follow for daily pro-level crypto insights.
⸻
#Bitcoin #BTCUSD #OrderBookAnalysis #BTCOrderFlow #WhaleActivity #LiquidityZones #CryptoTrading #PriceAction #CryptoTA #BitcoinStrategy

$BTC Breaks Out $110K in Sight?CRYPTOCAP:BTC has broken out of its descending channel and is now trading around $105K.
This breakout signals a potential trend reversal, with a projected move toward $111K.
Holding above the breakout zone could confirm further bullish momentum.
DYRO, NFA

Is Bitcoin Signaling Risk-Off? Structure Breakdown Explained💥 BTC/USD Outlook – Is Bitcoin Losing Steam? 🧠📉
I'm keeping a close watch on Bitcoin (BTC/USD) this week, and the current price action is flashing some key signals.
🔍 Over the past several sessions, BTC has struggled to hold momentum, and we’re now seeing a shift in tone. On the 4-hour timeframe, the market structure is tilting bearish, with a pattern of lower highs and lower lows developing — a classic sign of weakness ⚠️📉.
📐 The most recent downside leg has caused a clear break in structure, and BTC is now retracing back into a potential supply zone, hovering around equilibrium of the recent move. This zone will be critical to watch for signs of seller re-entry.
⏳ On the 30-minute chart, I’m waiting for a decisive shift in structure — a break of local support or a failed rally that confirms bearish continuation. Should that play out, it could signal a high-probability short setup.
🪙 A breakdown in BTC often has broader implications — especially in the risk asset space. If we see weakness here, JPY pairs may strengthen as capital rotates into safer assets 💴🌐.
⚠️ Disclaimer:
This is not financial advice. The information provided is for educational purposes only. Please conduct your own analysis and consult a licensed professional before making any investment decisions. 📚💼

BTC SHORT TP:97,500 23-06-2025We’re looking at a false bullish spike setup — that means it looks strong, but it’s all smoke.
Shorting between 102,500–103,600, targeting 97,000–97,800 with a solid 3.8 RR.
Timeframe: 4H.
Expected to play out in the next 24 to 30 hours, otherwise invalid.
There’s still a chance of manipulation to the upside, but we’re betting on rejection.
We don’t use indicators, we’re not out here drawing lines or cute little shapes — I just give you a clean trade.

Bitcoin / U.S. Dollar 4-Hour Chart (BTCUSD)4-hour candlestick chart displays the price movement of Bitcoin (BTC) against the U.S. Dollar (USD) as of June 23, 2025, 03:45 PM CEST. The chart shows a recent sharp decline from a peak of approximately 104,443.81 USD to around 100,479.47 USD, with a current price of 102,035.20 USD, reflecting a 1.037.09% increase. Key levels include resistance around 104,000 USD and support near 100,000 USD, with notable volatility indicated by the candlestick patterns and a marked low point adorned with U.S. flags and a lightning bolt symbol.

Bitcoin Crash Will Continue to Levels that will REKT majority!??MARKETSCOM:BITCOIN crashed towards $98k so far! Almost 10% drop so far! Crypto noobs and mass media manipulators will blame this CRYPTOCAP:BTC crash on the Iran and Israel conflict! Professional traders will, however, tell you that this was orchestrated and the crash was already planned beforehand, and the best traders caught the crash from the top at $109k and made a profit on this Bitcoin correction! Professional insider trading against news manipulation, artificial conflicts, and emotional trading !

#BTC Bounced, 100EMA saved the day!100 EMA saved the day.
But the one concern? We’ve printed a new Lower Low, not a great sign.
The chart looks bouncy, but the overall structure still feels uncertain.
No point guessing or forcing trades here, I’d rather wait for clear confirmation.
I’ll share updates if I spot any changes or interesting altcoin setups.
For now, patience is our best edge. I know many altcoins might look great, but BTC Dominance is not yet done. I'll be sharing that chart tomorrow.
Stay sharp.
Hit that like button if you find this short update useful.
Thank you
#PEACE
Bitcoin Crash To $93k Incoming?!!!!I am discussing the bearish signs i am seeing right now on Bitcoin, and talking about the confirmations I want to see, that will confirm that Bitcoin is about to crash down to 93k!!!

Bitcoin Between Conviction and Caution - The Market Suspended?⊢
⟁ BTC/USD – BINANCE – (CHART: 1W) – (Date: June 23, 2025).
⟐ Analysis Price: $101,226.28.
⊢
⨀ I. Temporal Axis – Strategic Interval – (1W):
▦ EMA21 – ($96,740.64):
∴ Price remains above the 21EMA, confirming bullish structural integrity in medium trend;
∴ The slope of EMA21 remains positive, reinforcing sustained market momentum;
∴ Most recent candle printed a higher low above the 21EMA, reaffirming it as dynamic support.
✴️ Conclusion: The 21EMA upholds the current cycle's bullish engine - it is the first invalidation level for any mid-term reversal.
⊢
▦ SMA50 – ($85,002.38):
∴ SMA50 sits considerably below current price, reflecting distance from mean reversion zones;
∴ Market remains extended, but no immediate signs of pullback toward this structural level;
∴ The last interaction with SMA50 was in late 2023, when it confirmed trend resumption.
✴️ Conclusion: SMA50 defines the core mid-range support - no threat to it unless a breakdown accelerates below EMA21.
⊢
▦ SMA200 – ($49,241.87):
∴ SMA200 remains deeply below market, showing that the macro bullish structure remains unchallenged;
∴ Distance from SMA200 reflects the strength and maturity of this cycle’s trend;
∴ Long-term investors remain in profit and structurally supported.
✴️ Conclusion: No macro breakdown as long as price stays well above SMA200 - the secular bull phase is intact.
⊢
▦ Ichimoku Cloud – (Kumo, Tenkan, Kijun, Chikou Span):
∴ Price is trading clearly above the Kumo (cloud), showing sustained bullish dominance;
∴ Tenkan-sen and Kijun-sen lines are positively stacked, with Tenkan still leading;
∴ Chikou Span is above price and cloud, confirming long-term bullish alignment.
✴️ Conclusion: All Ichimoku components confirm bullish control - weakening only upon Tenkan/Kijun flattening or bearish cross.
⊢
▦ MACD – (MACD: 318.17 | Signal: 4,884.24):
∴ MACD line is far below the signal line, though attempting a bottoming curve;
∴ The histogram remains red but with decreasing amplitude - bearish momentum is fading;
∴ No bullish crossover yet - momentum remains negative but weakening.
✴️ Conclusion: MACD suggests waning bearish cycle, but no official reversal signal until crossover and histogram neutralization.
⊢
▦ RSI + EMA21 – (RSI: 57.71 | RSI EMA: 59.39):
∴ RSI remains in bullish territory above 50, although flattening below its EMA;
∴ No bearish divergence observed yet - RSI is consolidating;
∴ If RSI reclaims its EMA, strength may resume; if rejected again, loss of momentum may escalate.
✴️ Conclusion: RSI reflects structural strength, but cautious momentum - monitoring RSI/EMA relationship is critical.
⊢
▦ Volume + SMA21 – (Vol: 2.51K):
∴ Weekly volume remains below the 21-week average, indicating weakening participation;
∴ Last few candles show declining volume despite price stability - possible distribution;
∴ Absence of buyer aggression may limit further upside near-term.
✴️ Conclusion: Volume suggests lack of conviction - momentum exists, but crowd participation is thinning.
⊢
🜎 Strategic Insight – Technical Oracle:
∴ Bitcoin's weekly chart maintains bullish structural posture above all key moving averages, yet momentum indicators reflect hesitation;
∴ The Ichimoku system confirms trend dominance, but MACD and RSI signal that internal strength is not expanding - only sustaining;
∴ Volume contraction reveals market indecision or fatigue, potentially foreshadowing consolidation or rebalancing phases;
∴ Despite no structural breakdown, directional conviction is lacking - further upside demands renewed volume and momentum alignment.
⊢
☍ II - GAP CME – BTC1! – Chicago Mercantile Exchange:
▦ Previous CME Close – ($99,640.00) + Spot Opening Binance – ($100,980.77):
∴ A clear upside gap is present between the institutional close and the retail spot open, measuring approximately $1,340.77, thus defining a latent Magnet Zone for downward pullback;
∴ This CME gap forms a critical vacuum range between $99.640 and $100.980, which will likely act as a liquidity reabsorption zone if spot retraces;
∴ No immediate fill has occurred, suggesting current bullish momentum persists despite latent imbalance.
∴ The latest weekly CME candle closes with a smaller real body and a pronounced upper wick — a classical signal of buy-side exhaustion below macro resistance ($102K–$103K);
∴ Despite the weakening thrust, no breakdown has yet been printed — the bullish structure remains technically intact above previous weekly lows;
∴ Volume prints are non-expansive, indicating lack of conviction among institutional buyers at this level — vigilance is required.
✴️ Conclusion: The CME structure reveals a latent institutional gap magnet to the downside, with price now suspended above an untested imbalance. The technical structure remains constructive but fragile. Further confirmation from the spot market will determine whether continuation or reversion will manifest in the coming cycle.
⊢
∫ III. On-Chain Intelligence – (Source: CryptoQuant):
▦ Exchange Inflow Total – (All Exchanges):
∴ A recent spike in total Bitcoin inflows aligns directly with the $101K zone, signaling increased movement of coins from wallets to exchanges;
∴ Historically, such inflow spikes near local tops indicate preparation for distribution or profit-taking by large holders;
∴ Current inflow levels exceed previous consolidation phases, amplifying the risk of sell pressure activation.
✴️ Conclusion: The market is facing elevated short-term risk from exchange-bound liquidity — inflows confirm readiness to sell into strength.
⊢
▦ Spot Taker CVD – (Cumulative Volume Delta, 90-Day) – (All Exchanges):
∴ The 90-day CVD curve shows clear flattening and early reversal near resistance, indicating a shift in taker behavior;
∴ Passive sell-side absorption appears to dominate, reducing the strength of buy-side aggression;
∴ Price action continues upward while CVD retreats, forming a classic hidden distribution divergence.
✴️ Conclusion: CVD reveals taker exhaustion - without resurgence in spot demand, current price levels are vulnerable to sell-offs.
⊢
▦ Exchange Inflow Mean – (7-Day Moving Average) – (All Exchanges):
∴ The 7DMA of inflow mean remains elevated, suggesting sustained presence of large-sized transactions heading toward exchanges;
∴ This behavior often precedes institutional or strategic sales, especially when combined with total inflow spikes;
∴ No decline in the inflow mean implies continuous preparation for short-term distribution.
✴️ Conclusion: Elevated inflow mean confirms that whales and large actors are preparing or executing strategic exits.
⊢
▦ Funding Rate – (All Exchanges):
∴ Rates across global derivatives platforms remain slightly positive but without speculative imbalance;
∴ The neutral-positive range suggests cautious optimism among traders - not overleveraged, but not afraid;
∴ No signs of euphoric long build-ups, which reduces liquidation risk but weakens breakout fuel.
✴️ Conclusion: A neutral funding environment supports consolidation, not explosive upside — no immediate directional conviction.
⊢
▦ Funding Rate – (Binance):
∴ Binance-specific funding remains tightly aligned with global averages, reflecting no localized distortion;
∴ Positive, stable readings indicate low speculative friction, but also lack of trend-defining aggression;
∴ Historical patterns show that breakout rallies typically require a surge in funding rate — not present yet.
✴️ Conclusion: Binance traders are balanced - not short-squeezed nor euphoric - bias remains neutral until imbalance arises.
⊢
▦ Realized Price – Short-Term Holders (MVRV-STH) – (~$47.5K):
∴ Price trades far above the STH realized price, indicating most recent buyers are deep in unrealized profit;
∴ This dynamic historically increases the chance of sell pressure at resistance zones, especially when inflows are high;
∴ No downward compression or convergence - suggesting strength remains, but realization is a persistent risk.
✴️ Conclusion: STH's are exposed to high profit levels - the market is primed for potential realization, but not structural weakness.
⊢
🜎 Strategic Insight – On-Chain Oracle:
∴ Exchange-based signals (Inflow Total, Mean) confirm active preparation for sell-side flow;
∴ Spot aggression is fading as per CVD divergence, weakening breakout thesis despite strong price structure;
∴ Neutral funding and passive miner/on-holder behavior reflect structural balance - not panic, not euphoria.
✴️ Conclusion: The market rests in a zone of speculative tension - directionally undecided, but operationally sensitive to imbalance triggers.
⊢
⌘ Codicillus Silentii – Strategic Note:
∴ The temporal structure signals resilience, but lacks expansion - technical relief exists without structural thrust;
∴ On-chain flows unveil transactional friction at current levels, with capital cycling toward liquidity zones (exchanges);
∴ Market energy is neither compressed for breakout nor collapsed into capitulation - a state of coiled hesitation;
∴ Asymmetry remains hidden within equilibrium - vigilance, not movement, defines the moment.
⊢
𓂀 Stoic-Structural Interpretation:
▦ Structurally Neutral:
∴ Price holds above key macro supports (EMA21, SMA50), confirming preservation of the bullish superstructure;
∴ Long-term holder behavior and miner flows remain passive - structural integrity is undisturbed;
∴ However, no active thrust or trend validation emerges - the system sustains but does not ascend.
⊢
▦ Tactically Cautious:
∴ Exchange inflows and CVD divergence signal short-term vulnerability near key resistances;
∴ Technical indicators (MACD, RSI, Volume) reflect a condition of deceleration - momentum is reactionary, not foundational;
∴ Until price reclaims volume-weighted levels with confirmation, the posture remains defensive and watchful.
⊢
⧉
⚜️ Magister Arcanvm (𝟙⟠) – Vox Primordialis!
𓂀 Wisdom begins in silence. Precision unfolds in strategy.
⧉
⊢

Bitcoin Bounce Alert: Holding the $100K Fortress! 📉 Market Context & Technical Levels
Key support at ~$100K: As the chart shows and multiple analysts confirm, this level continues to act as a strong defence zone. Cointelegraph noted bulls have been “defending the $100K key support level strongly,” triggering bounces during dips
Descending channel overhead: Bitcoin has retraced into a downward channel. A clean breakout above ~107K–109K (past recent peaks) is needed to signal a bullish shift .
Liquidity target at ~106K: Plenty of orders await in that region—flipping it to support may pave the way for another push higher .
📊 Indicators & Momentum
RSI dip near 25 during the latest drop indicates oversold conditions—often a precursor to rebounds
.
Volume surge on rebounds suggests absorbing sell pressure and strong accumulation interest at lower levels.
🚩 Key Price Zones to Watch
Level Significance
$100K Crucial support; losing it risks a slide toward $95K–97K or even $92K
.
$105K–106K Liquidity zone; flipping here as support could confirm upward momentum .
$107K–109K Resistance from channel tops and prior highs; a successful break is key to next leg up .
$112K–$112K+ If breakout occurs, upside targets extend toward prior ATH near $112K and beyond .
🎯 Chart Analysis Summary
Your chart shows three distinct bounces from the $100K–100.7K supply zone (highlighted in blue) and the latest one includes a sharp wick and rebound. This aligns with broader market dynamics emphasizing support at $100K and building liquidity at $106K. The arrow projection signals a probable retest of ~106K, with room to challenge ~107–109K after consolidation.
🧭 Trade Outlook
Bullish scenario: Hold above $100K → reclaim $106K → trendline breakout → potential rally to $112K+.
Bearish risk: Fails support at $100K → breakdown toward $95K–92K region.
📌 Bottom Line
Support $100K is alive and well. Bounces have been crisp and volume-backed.
Next test lies at $105–106K. That’s the battleground—flip it, and we may see bitcoin reclaim recent highs.
Watch the channel overhead (~107K–109K). A breakout could open the door to fresh records.
✅ Conclusion: BTC is defending its psychological base firmly. If this zone holds once more, the path to $106K and beyond is in focus. Breaking above demands conviction, but it’s the pivot to watch.

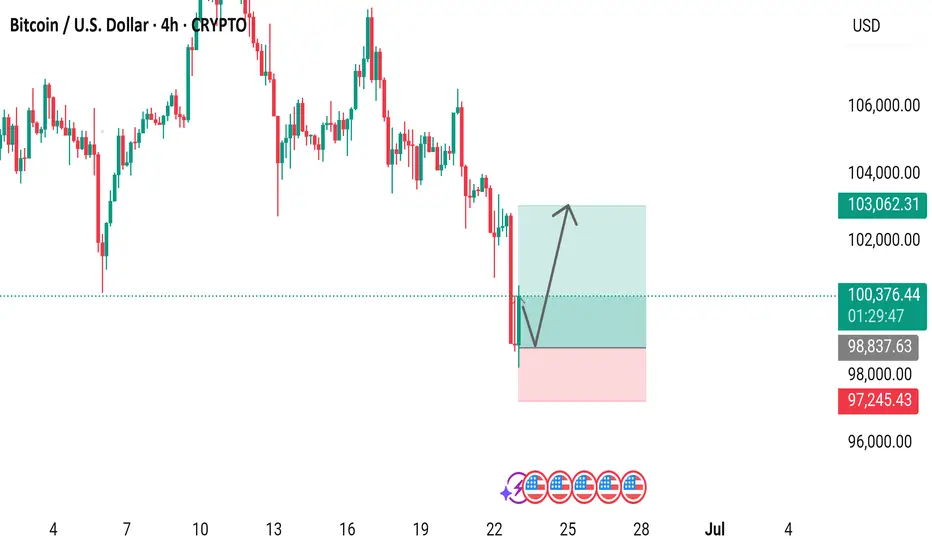
Bitcoin Price Analysis: Potential Rebound Ahead?4-hour Bitcoin price chart reveals a potential rebound opportunity. After a sharp decline, the price has stabilized around $97,245.43, forming a support level. The green and red box annotations suggest a possible price range breakout, with an upward arrow indicating a potential price increase. The current price stands at $100,461.58, down 1.63% from its recent peak. Will Bitcoin bounce back or continue its downward trend?
BTC SHORT TP:-100,000 21-06-2025What if this is the one that nukes it all? 😮💨
I’m entering a short between 102,500 and 103,600, aiming for a target around 99,500 – 100,200, with an average RR of 4.
This is based on the 4H timeframe, and should play out in the next 48 to 60 hours.
The structure still favors bearish continuation. If BTC breaks through the 100k level, we might be staring at a black swan scenario.
Manage your stop according to your risk plan and stay tuned for updates.
We don’t use indicators, we’re not out here drawing lines or cute little shapes — I just give you a clean trade.
If the move doesn’t happen within the estimated time, the trade is invalid.
Bitcoin (BTC/USDT) – Bearish Continuation After Failed Support !Bitcoin attempted to hold the $101,409 support level but failed to sustain above it. The breakdown confirms weakness, and the chart now suggests a continuation of the downtrend if bulls don’t reclaim lost ground quickly.
Technical Breakdown:
Failed Bounce: BTC briefly bounced near $101.4K but got rejected and closed back below the zone.
Bearish Structure: Price continues forming lower highs and lower lows — a clear downtrend.
RSI at 30.34: Close to oversold but still room to fall, which means downside isn’t exhausted yet.
Market Sentiment: Weak hands are exiting, and support zones are getting tested faster than they’re defended.
Key Levels to Watch:
Resistance:
$101,409 – Immediate level, now flipped to resistance
$103,573 – Strong barrier if bulls attempt recovery
$105,807 – Major horizontal resistance and lower high zone
Support:
$97,340 – Next major support zone (possible short-term bounce)
$93,343 – Key level if $97.3K fails to hold
$92,200 – Final support before panic could set in
Trade Idea – Bearish Bias:
Short on Retest Zone: $101.4K – $102K
Stoploss: Above $103.6K
Take-Profit Targets:
TP1: $97,300
TP2: $93,300
TP3: Optional – trail lower if breakdown continues
What Bulls Need to Do:
Reclaim $101.4K fast with a strong close above it on the 4H chart
Otherwise, sellers remain in control
This is not financial advice. Always do your own research (DYOR) and manage your risk accordingly.

#Btc Breakdown Begins: Double Top + Iran-Israel Tensions = CrBitcoin has clearly formed a double top pattern and is currently hanging near the critical 100K support. If this level breaks, we may first see a fall to 90K, followed by a deeper decline toward 73.5K. If that too fails to hold, the market could slide drastically to 64K–45K zones. The pattern indicates Bitcoin is exiting the distribution phase, with profit booking at aggressive levels.
The Iran-Israel conflict, intensified by U.S. involvement, has triggered panic and short positions across the market. This is a high-risk environment, and long entries could be dangerous right now. Caution is advised — we are entering a potentially sharp correction phase.

BTCBTC will be moving sideways and a drop for the next few days.
Disclosure: We are part of Trade Nation's Influencer program and receive a monthly fee for using their TradingView charts in our analysis.

BTC pressure, price under a lot of selling pressure💎 Update Plan BTC weekend (June 22)
Notable news about BTC:
Market overview: Bitcoin's consolidation lasts in the context of increasing macro instability
US President Donald Trump expressed his caution on Thursday when he delayed the decision involving a potential direct attack on Iran for a maximum of two weeks. The global market, including cryptocurrencies, has reacted, slightly increased in Asian and European sessions when investors absorb the impact of crude oil prices in the context of interrupted transport routes.
However, traders are very cautious, reflecting the tough stance of Fed President Jerome Powell on the economy, with the reason for the expectation of inflation in the short term due to tariffs.
Bitcoin -large holders continue to accumulate despite the cautious attitudes of traders on the spot and derivative markets.
Technical analysis angle
Bitcoin price fluctuates around $ 104.057 after cutting up the day from the peak of $ 106,457 of Friday. Main technical indicators, such as relative power index (RSI), strengthen the trend of discounts when the price slip down the average line 50.
Money Flow Index (MFI) indicator, monitoring the amount of money poured into BTC, shortening the trend of increasing, stable around the middle line. This reflects the limited interest in Bitcoin on both spot markets and derivative markets.
If the weakness of the Organizing Committee overshadows the demand on the chain and network activity, supporting the exponent dynamic line (EMA) 50 days at $ 103,169 can be helpful, temporarily absorbing the pressure of selling. Overcoming this level, high fluctuations can accelerate the decline, bringing the main levels, such as EMA 100 days at $ 99,085 and EMA 200 days at $ 93,404, in.
==> Comments for trend reference. Wishing investors successfully trading

$BTC Bounce Targeting $112K?CRYPTOCAP:BTC is trading within a descending channel and has just bounced off the lower support level near $101,400.
If this rebound holds, we could see a push toward $107,000–$ 112,000.
However, it remains in a downtrend, so any upside may face resistance unless the channel breaks with strong volume.

Bitcoin Under Resistance: Neutral Core, Bearish Pressure.⊢
⟁ BTC/USD – BINANCE – (CHART: 4H) – (Date: June 22, 2025).
⟐ Analysis Price: $103,041.65.
⊢
⨀ I. Temporal Axis – Strategic Interval – (H4):
▦ EMA21 – (Exponential Moving Average 21-Period) – ($103,957.85):
∴ The current price is below the 21EMA, signaling weakness in short-term momentum;
∴ The slope of the moving average is negative, reflecting ongoing downward pressure;
∴ Recent attempts to reclaim the level were rejected, reinforcing its role as dynamic resistance.
✴️ Conclusion: The 21EMA acts as an active intraday resistance, and its breakout is a primary condition for any directional shift.
⊢
▦ EMA50 – (Exponential Moving Average 50-Period) – ($104,101.19):
∴ The 50 EMA remains above the price and the 21EMA, confirming a bearish trend alignment over the mid-term;
∴ The widening gap between EMA's suggests a well-established downward trend;
∴ A reclaim of both EMAs is required to revalidate bullish structure.
✴️ Conclusion: The 50EMA stands as a structural mid-term resistance, whose breakout would mark a tactical trend reversal.
⊢
▦ VPVR – (Volume Profile Visible Range) - (75, Up/Down):
∴ The POC (Point of Control) is concentrated around the $104,000 – $105,000 zone, just above the current price;
∴ This region reflects the highest volume concentration and tends to act as passive resistance or a redistribution zone;
∴ There’s a visible volume gap between $100,000 and $102,000, creating vulnerability to rapid price moves.
✴️ Conclusion: Price remains below institutional interest concentration, limiting upside potential unless volume reclaims the POC zone.
⊢
▦ BB – (Bollinger Bands - 20-Period SMA, 2.0 StdDev):
∴ The previous candle tapped the lower band and triggered a technical buy reaction (mean reversion);
∴ The mid-band aligns precisely with the 50 EMA (~$104,100), reinforcing confluence resistance;
∴ The channel shows slight downward expansion, suggesting volatility may continue to favor bears.
✴️ Conclusion: The recent bounce is technical relief; there is no structural reversal unless the price reclaims the mid-band.
⊢
▦ RSI – (Relative Strength Index) – (41.76):
∴ RSI is recovering from oversold territory but remains below the neutral 50 mark;
∴ The absence of a clear bullish divergence with price weakens the reversal thesis;
∴ RSI resistance lines sit between 45 and 50 – key levels that must be breached to confirm relief.
✴️ Conclusion: RSI signals technical relief, but still operates within a bearish zone — no clear evidence of dominant buying force yet.
⊢
▦ MACD – (Moving Average Convergence Divergence) – (MACD: –135.56 | Signal: –539.84):
∴ MACD line is crossing the signal line from below, generating an early bullish reversal signal;
∴ The histogram is contracting on the negative side, showing seller exhaustion;
∴ Readings remain deep in negative territory, requiring further confirmation.
✴️ Conclusion: MACD hints at momentum reversal, though structural validation requires a return to the positive zone.
⊢
▦ VOL – (Volume Bars):
∴ Volume increased significantly during the recent bounce, indicating reactive buyer demand;
∴ However, follow-through volume was not sustained — warning of potential bull trap;
∴ The absence of consistent volume undermines the durability of the bounce.
✴️ Conclusion: Volume shows reactive presence, but lacks sustained confirmation — recovery may be short-lived.
⊢
🜎 Strategic Insight – Technical Oracle:
∴ Bitcoin on the 4H chart is staging a relief move after recent sell-side pressure, yet remains below all key EMAs, under volume-based resistance, and without confirmation from momentum indicators.
∴ The structure is best defined as technical relief, not a confirmed trend reversal.
⊢
∫ II. On-Chain Intelligence – (Source: CryptoQuant & BGeometrics):
▦ Exchange Inflow Total - (All Exchanges) = (Latest Spike Zone ~103K):
∴ A recent uptick in Bitcoin inflows to exchanges is visible at local price levels, aligning with prior rejection zones;
∴ Increased inflows suggest potential intent to distribute, especially at resistance;
∴ Historically, such inflow patterns precede local price weakness or continuation of retracement.
✴️ Conclusion: Exchange inflow data warns of potential short-term sell pressure, supporting a cautious outlook near current levels.
⊢
▦ Funding Rate – (Binance Perpetual) – (Near Neutral to Slightly Positive):
∴ Current funding rates remain slightly positive but balanced, reflecting lack of directional conviction from leveraged traders;
∴ The absence of aggressive long bias reduces the risk of long squeezes but also suggests weak bullish momentum;
∴ Historically, neutral funding rates precede volatile expansions when followed by imbalances.
✴️ Conclusion: Funding rate indicates a neutral sentiment posture - not bearish, but lacking speculative bullish fuel.
⊢
▦ Open Interest – (All Exchanges) – (~$33.2B):
∴ Open Interest is elevated, marking one of the highest levels since April;
∴ The price is falling while OI remains high - a classic divergence signaling potential liquidation risk;
∴ This setup increases volatility probability and indicates the market is loaded with directional exposure.
✴️ Conclusion: Open Interest suggests a high-risk environment; either a cascade of liquidation or a sharp reversal is imminent.
⊢
▦ Realized Price – (Market: $103K | Realized: ~$47.5K):
∴ The gap between market price and realized price is vast, reflecting that most market participants are sitting on large unrealized gains;
∴ This positioning exposes the market to profit-taking impulses;
∴ The lack of compression between these metrics implies no capitulation is underway.
✴️ Conclusion: Market remains well above realized cost basis, implying latent sell-side risk and no evidence of fear-driven exits.
⊢
▦ UTXO Age Bands – (Realized Price by Age = 6m–3y clusters above $90K):
∴ Long-term holders (6m–3y) maintain positions well in profit, with realized values near or above $90K;
∴ No major movement from these cohorts detected — suggesting continued conviction or strategic dormancy;
∴ Younger UTXO bands are positioned lower, indicating recent accumulation remains underwater.
✴️ Conclusion: No signs of distribution from experienced holders — current structure favors hodler passivity, not capitulation.
⊢
▦ Miner Outflows – (Miner Transfer Volume Stable):
∴ Miner outflows remain stable, with no sharp spikes in transfers to exchanges;
∴ Implies no immediate operational selling pressure from mining entities;
∴ Miner behavior remains conservative, awaiting directional confirmation.
✴️ Conclusion: Miners are currently not a source of sell pressure, reinforcing structural equilibrium in supply flow.
⊢
🜎 Strategic Insight – On-Chain Oracle:
∴ The on-chain structure supports a technically vulnerable, yet fundamentally intact market; ∴ ∴ Exchange inflows and high Open Interest signal short-term caution, while the lack of miner selling, stable long-term holder behavior, and distance from realized price all point to no deep structural breakdown;
∴ Expect heightened volatility with directional resolution dependent on external catalysts or spot-driven pressure.
⊢
⌘ Codicillus Silentii – Strategic Note:
∴ Temporal framework reveals local reactive strength, but lacks structural realignment;
∴ On-chain flow warns of directional tension - neither resolve nor breakdown confirmed;
∴ Macro environment holds liquidity in suspension, awaiting a trigger;
∴ All vectors align under strategic ambiguity - stillness is not stasis, but anticipation.
⊢
𓂀 Stoic-Structural Interpretation:
▦ Structurally Neutral:
∴ The broader structure is intact - no systemic breakdown, yet no resumption of trend authority;
∴ Exchange inflows and high OI generate latent fragility, despite holder and miner resilience;
∴ The system holds - but without forward thrust, the architecture is stable, not ascendant.
⊢
▦ Tactically Cautious:
∴ Technical signals show reaction, not reversal - EMA's remain unbroken, volume is passive, RSI is capped;
∴ On-chain risk (inflows, OI) outpaces confirmation of strength;
∴ Action without structure is speculation - the trader must remain coiled, not extended.
⊢
⧉
⚜️ Magister Arcanvm (𝟙⟠) – Vox Primordialis!
𓂀 Wisdom begins in silence. Precision unfolds in strategy.
⧉
⊢

BTCUSDT - major support, Cut n Reverse Area??#BTCUSDT... market just r ached at his one of the most expensive area of the week and month
Keep close 101200
That is our ultimate supporting area.
Note: below 101200 we will cut n reverse on confirmation.
Good luck
Trade wisely

Bitcoin (BTC/USDT) – Bearish Breakdown in Play (4H)BTC has lost key support at $103,573 on the 4-hour timeframe, breaking down from the recent consolidation zone. The rejection from the lower highs and weakening RSI suggest more downside pressure ahead.
Technical Breakdown:
Support Broken: $103,573 (now acting as resistance)
Current Price: $102,246
Next Key Support Zones:
$101,410 (short-term bounce zone)
$97,340 – critical horizontal support
$93,343 – potential deeper flush area
Resistance to Watch:
$103,573 (retest = short opportunity)
$105,807 (major rejection zone)
Short Setup (Signal Style):
Short Entry: ~$103,500 (if retested)
Stoploss: Above $105,800
Targets:
TP1: $101,400
TP2: $97,300
TP3: $93,300
Final Note:
Trend remains bearish below $103.5K. Bulls need to reclaim that level fast or further downside becomes likely.
Not financial advice. DYOR.

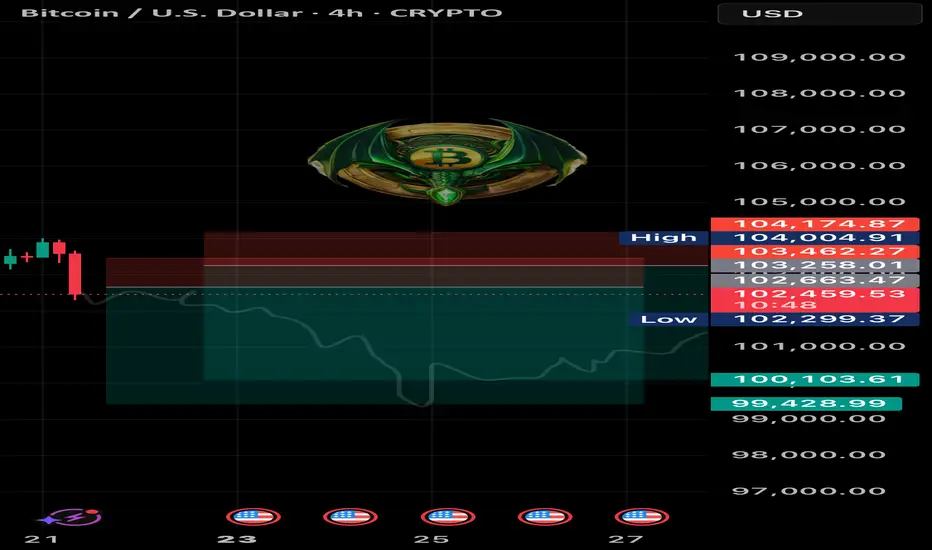
Bitcoin / U.S. Dollar 2-Hour Chart (BTCUSD)2-hour chart displays the recent price movement of Bitcoin (BTC) against the U.S. Dollar (USD), showing a current price of $102,459.21 with a decline of $853.19 (-0.83%) over the period. The chart highlights a significant drop from a peak near $105,898.45, with a shaded area indicating a potential support zone between $101,682.19 and $99,732.49, and a resistance level around $103,000. The timeframe spans from 9:00 to 29:00, with technical indicators and price levels marked for analysis.
