BITCOIN - Clear bearish sign!Bitcoin is currently forming a clear corrective pattern — a rising wedge that has broken downward, retested the breakdown, and is now continuing a gradual decline.
This correction is expected to bottom around the $85K level, after which Bitcoin will likely enter a consolidation phase, form new structures, and we’ll keep updating the outlook as new developments occur.
Also, note that the EMA 25 just crossed below the EMA 50, forming a death cross — a bearish signal.
You can consider entering a short position from here, but keep your leverage low and wait for a slight pullback before entering the trade.
Many people won’t like what I’m saying — they’ll tell you “Bitcoin is heading to $200K!” — but that’s just the nature of the market. Everyone sees what they want to see.
Corrections, retracements, and emotional reactions are all part of the cycle. The smart ones are those who read the structure, not the hype.
Best Regards:
Ceciliones🎯
Btcusdanalysis

BTCUSD SHORT Jan.1 You try, 2026. jan 1. Short position
Target 1
Target 2
Target 3
check out my profile!
Easy!

btc on buy reverse#BTCUSD we await price to drop below 107851 to buy, which will retrace back 110150.
Buy limit at 107851, target 109533-110150, stop loss 106900.
Below 106800 holds continuation on sell target 103k

Bitcoin Daily Analysis – October 22, 2025🟠Bitcoin remains in a phase of uncertainty, with market sentiment heavily influenced by global macro events. Developments around interest rate decisions, U.S.–China tariff policies, and ongoing geopolitical tensions in the Middle East could all play a decisive role in shaping Bitcoin’s next move.
🕰️ In this phase, patience is the key to success — avoid rushing into large positions until we see clearer confirmation of trend direction and market risk appetite.
🎯 Until the broader trend becomes more defined, traders can take advantage of short-term long and short triggers on lower timeframes, while maintaining strict risk management and discipline.
Disclaimer:
This content is for informational purposes only and does not constitute financial or investment advice. © DIBAPRISM
Larry D.Kohn

BTCUSDT — at Edge of the Trend: Bullish or the Next Bear Trap?Main Narrative
Bitcoin is standing at a critical crossroads. After a deep correction from the 126K peak, the price is now forming a Symmetrical Triangle Pattern — a classic setup that appears when the market holds its breath before a major move.
Pressure from both sides — a descending resistance from sellers above and an ascending support from buyers below — is squeezing the price closer to the apex, the point where a decisive breakout becomes inevitable.
The next movement will decide whether the bulls regain control or the bears reclaim dominance.
---
Pattern & Structure Analysis
This triangle has formed after a strong downtrend, signaling a phase of consolidation and uncertainty.
There was one false breakout to the upside (yellow ×) — a typical liquidity trap where market makers lure buyers before pulling the price back inside the pattern.
Currently, Bitcoin remains trapped between:
Descending resistance (upper yellow line): around 110K–112K
Ascending support (lower yellow line): around 106.7K
This is a pressure zone — the longer the price stays inside, the more explosive the breakout will be once it happens.
---
Key Levels
Main Resistance: 110K – 112K (breakout zone)
Primary Support: 106.7K (bulls’ last stand)
Secondary Support: 103.6K and 102.1K (critical continuation zone)
Bullish Targets: 116K–118K (retest of previous resistance), and up to 126K if momentum expands
Bearish Targets: 103K → 102K → potential breakdown continuation below 100K if selling pressure dominates
---
Bullish Scenario — “Real Breakout or Just Another Trap?”
If the 4H candle closes above 112K with strong volume confirmation:
Buyers regain short-term control.
First target lies around 116K–118K (prior supply zone).
Sustained momentum could lift the price back toward 126K — the previous major high.
However, without volume confirmation, any breakout could turn into a second fake rally, often followed by a sharper decline.
---
Bearish Scenario — “Support Break = Bearish Continuation”
If the price breaks below 106.7K, confirmed by a strong 4H close and rising sell volume:
The breakdown could drive the price toward 103.6K, then 102.1K.
A confirmed close below 102K may trigger panic selling and open a path toward the next psychological zone below 100K.
In this case, the triangle would represent a continuation pattern, not a reversal — signaling further downside.
---
Market Psychology
This chart perfectly reflects a battle of patience between buyers and sellers.
The longer the consolidation lasts, the more energy builds up behind the next move.
Experienced traders know: long consolidations often end with violent breakouts.
---
Strategy & Key Notes
Wait for a confirmed 4H candle close beyond the triangle with strong volume.
Breakouts without volume = traps.
Keep position size small until direction is confirmed.
Enter only after a successful breakout retest to reduce risk exposure.
---
Conclusion
Bitcoin is entering a decisive phase.
A confirmed breakout above 112K could ignite a bullish run toward 116K–126K,
while a breakdown below 106K would confirm that the market is leaning back into a bearish phase.
This isn’t just another triangle — it’s a critical point that will define the medium-term trend for Bitcoin.
---
#Bitcoin #BTCUSDT #CryptoAnalysis #Breakout #TechnicalAnalysis #TrianglePattern #BTC #CryptoTrading #CryptoMarket

BTC-----Buy around 107400, target 109000 areaOctober 22nd BTC Contract Technical Analysis:
Today, the large-scale daily chart closed with a medium-sized negative candlestick pattern. The candlestick pattern showed consecutive positive lines with a single negative line, but the price was below the moving average. The accompanying indicator formed a death cross, and yesterday's closing line had a long upper shadow. Therefore, based on the trend pattern and trend structure, the overall downward trend is still dominant and obvious. Trading should remain short-term, as we are engaged in short-term contract trading. What matters is the success rate and accumulation of profits. We must not mistake the direction. The short-term hourly chart showed a high early morning price rise and then a pullback under pressure. The current candlestick pattern shows a series of negative lines, but the price is near the low support level, so it is not appropriate to sell directly during the day. Watch for a break of the 107,400 area. If it does not break, you can try to buy, with a stop loss at the 106,800 area and a target of 109,000. Real-time trading is based on the real-time intraday trend.

BUY BITCOIN BTCUSD - Low risk high rewardBitcoin experienced a big drop to the downside but it nows has clear signs of bullish movement ahead. There is currently a head and shoulders pattern forming which has given us high confidence that it will head to the upside. BUY NOW!

Momentum Revival Near Support – BTCUSD Swing SetupBitcoin rebounded sharply from a defined support zone, showing renewed buyer strength after a period of consolidation. The recent bullish candle closing above short-term resistance suggests that momentum is shifting toward the upside, hinting at a possible continuation toward the next resistance zone.
Key Levels:
Buy Entry : Around 109,400
Take Profit: 111,260
Stop Loss: 108,950
Reasoning:
The structure highlights clear support confirmation at the lower boundary, where price previously rejected multiple times, forming a base for potential recovery. The break above the resistance channel and transition from red to green cloud on the indicator suggest improving trend strength. Volume spikes near reversal levels support bullish sentiment. If momentum sustains, price could target the higher resistance zone around 111,000.
Disclaimer:
This analysis is shared for educational and informational purposes only. I

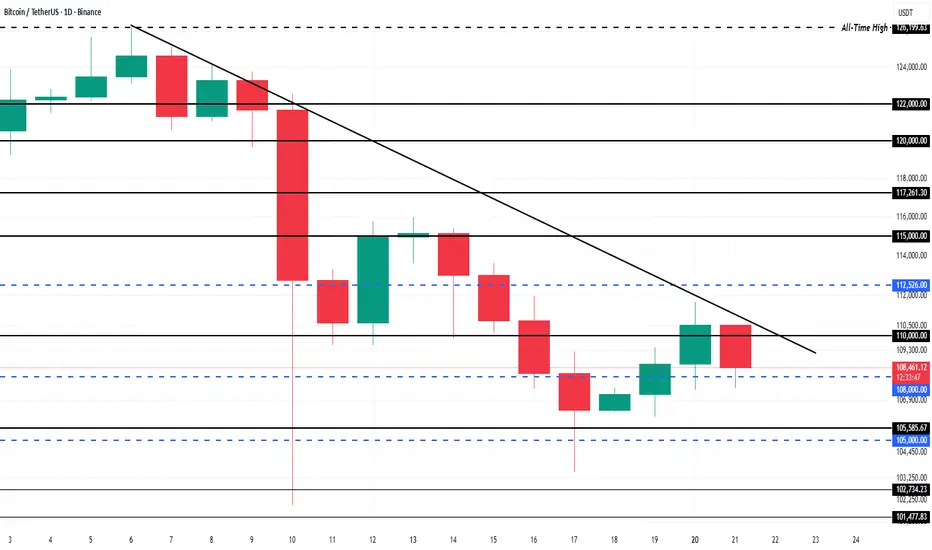
Bitcoin Nears Capitulation As Price Fails To Breach DowntrendAt the time of writing, Bitcoin trades at $107,734, holding below the $108,000 resistance. The crypto giant has repeatedly failed to break the two-week downtrend line, signaling weakening momentum and growing skepticism among investors.
The formation of lower lows this week is concerning. If Bitcoin cannot reclaim the $110,000 psychological level, the price could slip further toward $105,000 or even lower, amplifying selling pressure. Sustained bearishness could accelerate this move, pushing BTC into deeper correction territory.
However, if Bitcoin manages to regain $110,000 as support, the technical outlook could improve sharply. This would invalidate the downtrend and open the door to a move toward $112,500 and possibly higher. In that case, short-term recovery would be back on the table, but for now, caution remains the dominant theme across the Bitcoin market.
BTCUSD - Sideways / Down Movement Leading to AltsznIt may be time for alts to shine.
I dont think price for BTC will reach the red area this bull run
The action for BTC may move sideways for awhile, this is the time when alts usually pump.
From there I expect movement back to the green buy zone, a retest of the prior ATH last Bullrun.
Daily chart here.

XAUUSD on verge[ will again buy] Targeting $5500XAUUSD holding the trendline on D1& H4 from 4270- 4245 zone after the implusive drop. Market is drop after rejecting from Double Top ATH.
What are my conditions For Today's session?
Currently i took buy trade from 4265 zone as bait ,I'm expecting H4 and H1 Candle closing will be above 4270 and on retest then market will left again.
✳️Secondly my last buying area will be around 4245-4250 if H4 remains above trendline on that time.
Targets: 4310- 4345-4370
Additional Tip:
Keep in mind H4 closed below 4245 then stay away from Buy AND Keep watching drop towards 4080 in extension
I will buy in Dips and my Ultimate next target on long run is 5500.

BTC- YESTERDAY VS TODAY::! #Bitcoin - yesterday outlook vs today... 🔥
Hard time for bulls 🚨
My bias remain the same:
🔸Bullish monthly outlook; but:
🔸OverExtand trend HTF, Unstable area subject to a bearish correction.
🔸Bearish correction weekly / Monthly phase📉
--> 🎯
🔸Bearish breakout & retest daily ✅
under 114,200$! 📉
🔸Bearish channel structure H1 - H4 (inside the cylinder pattern)?
At the moment, the daily / weekly uptrend is holding, but in case of bearish break, we could see a sharp drop toward 88,000$ or even 72,000$ (50% fib).
Monthly view = bullish, following the bullish path, a safe correction toward 88,000 - 92,000$ would be good for bulls. (following by bull reaction).
Short term outlook:
Following my lines & the bearish channel structure It looks like CRYPTOCAP:BTC price is gonna dump toward the 102,000$ or 100,000$ lower key support next. 📉
Bulls must push above 115,800 - 116,000$ to remain in, safe control!

Bitcoin to 100k and below?!Looks like COINBASE:BTCUSD after reaching 110k level (As expected in the previews post) is now heading towards 100k level and we have to wait for market what after that.
If you are selling make sure to manage your trade. Any break above 111,700 will give us a big corrective structure upwards.
WTW 4 Golder Rules:
1) Do not jump in
2) Do not over risk/trade
3)Do not trade without Stop Loss
4) Never ever add to a losing position!
Trade with care
We Trade Waves
WTW Team
Disclosure: We are part of Trade Nation's Influencer program and receive a monthly fee for using their TradingView charts in our analysis.

Bitcoin rebound shortBitcoin's intraday market is under pressure and has retreated. Bullish sentiment has weakened, and prices are testing downwards. Currently trading at 119.6K, this correction has already wiped out the intraday gains, and the short-term support level of 110K has been broken. Looking at the hourly chart, the rebound is under pressure again, signaling a short-term correction. There is a risk of further price declines, so be prepared. The current trend is biased downward, so short positions on rallies are recommended. Focus on short-term resistance at 111.2K above, and support at 106.4K below.
If you're feeling lost and unsure about the market, follow my updates and channel. I'll provide daily updates, including details on long- and short-term trade execution. If you're interested, please share your current positions and we can analyze whether it's safer to hold on or adjust and change your positions.

BTCUSD: Waiting for EMA pullback and bullish setupBITSTAMP:BTCUSD Analysis – October 20, 2025
Overview:
After a strong drop to the 103,600 area, BITSTAMP:BTCUSD is showing a solid recovery momentum. Price has broken out of the previous accumulation range and made a pullback, but the early buying opportunity has already passed.
Trading Plan for Today:
Currently, price is approaching a previous key resistance level—a critical zone to watch for reaction.
The main strategy is to wait for a pullback toward the EMA zone and look for a confirmed buy setup based on one of the following patterns:
DD (Double Doji) – indicating a potential pause and reversal.
SB (Second Break) – confirming continuation of the bullish trend.
Alternative Scenario:
If BTC continues to rally strongly without a pullback and breaks above the key level.
It’s better to stay on the sidelines rather than chase the move.
Avoid FOMO when the market doesn’t offer a clear setup — patience usually brings higher-probability entries.
Daniel Miller @ ZuperView

Bitcoin Extends Recovery Buyers Stay in ChargeBTCUSD is showing renewed buying interest after rebounding from support near 110.800. The market structure remains bullish on higher timeframes, with price action indicating strength toward the next resistance area around 112.500 — suitable for a swing continuation setup.
Key Levels:
Buy Entry: 110.800
Take Profit: 112.500
Stop Loss: 110.000
Reasoning:
Technically, BTCUSD remains above key moving averages, with higher lows confirming bullish control. A strong recovery candle from support adds confidence to short-term upward momentum.
Fundamentally, Bitcoin sentiment stays positive as investors position ahead of U.S. inflation data, while reduced risk aversion and steady institutional inflows continue to support crypto demand.
Disclaimer:
This content is for educational purposes only and not financial advice. Trade at your own risk and follow your individual plan.

BTCUSDT — Decision Zone: Continuation or Major Correction Ahead?Bitcoin’s 2-Day chart (Bitstamp) is now approaching a critical macro zone — the $106,000–$101,000 support block, which acts as the last stronghold for bulls in this current uptrend.
This area represents a confluence of horizontal support and the main ascending trendline that has guided price since late 2024.
If buyers can defend this zone, Bitcoin could still experience one final leg up toward the cycle top.
However, a decisive breakdown below it would confirm the start of a major structural correction.
---
Structure and Pattern
Primary Pattern: Rising Wedge / Ascending Channel
The pattern indicates weakening bullish momentum — each higher high forms with less strength.
Such formations often end with a sharp breakdown once the support line fails.
Key Levels:
Support zone (yellow block): $106K – $101K
→ Confluence of trendline and horizontal support.
Immediate resistance: $116,500
Upper liquidity zone / cycle top target: $126K – $128.5K
---
Bullish Scenario — “The Final Push”
If Bitcoin successfully rebounds from the $106K–$101K zone, it could trigger the last upward wave toward $126K–$128.5K, potentially marking the final phase of this bull cycle.
Bullish Confirmation:
2D candle closes above $110K–$112K
Formation of a reversal pattern (hammer/pin bar) with increasing volume
Momentum indicators (RSI/MACD) start to turn upward
Upside Targets:
Target 1 → $116,500
Target 2 → $126K – $128.5K
Macro Narrative:
A bounce from this zone would likely lead to the final euphoric rally before distribution begins.
---
Bearish Scenario — “Breakdown of the Cycle”
If Bitcoin closes a 2D candle below $101K, the bullish structure will officially break down, confirming the start of a major correction phase.
This would validate the rising wedge pattern and shift momentum entirely to the bears.
Bearish Confirmation:
2D close below $101K
Failed retest around $104K–$106K
Rising selling volume
Downside Targets:
Target 1 → $92,500
Target 2 → $75,500
Macro Narrative:
A breakdown below $101K would mark the end of the bull market and the beginning of the re-accumulation phase below $90K.
---
Conclusion
Bitcoin is standing at its macro decision zone: $106K–$101K.
This range will determine whether we get one final bullish push — or the start of a major correction.
Holding above → potential rally toward $126K–$128K
Losing support → possible drop toward $92K–$75K
The next 2D candle will decide the macro direction of Bitcoin — continuation or collapse.
---
#Bitcoin #BTCUSD #BTCAnalysis #CryptoMarket #TechnicalAnalysis #PriceAction #SupportAndResistance #RisingWedge #BTCUpdate #BitcoinOutlook #CryptoTrend #MarketStructure #BitcoinChart #BTCOutlook

Pay attention to the Payment Innovation ConferenceOn October 21, the Federal Reserve will hold a payment innovation conference that could rewrite the industry landscape, inviting top cryptocurrency companies such as Chainlink, Circle, and Coinbase to its Washington headquarters. This conference precisely targets the core players in the entire chain of stablecoins, infrastructure, and trading terminals. However, it is worth noting that if the meeting only discusses the direction without details, the BTC market may pull back in the short term.
Looking at technical indicators, the short-term MACD has broken through the signal line, reflecting a bullish change, but the divergence signal of the RSI may foreshadow a short-term pullback. Based on the above information, BTC is likely to experience a short-term correction followed by an upward trend. Focus on the lower levels of 109,700-109,300 in the short term, with key support at 107,500-106,500. Above this level, focus on the short-term resistance levels of 111,000-112,000. A break above this resistance level could lead to a move towards 114,000-115,000.
BITSTAMP:BTCUSD

BITCOIN SIGNAL: HUGE WHALE GETTING READY TO DO THIS NOW!!(scary)Yello Paradisers, enjoy the video!
And Paradisers! Keep in mind to trade only with a proper professional trading strategy. Wait for confirmations. Play with tactics. This is the only way you can be long-term profitable.
Remember, don’t trade without confirmations. Wait for them before creating a trade. Be disciplined, patient, and emotionally controlled. Only trade the highest probability setups with the greatest risk to reward ratio. This will ensure that you become a long-term profitable professional trader.
Don't be a gambler. Don't try to get rich quick. Make sure that your trading is professionally based on proper strategies and trade tactics.

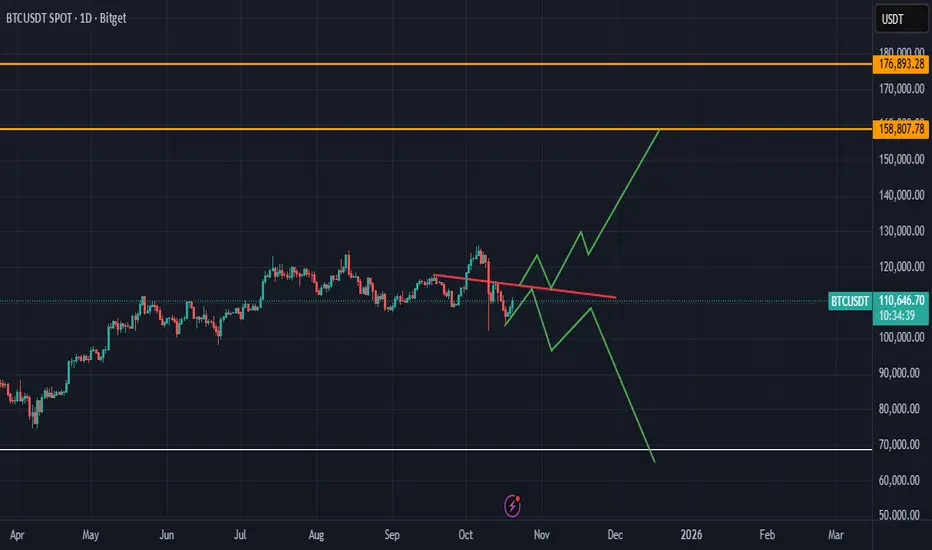
Bitcoin: Possible Scenarios on the Daily Chart🔴 Watch the red line!
If BTC breaks above — bulls take control.
If not — expect another drop.
Always manage your risk around reversal zones! 💥
#Bitcoin #BTC #Crypto #BTCUSD #CryptoTrading #TradingSetup #DailyChart #PriceAction
BUY BITCOIN - BTC/USD- Amazing low risk high reward trade!Based on our deep analysis we can see that BITCOIN (BTC/USD) will head to the upside. Great time to BUY - it has broken POWERFUL resistance levels and is also being held by powerful support levels which it can't break through. Target is next resistance level - buy now!

Bitcoin Market Analysis – October 20, 2025⚡️Welcome back to today’s Bitcoin analysis.
The trigger we discussed in the previous update has been activated, and the V-pattern we’ve been talking about throughout the week has finally formed, confirming the expected reversal structure.
🚀As mentioned earlier, the overall trend remains bullish, and once we see a clear stabilization above the 111,000 and 113,000 zones, it will serve as confirmation of our bullish continuation scenario.
📈The 111,000 zone could also provide another entry opportunity for those who missed the long setup around 107,000 — as long as the structure holds and buyers continue to defend this level.
🌕At this stage, it’s important to wait for fundamental confirmation.
If the broader market sentiment turns risk-on, Bitcoin could easily push toward new upside targets in the coming sessions.
---
> Disclaimer:
This content is for informational purposes only and does not constitute financial or investment advice. © DIBAPRISM
Larry D.Kohn

#BTC Update:- Are we going lower? Or Higher? Don't miss this!Before jumping into the chart, I’ve got a few words for everyone.
The recent crash has been absolutely brutal. It’s shaken the entire market and, sadly, affected so many lives; some people lost everything, and some couldn’t handle the pain. My heart truly goes out to everyone who suffered. 💔
But remember, the past is behind us. What really matters now is what we do today and how we build our tomorrow.
No one was spared from this storm. It felt like a broad daylight robbery, and if you got hit too — please, stay strong. Don’t give up. Sometimes the market resets itself in the harshest ways to prepare us for the next big move.
Take SUI for example, a solid project that would normally take 6–9 months in a bear market to drop 85%, yet it did that in one single daily candle!
From $3.71 to $0.5597, that’s an 84.9% dump in just one day.
And the worst part? Most people couldn’t even catch those prices because exchanges went crazy.
👉 Moral of the story: It’s not over. Far from it. This might just be the reset we needed before the next leg up.
### Now, about the Bitcoin chart:
BTC crashed hard, but guess what? It bounced right off the support.
That’s a strong sign.
The blue EMA you see on the chart is the 200 DEMA, another bullish signal that tells us there’s still strength in the market.
Keeping it short and simple, we’re likely heading higher from here.
Invalidation: A daily break and close below $103K.
---
I’ll be sharing more altcoin charts soon, so stay tuned.
And to everyone reading this, stay strong, stay grounded, and remember… WAGMI 🙌
We’ve been through worse, and we’ll come out of this even stronger.
If this message resonated with you, don’t forget to hit that ❤️. Let’s keep spreading positivity in this space.
