BTCUSD Weekly | Smart Money PerspectiveTrend : Bullish inside long-term uptrend channel.
Key Zones:
Lower (Demand): 108k → Watch for reversal
Mid (Resistance): ~ 120k → Break & retest
Upper (Target): ~ 140k → Take-profit
Path: Dip → higher low → break → continuation ↑
Tip: Trade the reaction, not the prediction
⚠️ Disclaimer:
This is educational content only. Not financial advice.
Trade at your own risk. Always use proper risk management.
Btcusdanalysis

Bitcoin - Losing MA200 SupportBitcoin has just shown a technical warning sign — for the first time since April, 3 daily candles have closed below the 200-day moving average (MA200). This signals a potential shift in trend and raises the risk of a deeper correction.
⸻
🔹 Current View
• BTC is trading around $107,600, struggling to reclaim the MA200 (~$107,700).
• The price had been moving inside a purple rectangular range since July, consolidating between roughly $107K and $123K.
• On October 17th, BTC broke below that rectangular range, confirming a range breakdown and increasing bearish momentum.
• Both the 50 SMA and 100 SMA are now above price, adding downward pressure.
• The RSI sits near 38, showing weakening momentum and potential continuation to the downside.
⸻
🔹 Key Levels to Watch
• Immediate Resistance: $114,000–$115,000 (50 & 100 SMAs)
• Next Supports: $104,000 → $96,000 → $88,000
• A move toward $88,000 would align with the long-term trendline support and could form a strong accumulation zone before the next major rally.
⸻
🔹 Outlook
As long as BTC remains below the MA200 and outside the previous range, the short-term trend is bearish.
However, this correction could present a great buying opportunity for long-term investors once key supports are tested.
⸻
🧠 “Breaking below the MA200 and losing the range often signals weakness — but it’s where long-term setups are born.”
📜 Disclaimer : This is general information only and not financial advice. Always do your own research before investing.

BITCOIN HIGH PROBABILITY SETUP SOON!!!🚨 BTC HIGH PROBABILITY BUY SETUP 🚨
* Here We Can See Clearly The Next Potential Moves For BTCUSD Coming Hours/Days.
* Keep Your Eyes Close On Your Trading Positions.
* Happy PIP Hunting Traders.
FXKILLA.

Bitcoin dominance showing a VERY different market cycle BULLSIH
As ever.yjr chart says it all but why am I posting this on a Saturday night in Europe ?
Because something is going to change soon.......and I have no idea in which direction BUT.............
As you can easily see, in the previous 2 cycles on this chart, were we had a tangible Bitcoin dominance over other crypto assets, that dominance fell dramatically as we approached Bitcoin All time highs after Bitcoin Halvings.
As we see, for the 2017 BTC ATH, we had a 61% drop in BTC.D and then a recovery to the next halving.
From that Halving to the next ATH in 2021, we had a near 37% Drop in BTC.D
Many people, including me, have been saying how different things are this cycle and this is shown very clearly with the BTC.D this cycle.
Just see the difference on the chart. Since 2023, a slow, steady, near unstoppable climb
And IF the current ATH in BTC is the Cycle High, then we need to see that BTC.D is NOT in a negative number but is in fact OVER +5% higher than when the halving took place.
YES, we have had a drop from a higher % to this current level but it is NOTHING as much as previous cycle.
SO, the question is now, Is this the Cycle TOP ?
We will not know until the moment has passed. but even to see a -30% would see Bitcoin entering a price range that is HIGHLY unlikely now.
It is the Failure of the ALTS to take peoples money that has led to this and the reason for this is simply that BITCOIN is now regarded as a Real, proper asset class.
It has Matured.
It is utter DOMINANCE over its Rivals.
So, what now ?
We wait and see if we are entering a BEAR Market, in which case, the ALTS have had their day and sadly, will dwindle away and some will remain, fighting each other for a small part in the Market. Some WILL Dominate others and I think we all know which they are.
Maybe things will move and money will flow out of BTC into ALTS...but we have already past the time period where this has happened after a halving.....
When BTC enters a Bear, so do the ALTS>.
Maybe we will not see a BEAR this Time.
Things ARE different on so many fronts......
But ask yourself......Can you see the corporations selling 100's of Bitcoin now or after we see antoehr ATH ?
That would maybe reduce BTC dominance over other assets in Crypto...but -30% ?
NO WAY

BTC/USD: Potential Bearish Continuation After Support BreakKey Technical Observations
Prior Consolidation and Support: The price appears to have been trading within a range, with a significant support level identified around $109,000 to $110,000 (marked by the lowest horizontal black line). This level had been tested and held multiple times, particularly throughout late August and September.
Support Break: A large bearish candlestick (red) recently broke decisively below this key support level. This is a strong technical signal indicating that the bears have taken control and that the prior consolidation range is over.
Setup for a Short Trade (Short Entry): The chart illustrates a classic "break and retest" strategy, often used in technical analysis:
Entry/Re-entry Zone: The suggested trade entry (indicated by the blue box and the curved arrow) is a retest of the broken support level, which now acts as new resistance around the $109,000 mark.
Stop Loss: The Stop Loss is strategically placed above the most recent cluster of resistance, specifically above $112,682, to limit potential losses if the price moves against the trade and re-enters the previous high-value area.
Target: The Target price is set significantly lower at $104,001, suggesting the expectation of a strong downward momentum move, possibly towards the next significant support area not explicitly marked on the visible chart.
Risk/Reward Ratio: The setup shows a favorable risk/reward ratio, as the potential gain (Target to Entry) is visibly larger than the potential loss (Stop Loss to Entry).
Conclusion
The current chart structure strongly favors a short position on BTC/USD, anticipating a bearish continuation. The breakout below a critical support zone suggests the path of least resistance is now to the downside, with traders looking to enter a short position on a pullback to the broken support-turned-resistance area.

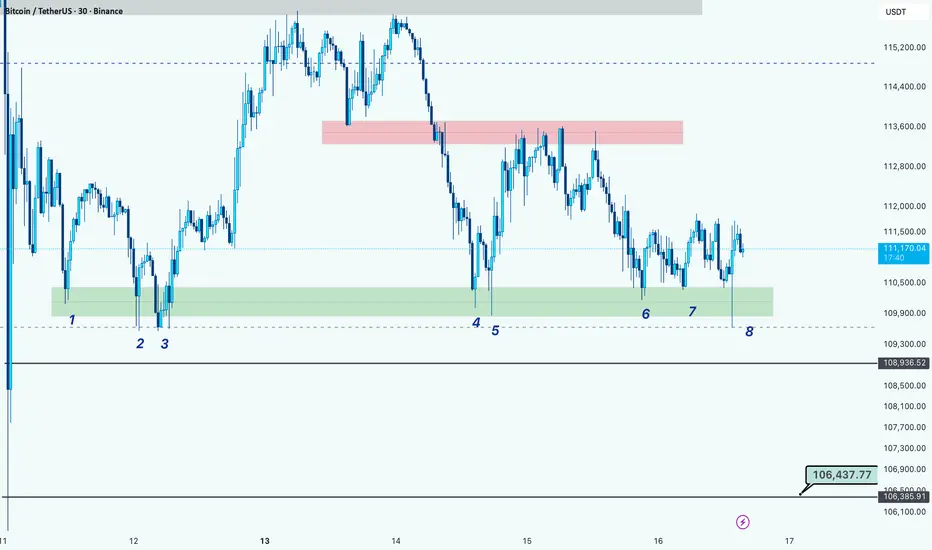
BTC Testing Key Support for the 8th Time, Breakdown Ahead?Hi guys!
BTC has tested the same support zone eight times around the $110,000 – $110,300 range (highlighted in green).
Repeated retests of a support level often signal weakening buyer strength, increasing the probability of a breakdown.
If the price manages to break below this zone, the next key support lies around $106,430, which could be the next target area for bears.
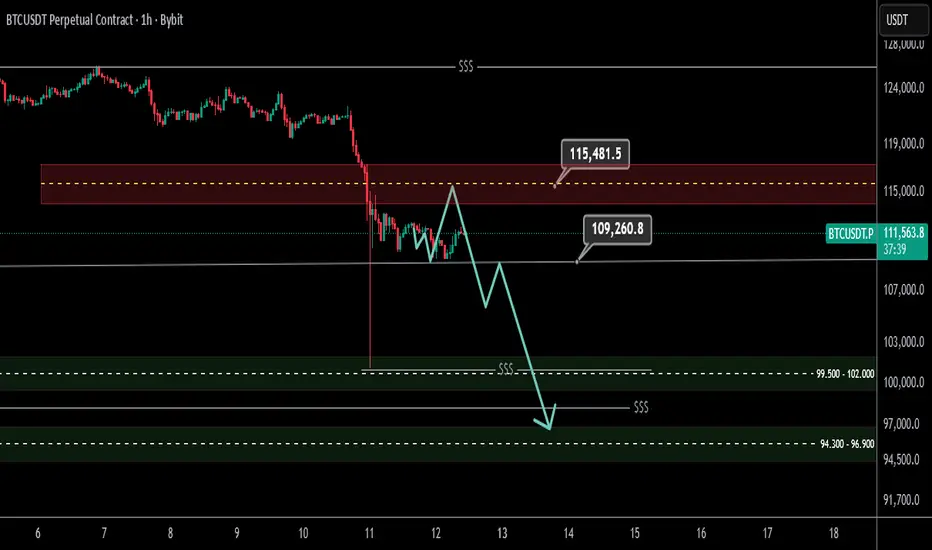
Bitcoin Analysis Update, 1 Hour Time Framehi traders
Previous analysis link:
Well, the one-hour time frame moved exactly as I expected. Key resistance points were precisely defined, and the continuation of the move towards the hunt for two liquidity levels and support below these two liquidity levels is a good area for a trigger buy.
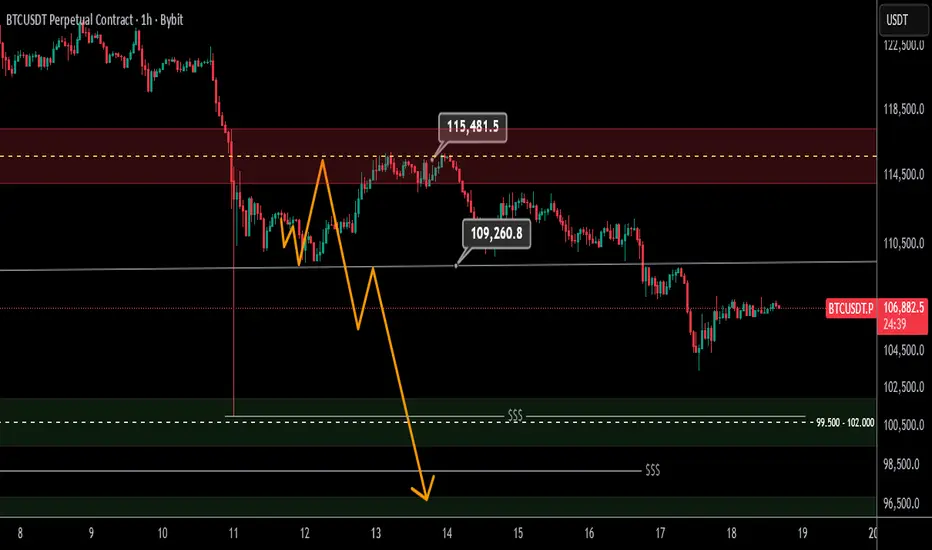
Bitcoin 1-hour time frame outlookHi traders
The 115 level will be an important resistance and reaction
And from the support considered after the hunt for two liquidity levels, the bottom is followed by a trigger buy
Bitcoin Price Slips Below $108,000: Time To Buy The Dip?At press time, Bitcoin trades at $106,947, sitting below the critical $108,000 level that previously acted as strong support. This loss has heightened volatility across the market, but a rebound remains possible if buying momentum holds.
Should accumulation persist and investor sentiment strengthen, Bitcoin could reclaim $108,000. This would push it toward $110,000, with a potential extension to $112,500 if momentum builds further. Such a move would indicate renewed market confidence.
Conversely, failure to maintain current levels could lead to further downside. A drop below $105,000 would expose Bitcoin to additional selling pressure. This would potentially dragging it toward $101,477 and invalidating the short-term bullish outlook.

BTC/USD – Bullish Reversal Setup from Key Support ZonePrice: $106,985
The market recently bounced from the lower channel line, showing that sellers may be losing momentum.
There’s a temporary consolidation near support — this could be a base for a reversal if buying pressure builds up.
⚙️ Technical Structure
Descending Channel: Shows a controlled downtrend — price respecting both upper and lower boundaries.
Support Zone: The green area marks a high-probability buying zone.
Target Point: Around $122,654 – $122,707, which aligns with previous resistance and upper channel breakout level.
📈 Bullish Scenario
If the price holds above $104,000 and breaks the channel resistance, we can expect:
First target: $114,000
Final target: $122,700
This move represents a strong bullish reversal potential.
📉 Bearish Scenario
If BTC breaks below $103,000, expect:
Next support: Around $101,500 – $102,000
It would confirm continuation of the downtrend within the channel.
🟢 Signal Summary
Direction Entry Zone Stop Loss Take Profit Confidence
BUY (Long) $104,000 – $106,000 $102,800 $122,700 ⭐⭐⭐⭐ (High if support holds)
⚠️ Conclusion
BTC/USD is at a critical support within a falling channel.
If the support holds, a strong bullish reversal toward the target zone ($122K) is likely.
But a break below $103K would invalidate this setup and resume the bearish trend.

Bitcoin; critical decision So I zoomed in the previous chart and as you see it’s beautifully climbing up a channel, I drew two supports which right now the price playing with one of them , the second touch is possible but unlikely cause first of all if it happens it put the last nail on the Alt-coin’s coffin secondly it has to be flash and comes back to the channel within this month or next ( literally two or three weeks ) tho the fact is the time is running out .
So I expect the price starts to go up to the first target of 150k and going rather fast from there close to 180k after a short consolidation .
Do not forget it’s my own play . DYOR

Bitcoin , parabolic haven’t started yetBitcoin cycles getting weaker and weaker if we goes by the timeframe but what if it’s changed ? I said we’re repeating the 2017 cycle long ago and what I expect from the price is to break the blue channel and goes parabolic for a few months, after all wouldn’t it be so easy if everything was still the same ? The same October.
I expect the price to do much better, still holding from average 22k and not intended to sale yet , I think there is a little trick going on to make chaos and confuse everyone to not know when to get off.
The price is in a juicy good risk/reward zone based on this chart , if it breaks and consolidate down there we damned , if it don’t we’ll meet in Valhalla .
Let’s just observe for now

Bitcoin Market Analysis – October 18, 2025👀 Current Outlook:
Price has found support around the 104,000 zone, and there’s a good chance we might start building a consolidation zone here.
📈 If that consolidation forms, a breakout above 107,000 could trigger a long position and signal renewed bullish momentum.
📉 On the flip side, if 104,000 breaks again, we may see a deeper drop, which could weaken the overall bullish structure and make it harder for the market to reach new all-time highs in the near future.
⚡️ In case of a sharp reversal and a V-pattern formation, it’s better to shift to a bullish bias and follow the momentum.
🕒 On the 15-minute timeframe, if we’re trading within the range, a break below 106,000 could provide a short setup.
---
💡 Conclusion:
Stay patient and wait for clear confirmations before entering any trades. Let the market show its direction — then follow the trend with discipline
For informational purposes only – not financial advice. © DIBAPRISM
Larry D.Kohn

BTC/USD – Bullish Channel Breakout and Retest Buy SetupChart Overview
Trend: The chart shows BTC moving within a descending channel (highlighted in blue).
Current Price: Around $106,534
Setup Type: Possible bullish reversal setup from the lower channel boundary.
🧩 Technical Breakdown
1. Pattern
BTC is currently testing the upper boundary of a falling channel.
Price has attempted to break out upward, suggesting early bullish momentum.
A retest zone (blue rectangle) is drawn between $104,690 – $103,033, indicating a potential buy zone.
2. Entry Zone
Entry Point: $104,690
This is around the retest of broken channel resistance, now turned support.
Price may dip into this zone before bouncing upward.
3. Stop Loss
Stop Loss: $103,033
Below the blue zone — protects from deeper continuation of the downtrend.
4. Target Point
Target Zone: $108,979 – $109,043
This is near the previous swing high and serves as a short-term bullish target.
5. Risk-to-Reward Ratio
Entry: $104,690
Stop Loss: $103,033 → Risk ≈ $1,657
Target: $109,043 → Reward ≈ $4,353
Risk/Reward ≈ 1:2.6, which is favorable for a long setup.
📈 Possible Market Scenario
BTC may retest the breakout area near $104.6K.
If it holds support, a bullish move toward $109K is expected.
A break below $103K invalidates the setup, resuming bearish pressure.
💡 Summary
Signal Direction Entry Stop Loss Target Risk/Reward
BUY Setup Bullish $104,690 $103,033 $109,043 1:2.6
⚠️ Note
Wait for confirmation (bullish candle or retest bounce) before entering.
Use tight position sizing to manage risk, especially since BTC remains volatile.

$BTC - The Correction Structure...! 10/17/2025
Bitcoin ( CRYPTOCAP:BTC ) is likely to extend its decline to complete the wave Y (Red) structure, targeting one of the wave Z (Blue) levels at $102,300 or the extended $93,700.
The decline reached $103,516 today! Is this it! if we considered slight truncation here and there at the endpoints of the structure segments then it's possible to satisfy Z=W probability (in Blue) but that remains to be verified at lower time frames.
Overall, wave Y is most likely the last segment of major correction pattern (Red WXY) and represents an ascending corrective setup characterized by its complex structure (Blue WXYXZ) and directional shifts, which set the stage for significant distribution and a major selling zone near the peak.
The worst-case scenario occurs if the wave Y structure range (in Blue) matches the size of wave W (in Red), pegged at $93,700.
Traders should monitor these levels closely for potential reversal signals and prepare for increased volatility as the pattern unfolds.
Happy Trading! 😎

Bitcoin BTC - Market AnalysisWhile my broader bias on Bitcoin (BTC) remains bearish, I hold a short-term bullish outlook leading into the New York (NY) session open. This perspective is based on several key technical observations:
I anticipate potential price manipulation during the NY session that may drive BTC toward the 0.618–0.786 Fibonacci retracement levels. This zone also coincides with a significant market structure shift (MSS) key level, making it a potential area of interest for short positions.
Notably, we have already seen strong rejection from the 0.5 equilibrium level within the current Fibonacci range, suggesting sustained selling pressure from market participants.
Furthermore, there appears to be limited liquidity buildup on the buy side, indicating a lack of engineered liquidity or compelling draw for a continued move higher compared to the liquidity we have on the sellside.
Given these factors, I plan to position myself for a potential short trade, capitalizing on any bullish manipulation that drives price into the aforementioned sell zone.

Btc Trade Set Up Oct 17 2025Btc is highly bearish so once we get a 15m BOS i will look for sells to SSL

BTCUSD: Short opportunities on technical retrace BITSTAMP:BTCUSD Analysis – October 17, 2025
Yesterday’s short setup (BB) was triggered and hit target as planned.
The main trend remains bearish, confirming that sellers are still in control.
For today, the focus remains on looking for short opportunities following the current downtrend.
Expecting a technical pullback toward the 40%–60% retracement zone of the previous bearish leg.
As price approaches this area and retests the EMA, wait for a clear confirmation signal before entering.
If price fails to follow the setup, stay patient and wait for more confirmation to ensure a safe and disciplined trade.
Main Plan: Keep a bearish bias — look for shorts near the 40–60% retracement zone once confirmation appears.
Daniel Miller @ ZuperView

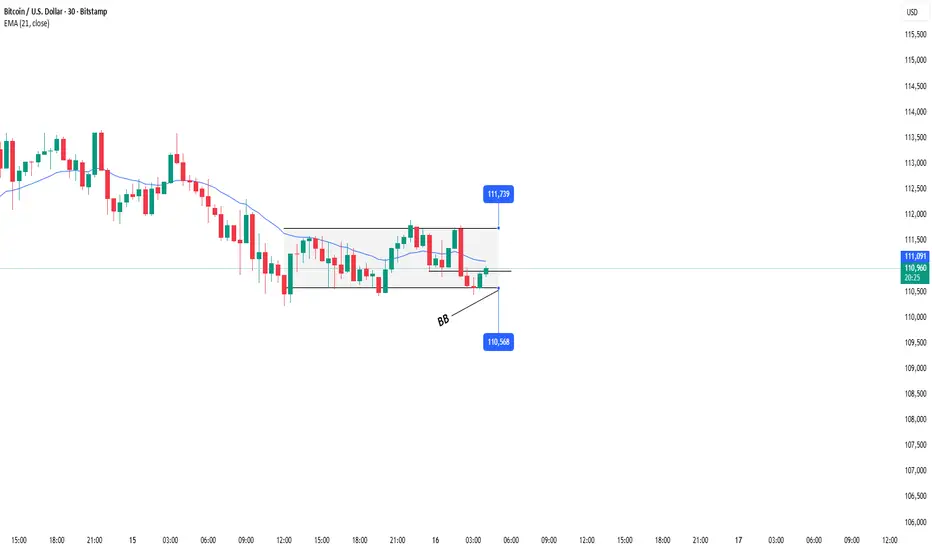
BTCUSD: Sideways in a block, looking for setup🧭 BITSTAMP:BTCUSD analysis – October 16, 2025
Currently, BITSTAMP:BTCUSD remains in a broader downtrend, so for today’s session, our main focus will be on looking for short (sell) opportunities, rather than counter-trend buys.
I’m using the 30-minute timeframe (M30) for today’s setup.
At the moment, BTC price action is quite complex — moving sideways within a block structure and has recently retested the resistance area around 110,904.
The plan for today is to wait for solid accumulation and a clear BreakBlock (BB) setup to confirm continuation to the downside.
Once a valid setup forms, we can look for short entries following the main trend, with strict risk management and flexible profit targets depending on market volatility.
Alternative Scenario:
If price breaks above the current range, we’ll stay patient and wait for clearer signals before entering any trades.
This approach helps us avoid FOMO and stay disciplined, ensuring all trades align with our predefined plan and market structure.
Daniel Miller @ ZuperView
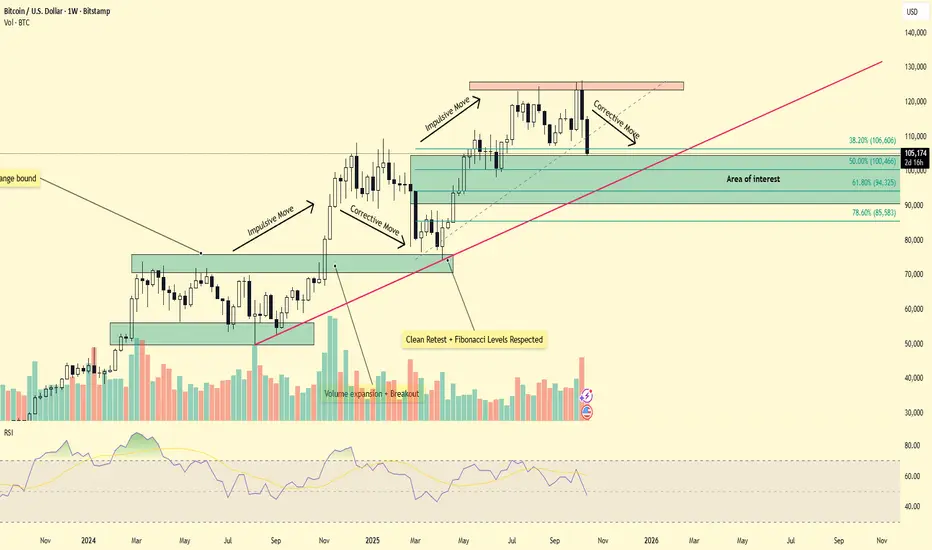
From Euphoria to Correction — Is BTC Setting Up for a Deeper PulIn my previous published idea, I mentioned that BTC was due for a corrective phase following an extended period of bullish momentum to the upside. That projection appears to be unfolding, as Bitcoin’s recent uptrend has started to cool off after several euphoric weeks of gains.
The weekly chart now shows price consolidating below the highs, indicating reduced buying pressure and potential exhaustion at elevated levels.
A weekly close below the 38.2% Fibonacci retracement level (≈106,000) could open the door for a deeper pullback toward the 50% retracement zone around 100,530, an area that previously acted as a strong demand zone and launch point for the last rally.
If the correction extends further, the 61.8% retracement level near 94,000 becomes the next key structural support — aligning closely with the ascending trendline that has guided BTC’s broader move.
Overall, Bitcoin remains within a macro bullish structure, but sustained weakness below the 100K region could mark the early signs of trend exhaustion and a potential sentiment shift.
DeGRAM | BTCUSD seeks to test the support area📊 Technical Analysis
● BTC/USD broke key ascending support near 110,000, turning it into resistance and confirming a bearish continuation structure.
● The price is moving within a descending channel targeting the 102,700 demand zone, suggesting further downside momentum.
💡 Fundamental Analysis
● Bitcoin faces selling pressure as U.S. yields rise and risk appetite weakens, while ETF inflows slow and market liquidity remains tight.
✨ Summary
● Short bias below 110,000; objectives 103,000–102,700. Technical breakdown and weaker macro backdrop reinforce medium-term bearish outlook.
-------------------
Share your opinion in the comments and support the idea with a like. Thanks for your support!

$BTC UPDATE: It’s been almost 2 months since I turned bearish CRYPTOCAP:BTC UPDATE:
It’s been almost 2 months since I turned bearish on Bitcoin and I’ve been warning you non-stop that BTC looked weak and ready to drop. Now everything is unfolding exactly as predicted.
#Bitcoin is moving just as expected after getting rejected again from the 1D 50 EMA zone near 115K–115.6K.
The price is now around 106K, showing sellers are still in control. As long as BTC stays below 110K, the trend remains bearish. The next support is around 102K–100K, and if that breaks, we could see 90K soon.
If buyers push BTC back above 115K and close strongly, it could turn bullish again toward 120K–122K.
I’m still holding my BTC short, with 25% of my position left open.

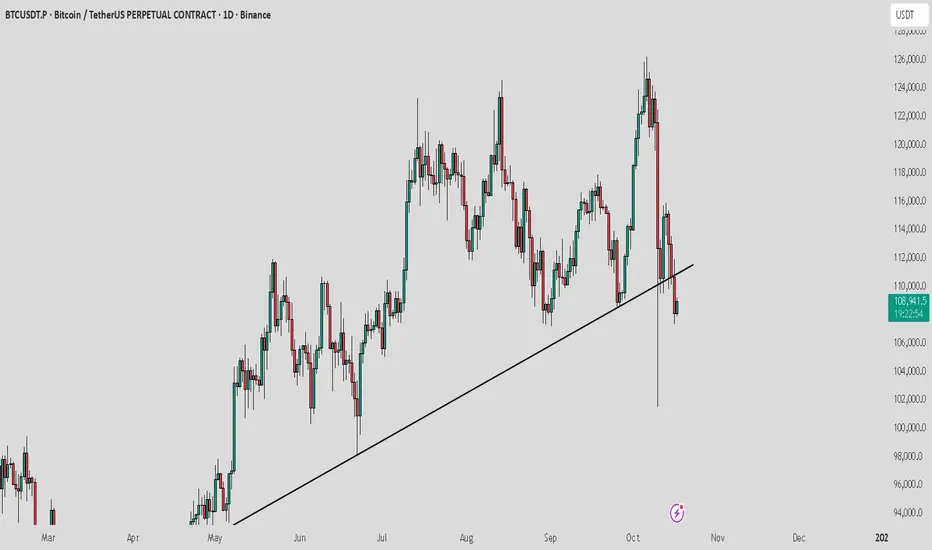
Bitcoin at Make or Break level : $118K or $102k next ? Bitcoin has broken down from trend line support and is now moving to retest that zone. Some consolidation near this area is likely.
Bullish scenario: If buyers dominate and BTC reclaims the support, we could see a move towards $118,000.
Bearish scenario: If sellers maintain control, a drop towards $102,000 – $100,000 is possible.
Manage risk carefully, avoid high leverage, and stay patient during consolidation.