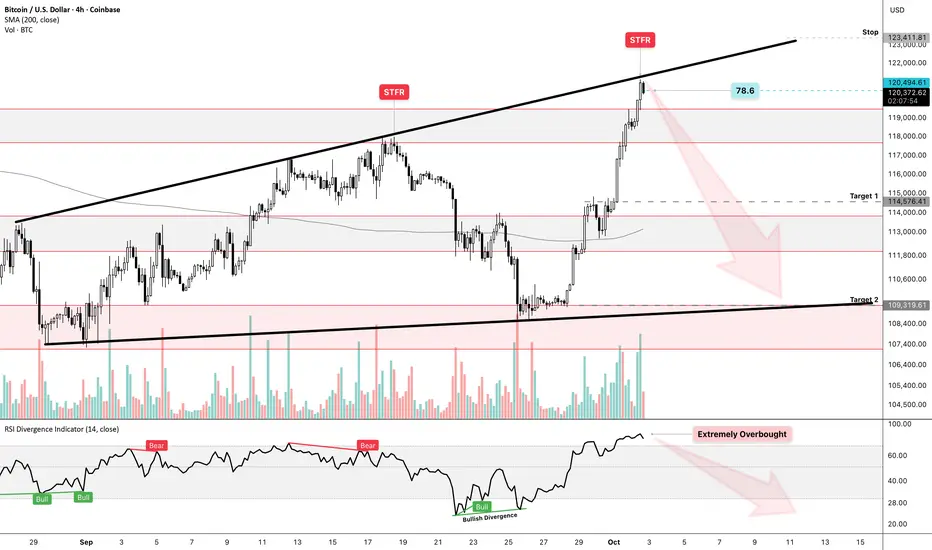
BTCUSD – Go Short or Go Broke | H4 Setup📝Thesis: Just entered a short on COINBASE:BTCUSD based on a confluence of technical and macro signals. This isn’t just about overbought RSI - it’s about asymmetric risk, deceptive bullish structure, and a broader bearish undertone most traders are ignoring.
📉 Setup Breakdown
RSI (H4): 85.12 – Extremely Overbought. Historically, this zone has triggered sharp pullbacks. Previous RSI peaks marked “Bear” on chart confirm the pattern(July, August 2025).
📊 Chart Structure: Rising wedge approaching STR resistance zone + 78.6 fib level. Price action looks exhausted, and volume is fading.
🌐 Macro Bias: Despite local bullish momentum, the broader trend remains bearish. Credit spreads are widening, and macro liquidity is tightening. Risk-off tone is creeping in.
⚖️ RR Profile: ATH is just ~$4K above. Downside targets offer cleaner reward zones with tighter invalidation. Stop placed just above STR zone.
🎯 Trade Parameters
✅ Entry: Near STR resistance zone
⛔️ Stop: Above upper trend line / STR zone
🟠 Target 1: Mid-channel support
🟢 Target 2: Lower fib confluence zone
🧠 Macro Overlay
U.S. credit spreads are widening (HY index at 2.75%, CDS spreads rising).
Government shutdown risk is escalating.
Fed is in risk-management mode - not panic yet, but tone is shifting.
October is historically volatile (see 2008 analogs) - watch for liquidity stress.
⚠️ TL;DR
Shorting INDEX:BTCUSD here isn’t just technical - it’s strategic. Overbought RSI + bearish wedge + macro stress = asymmetric setup.
Risk is capped, reward is clean. Let’s see how it plays out.
Btcusdanalysis
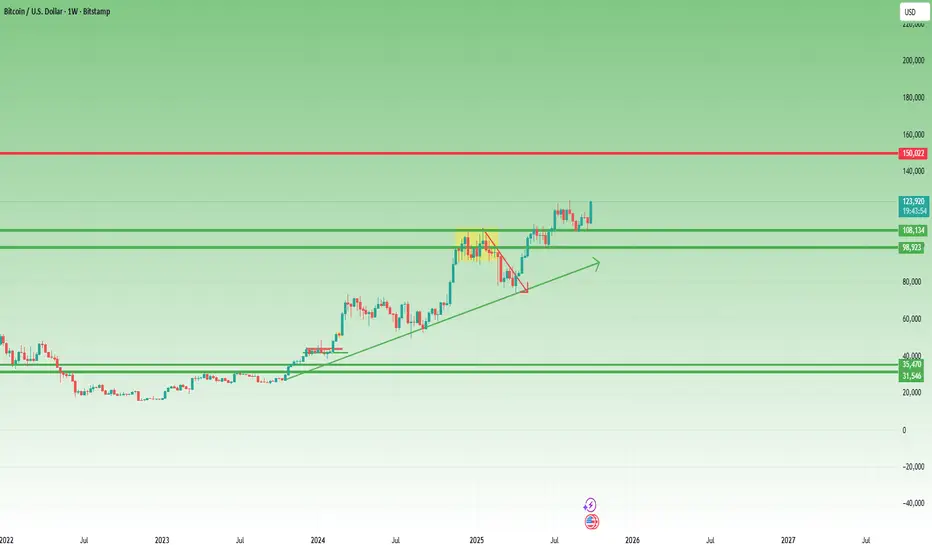
BTC Bulls in Control: 140K–150K Next?In my previous BTC analysis, I mentioned that 125K was the next target and that as long as 112K remains intact, bulls have nothing to worry about.
Since then, the price continued its ascent and is now flirting with the all-time high.
________________________________________
1️⃣ Is BTC Going to Make a New ATH?
From my point of view, it’s no longer a question of if , but how high it can go.
The trend is strong, momentum is building, and technically, we’re entering uncharted territory.
________________________________________
2️⃣ T echnical Context
After nearly three months of consolidation, clearly visible on the weekly chart, the breakout above the rectangle pattern gives us a measured target around 140K.
That’s the logical projection based on structure and continuation strength.
________________________________________
3️⃣ Can BTC Reach 150K?
Absolutely possible.
That’s only about a 20% move from current levels, and for Bitcoin, such moves are almost routine.
As long as 112K support holds, bulls remain fully in control.
________________________________________
Conclusion:
BTC seems ready to explore new highs.
Now the only question is — how far can this go? 🚀
WEEKLY MARKET ANALYSIS-DXY, BTC,ETH, NAS100,SPX,XAU,XAGThis weekend's analysis will cover the Dollar Index, Bitcoin, Ethereum, NAS100, SPX500, Gold and Silver.
The DXY has found a strong support on both the monthly and daily charts. DXY has officially also broken it's weekly closing resistance level and I think a shift in momentum will propel DXY up higher in the next week towards a target zone of 99 to 99.600.
Bitcoin is still in a correction and currently paused on the weekly 21 EMA, I think it's consolidating sideways and will continue selling to the intended target of $102k in the coming week.
ETH nicely came to the previous resistance and seems to find some buyers there but there is no momentum or RSI strength to support an upward move, so I am bearish on ETH and think the price will fall some more into the target zone below $3,823.
NAS100 and SPX500 are also looking quite over stretch on it's Bollinger Bands and KC channels on the weekly charts, with weekly bearish candles suggesting a pullback in the equities is very likely in the next coming week.
Gold and Silver are in a strong uptrend and the uptrend will continue but I see profit taking on the charts. I expect some sideways consolidation and a minor pullback before the bullish continuation.
I thank you for listening to my publications and I wish you a great trading week. Cheers everybody!!

Bitcoin Trap or Breakout? Triple Top or Hidden Accumulation? Bitcoin is stalling at key resistance after a massive rally… but is this a distribution trap before a pullback, or accumulation building for the next breakout?
Huge volume with small candles and declining momentum raises the question: Are we topping, or loading for liftoff?
Watch the chart, decide for yourself and share your thoughts in the comment section — Distribution or Breakout?
Thanks for your time

BITCOIN HIGH PROBABILITY SETUP SOON!!!🚨 BTCUSD HIGH PROBABILITY SELL SETUP 🚨
* Here We Can See Clearly The Next Potential Moves For BTC Coming Hours/Days.
* Keep Your Eyes Close On Your Trading Positions.
* Happy PIP Hunting Traders.
FXKILLA.

BTC 4H UpdateIn the last chart, we projected four upside targets:
TP1: $127,398
TP2: $130,077
TP3: $1302,845
TP4: $134,000 – $135,000
Price action has been moving in line with that projection and is now approaching the first key target (TP1).
If price breaks and holds above $126,000, continuation toward $130,000 (TP2) and higher levels remains the main scenario.
If rejection occurs at any of these zones, a pullback into local supports is likely before the next leg higher.
The reaction around TP1 will be decisive in confirming whether the path toward $135,000 remains intact.
This is not financial advice. Trade according to your own plan and risk management.

BTC 1D analysisWhat will happen next? Will BTC break the previous high or will fall up to retest zone? Please comment your guess...

BITCOIN SIGNAL: LEVERAGE DRIVEN PUMP! (where it ends??!)Yello Paradisers! Enjoy the video!
And Paradisers! Keep in mind to trade only with a proper professional trading strategy. Wait for confirmations. Play with tactics. This is the only way you can be long-term profitable.
Remember, don’t trade without confirmations. Wait for them before creating a trade. Be disciplined, patient, and emotionally controlled. Only trade the highest probability setups with the greatest risk to reward ratio. This will ensure that you become a long-term profitable professional trader.
Don't be a gambler. Don't try to get rich quick. Make sure that your trading is professionally based on proper strategies and trade tactics.

BTCUSD: Weekly reviewThis week, BITSTAMP:BTCUSD recorded a strong rally, moving from 109,900 → 120,800, equivalent to about +10,900 USD (+9.9%).
After last week’s sharp decline, the market clearly reversed into an uptrend as price broke out and held firmly above the EMA.
Today is Friday, and the market may experience strong volatility due to the Non-Farm Employment Change (NFP) report – an event that often has a major impact on price movement and trading strategies during the day.
Key Setups of the Week
1. BITSTAMP:BTCUSD Review – September 29
After a sharp drop, BTC rebounded, broke out of the range, and held above the EMA.
This was an early signal confirming a trend reversal from bearish to bullish.
2. BTC Review – September 30
After breaking out of the larger range and rallying strongly, the plan was to wait for a pullback toward the EMA.
Price formed a diagonal wave and gave confirmation signals through DD (Double Doji) / FB (First Breakout).
The entry was triggered, and the market rallied nicely, hitting the target as expected.
3. BTC Review – October 1
After the rally, BTC retraced and closed below the EMA.
At this point, the short-term trend was unclear → staying out and waiting for more market data to avoid unnecessary risk.
4. BTC Review – October 2
On the following day, price recovered and consolidated right at the upper boundary of the range.
EMA pressed tightly, creating a momentum compression zone and setting up for the next breakout.
The plan was to wait for RB/ARB confirmation, then Buy following the breakout.
This setup worked out successfully, BTC broke out strongly and continued to hit the target.
5. BTC Review – October 3
The main bullish trend continued, showing no signs of weakness.
The plan: wait for a pullback to the EMA, confirm a FB/SB (Second Breakout) signal, then Buy in line with the uptrend.
The scenario played out accurately, delivering another profitable setup.
Conclusion
Trend of the week: Clearly bullish.
Buy setups around EMA and breakout strategies performed effectively, resulting in a consistent winning streak.
Caution for today: With NFP on the schedule, unusual volatility may occur. Traders should manage risk carefully and patiently wait for clear confirmation signals before entering the market.
You can refer to my previous analysis here:
Please like and comment below to support our traders. Your reactions motivate us to do more analysis in the future 🙏✨
Daniel Miller @ ZuperView

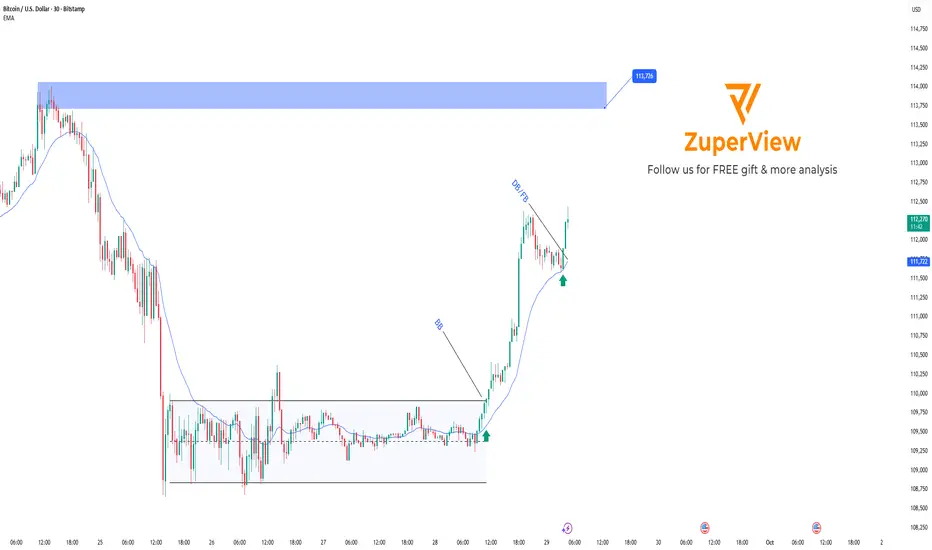
BTC escapes consolidation, shifting into an uptrend
Price has broken out of the sideway range 108,500 – 109,800, shifting from bearish to bullish.
After the BB (Block Breakout), BTC surged to 112,500 – 113,000 before consolidating.
Currently, price is trading far from the EMA (around 111,100), implying a possible pullback.
Strategy:
Wait for price to retrace toward EMA (111,000 – 111,200) or consolidate in this zone.
If patterns such as DD (Double Doji) or FB (First Breakout) form within 111,000 – 111,500, consider long entries.
Please like and comment to support our traders. Your feedback motivates us to produce more analysis in the future 🙏✨
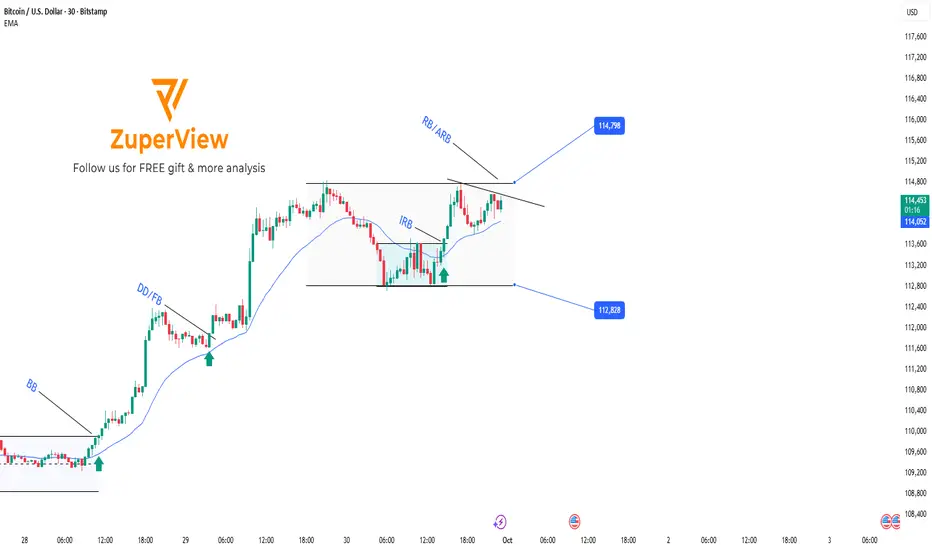
BTC breakout trading setupBITSTAMP:BTCUSD is currently consolidating within the 112,828–114,798 sideway range.
Earlier, the market broke out from a smaller accumulation inside the larger range, generating an IRB (Inside Range Break) signal, pushing price back toward the upper boundary.
Price is now forming a momentum consolidation, indicating potential for another breakout.
2 Possible Scenarios
1. RB (Range Break)
Price compresses further with EMA pressing tightly.
A strong breakout directly above the range top may occur with momentum.
2. ARB (Advance Range Break)
After breaking above the range, instead of continuing higher immediately, price may stall.
A new consolidation forms just above the broken range, with EMA pressing upward.
This setup may signal a continuation of the previous breakout move.
You can refer to my previous analysis here:
Please like and comment below to support our traders. Your reactions motivate us to do more analysis in the future 🙏✨
Daniel Miller @ ZuperView
BTC 03.10Bitcoin is reacting from an important zone, but I don't see any confirmation for a short position from the current levels. I expect a rally in the local range of 121-117-115. Alta might shoot up around that time, but I hope it doesn't hit my knees. There are no significant resistance levels above that, and there are important local supports – zones S1 and S2. The long setups are from yesterday, and I'll be assessing shorts based on the situation. I don't see any options other than the nearest 130,000.
Support zones:
116770-117410
115390-115890
113.9-114

$BTC seems spike seems a little "too coordinated" All for healthy trading and stocks / crypto making gains, but what we're seeing in BTC seems very engineered and highly coordinated. Needs to be investigated. BTC and crypto markets are not strange to rugs and a lot of f$ckery taking place. One this is for sure that profit takers will take advantage of this! Be very careful and measured. I've seen this movie way too many times. If you're up, take your profit and sit back waiting for your next opportunity. Way too hot!

BTC Trade Set Up Oct 2 2025Price is in a strong bullish trend and made a CISD+retest to target previous 15m highs
www.tradingview.com

#BITCOIN ANALYSIS For the last 40 days I’ve been telling you #BITCOIN ANALYSIS
For the last 40 days I’ve been telling you guys I’m bearish on $BTC. We already dropped almost 8K twice, but every time Bitcoin reclaimed the levels again. Right now it’s trading around 18K to 119k but nothing has changed for me. I’m still bearish.
I’ve said many times that the 115K to 124K region is a short zone, not a long zone. If you’re still holding longs, I’d strongly suggest you flip to shorts because the chart is flashing multiple top signals.
Don’t get trapped by hype like “Bitcoin to 1 million by the end of this year.” That’s just noise. The structure is weak, liquidity is being engineered, and the bigger downside move is still ahead.
📌 Downside Targets:
105K → 100K → 95K → 90K

ANFIBO | BTCUSD Analysis – Weekly Trading PlanHi guys! It's me, Anfibo. My plan last week gave us a good profit selling from 118,000 USD to 115,000 USD.
And over the past weekend, BITSTAMP:BTCUSD consolidated in a sideways range, consistently holding above key support. However, with the opening of the new week’s Daily candle, the market decisively broke down through this support zone, signaling that selling pressure is now taking clearer control.
From a technical perspective, the next critical support levels to monitor are:
• $113,000
• $111,000
• $109,500
Around the $110,000 region, I view this as a pivotal area to consider initiating spot entries or building larger long-term positions. This zone is not only a technically strong support level but also carries significant psychological weight for institutional and large-scale flows.
Imo, in the short term, BTC may still attempt a retest of the $115,000 level before resuming its downward trend, depending on lower-timeframe reactions. This creates an opportunity for traders to capitalize on corrective moves.
>>> My Trading Plan for the Week:
(1) SELL SCALP:
– ENTRY: around 115,000
– SL: 117,000
– TP1: 113,000
– TP2: 110,000
(2) BUY SETUP:
- ENTRY: 109,000 - 111,000
- SL: 107,000
- TP1: 117,500
- TP2: 122,000
- TP3: 128,000
This strategy is designed for short-term trades, taking advantage of volatility within the current range. For long-term investors, patience will be key—waiting for BTC to approach $110,000 or lower provides a strategic opportunity to restructure portfolios and scale into positions at more favorable prices.
👉 Conclusion: BITSTAMP:BTCUSD has broken out of its weekend consolidation and is now entering a fresh leg down. Short-term traders should look to sell corrective bounces, while long-term investors should focus on accumulation opportunities near $110,000 - a level that could serve as a “strategic entry” for the upcoming cycle.
WISH EVERYONE A NEW WEEK FULL OF ENERGY! ;)

Bitcoin BTC: VWAP Extension, Three-Drive Pattern, & Trade Plan📊 Bitcoin (BTC) continues to hold a strong bullish trend, but in my view it is now overextended as we head into the end of the week ⚡.
🔎 In the video, I break down how BTC is currently trading two deviations above VWAP, highlighting its stretched positioning. We also discuss the three-drive pattern, which often precedes a correction — particularly when combined with a VWAP extension and end-of-week institutional activity as larger players wind down their trades 🏦.
📈 With that in mind, I’m anticipating a retracement. If price pulls back into support and then confirms with a bullish break of structure, I’ll be looking for a long opportunity 🎯.
⚠️ Disclaimer: This analysis is for educational purposes only and not financial advice. Always trade responsibly and manage risk carefully.

#BTC/USDT Analysis — Pullback Before Bullish Continuation#BTC
The price is moving within a descending channel on the 4-hour frame, adhering well to it, and is heading for a strong breakout and retest.
We have a bearish trend on the RSI indicator that is about to be broken and retested, which supports the upward breakout.
There is a major support area in green at 111600, which represents a strong support point.
We are heading for consolidation above the 100 moving average.
Entry price: 111750.
First target: 112684.
Second target: 113672.
Third target: 115048.
Don't forget a simple matter: capital management.
When you reach the first target, save some money and then change your stop-loss order to an entry order.
For inquiries, please leave a comment.
Thank you.

BTCUSD Short Setup Targeting FVG FillThis analysis outlines a conceptual short swing trade on the BTCUSD 1-hour chart. The strategy is based on a potential price rejection from a Fair Value Gap FVG zone, anticipating a move down to fill a lower imbalance.
Key Levels:
Entry (Sell): 118,700
Take Profit: 116,700
Stop Loss: 119,700
Reasoning:
The concept identifies a Fair Value Gap FVG which represents a market imbalance. The thesis is that price has rallied into this zone and may reverse, leading to a decline towards the subsequent target FVG. The entry level is set to confirm seller momentum, with a stop loss placed above the zone to invalidate the idea if breached. The take profit target is set at the next area of interest, maintaining a structured risk to reward ratio.
Risk Disclaimer: This post is for educational and informational purposes only and does not constitute financial advice. All trading involves high risk, including the potential loss of all invested capital. This concept should not be relied upon for making investment decisions.

DeGRAM | BTCUSD seeks to the $118k level📊 Technical Analysis
● BTC/USD bounced from the demand zone near 111K and reclaimed 114K resistance, signaling a structural shift toward bullish momentum.
● Current price action shows potential continuation with targets around 118K–124K if higher lows sustain above 112K.
💡 Fundamental Analysis
● Optimism in crypto markets is supported by rising institutional inflows and growing expectations of U.S. rate cuts, boosting risk assets.
✨ Summary
BTC/USD holds above 114K, with upside targets at 118K and 124K. Support rests at 112K for medium-term bullish continuation.
-------------------
Share your opinion in the comments and support the idea with a like. Thanks for your support!

BTC 02.10#BTC
BTC is approaching the important 119.7-120.8k area.
So far, I see the following options:
1) Bearish divergences are forming on the 1-4-12-1D timeframes. If the price quickly reaches this zone (today/tomorrow), I'll take short positions.
2) On the MCB indicator, the higher timeframes - 3D-1H - paint a less than favorable picture for short positions. On the 3D, our money flow continues to grow. On the weekly chart, this week is drawing a GD (green dot), and if the week closes with a confirmed GD, I'll likely consider short positions after another ATH.
3) A week or two of consoles around 120k. In that case, local short confirmations will likely "melt down," and we'll have to monitor the situation going forward.
I've identified a couple of local support zones (S1, S2) from which we can begin the console.
Support zones:
116770-117410
115390-115780
113.9-114
Resistance zones:
119.8-120.8

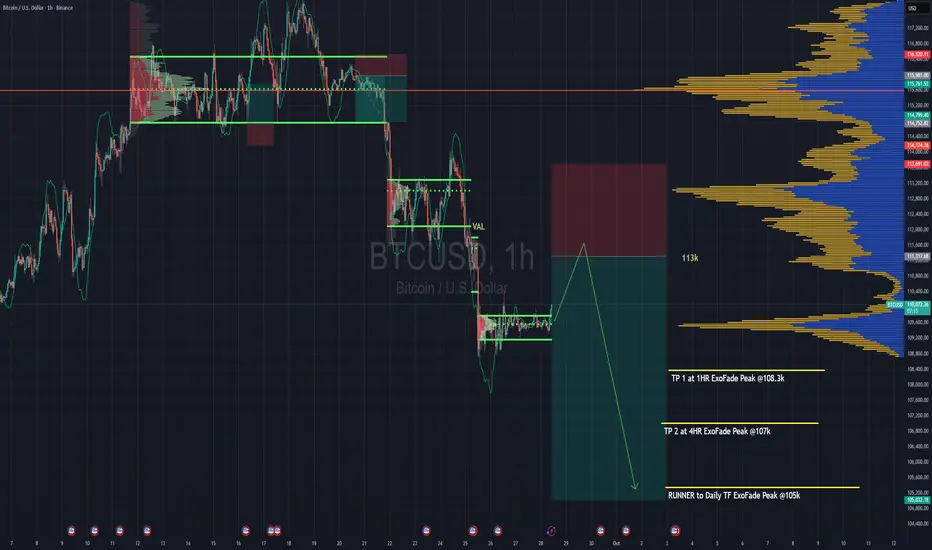
Looking to Short Bitcoin From Here : Winter Is Coming !!Looking to short BTC for a continuation of the downtrend.
Trend is your friend is what they say.
So we're basically going to wait for a pullback to 113k range then enter a sell.
The sell entry caters for both H4 & Daily timeframe trend, so it's a strong one.
The sell entry range also has the VAL of the last rotation we had from Sept 21st to Sept 24th when we finally broke down from it at 112k. That VAL should be a strong point for rejection, it'll be one of the places where we'll truly get to test the strength of the bears ( that's if we even make it that far )
TP targets are based on ExoFade peaks of the H1, H4 and Daily timeframe.. You can add the ExoFade to your charts to follow on your own charts as well.
VAL - Value Area Low of the volume profile
Strategy => Volume + Trend + Lots of coffee
BTC consolidates after a significant price spikeBITSTAMP:BTCUSD price has had a slight correction after the previous increase.
Yesterday, the price broke the trendline and the EMA approached, creating a momentum accumulation zone before a strong break - as planned to buy.
Currently, BTC is correcting after the increase, just cutting down the EMA, showing that buying power is weakening, the short-term trend may turn down.
There is no clear signal to enter the order. Continue to observe the price reaction around the EMA and wait for a clear setup before taking action.
You can refer to my previous analysis here:
Please like and comment to support our traders. Your feedback motivates us to produce more analysis in the future 🙏✨
