Bitcoin Trade IdeaDaily is in sell trend. I will join the trend sell on potential zones and wait for market structure change to bullish to ride the trend.
Btcusdanalysis

Bitcoins future...Been playing around and we could be in trouble here if the bottom line of the rising wedge ends up broken.
We could see price levels as low as 1500-2k in worst case scenarios!
Most likely we will go down and test 60k area based on trendlines and resists.
The circles shows a zone/area we can go up and fill to complete the rising wedge.
These times are so exciting so much money can be made if you're watching it closely!

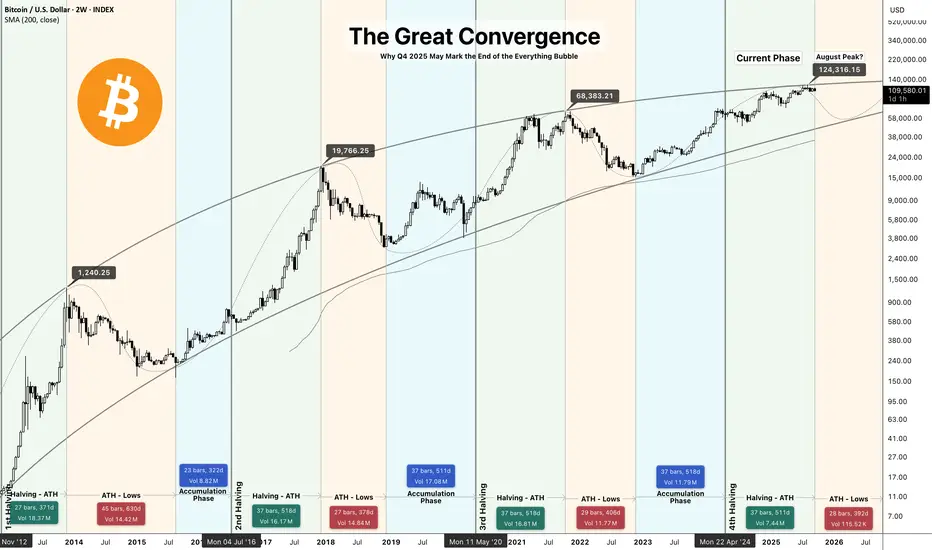
The Great Convergence: End of the Everything BubbleThe Great Convergence: Why Q4 2025 May Mark the End of the Everything Bubble
A Multi-Asset Analysis of Bitcoin, S&P 500, and Gold at Critical Junctures
Hello Traders, After analyzing 25 years of market data across three major financial crises, I've identified a dangerous convergence of signals suggesting we're approaching a significant market inflection point. The simultaneous peaks in IG:BITCOIN (~$124K), SP:SPX (6,700), and TVC:GOLD ($3,790) combined with deteriorating macroeconomic indicators mirror patterns that preceded both the 2000 and 2008 crises.
Key Thesis: We are potentially entering a liquidity crisis that could result in a 30-50% correction across risk assets by Q4 2026.
Part I: The Bitcoin Halving Cycle - End of the Fourth Epoch
Historical Pattern Recognition
CRYPTO:BTCUSD price action has followed a remarkably consistent 4-year cycle tied to its halving events:
2012 Halving → 2013 Peak (1 year delay): +8,000% rise, -85% crash
2016 Halving → 2017 Peak (1.5 years delay): +2,800% rise, -84% crash
2020 Halving → 2021 Peak (1.5 years delay): +700% rise, -77% crash
2024 Halving → 2025 Peak (1.5 years delay): +450% rise, -75% crash projected
Current Technical Indicators
RSI Divergence: Weekly RSI showing lower highs while price makes higher highs - classic exhaustion signal present at 2013, 2021 previous cycle tops.
Volume Profile: Declining volume on recent rallies indicates weakening conviction
On-chain Metrics: Long-term holder distribution accelerating, similar to previous cycle tops
Price Targets
Current Level: $109,498
Proposed Peak: $124,000 (By halving cycle theory this was fulfilled last month August)
Initial Support: $69,000 (previous cycle ATH)
Crisis Target: $25,000-30,000 (75% drawdown from peak by Q6 2026)
Part II: The Macro Crisis Trigger - SPX SP:SPX / Unemployment Rate ECONOMICS:USUR / Fed Rate Correlation ECONOMICS:USINTR
The Historical Precedent
Every major crisis follows a predictable sequence:
2000 Dot-Com Bubble:
CBOE:SPX at ATH (1,550) ✓
Unemployment begins rising from 3.9% ✓
Fed initiates rate cuts ✓
→ 49% crash over 2.5 years
2008 Financial Crisis:
TVC:SPX at ATH (1,576) ✓
Unemployment rises from 4.4% ✓
Fed cuts rates aggressively ✓
→ 57% crash over 1.5 years
2025 AI/Everything Bubble:
TVC:SPX at ATH (6,700) ✓
Unemployment rising from 3.4% ✓
Fed just initiated cuts (Sept 2025) ✓
→ Projected 35-45% correction over 1.5 years
The Unemployment-Rate Cut Death Cross
Since 1970, whenever the Fed has cut rates while unemployment is rising from cycle lows:
12/12 times resulted in recession within 12 months
Average equity drawdown: 35%
Average duration: 18 months
Current Labor Market Dynamics - The AI Disruption Factor
Unlike previous cycles, we face structural unemployment pressure from AI adoption:
Customer service: 2M jobs at risk
Software development: 500K jobs transitioning
Logistics/Transport: 3M jobs being automated
Administrative: 4M jobs under pressure
This isn't temporary cyclical unemployment - it's structural displacement requiring economic reorganization.
Part III: Gold's Crisis Pattern - The Liquidation Before the Flight
Historical TVC:GOLD Behavior in Crisis
Contrary to popular belief, FX:XAUUSD can and does suffer fast flushes during systemic liquidity panics despite its long-term hedge role; with gold near ATH, combined liquidity and profit-taking risk could produce a 15–25% correction ahead of any later safe-haven rally:
2000 Crisis:
Pre-crisis peak: $326
Initial drop: -21%
Bottom-to-recovery: +650% over 11 years
2008 Crisis:
Pre-crisis peak: $1,033
Initial drop: -34%
Bottom-to-recovery: +180% over 3 years
Covid-19 Pandemic:
Pre-pandemic peak: $1,696
Initial drop: -15%
Bottom-to-recovery: +43% over 2 years and 160% over 5 years
Some will point to 2020, when gold rallied during the COVID crash. But that was a unique exogenous shock: the selloff lasted only weeks before unprecedented stimulus and collapsing real yields drove gold to new highs. In contrast, financial‑system crises like 2000 and 2008 forced gold into a year‑long correction before its hedge role reasserted. The 2025 setup looks far closer to those financial crises than to 2020’s pandemic shock.
2025 Projection:
Current peak: $3,790
Expected initial drop: -20 to -25%
Target bottom: $3,000-$2,800
Long-term recovery target: $6,500+ by 2030
Why Gold Falls Initially
During liquidity crises, investors sell everything to meet margin calls and raise cash - even safe havens. Only after the acute phase does gold fulfill its hedge role.
Part IV: The Convergence - Why This Time Is Particularly Dangerous
Unique Risk Factors in 2025
1. Unprecedented Valuations Across All Assets
Total global asset values: $450 trillion (4.5x global GDP)
Buffett Indicator: 195% (highest ever)
Shiller CAPE: 38 (higher than 1929)
2. Leverage and Derivatives
Total derivatives notional: $700 trillion
Margin debt: $935 billion (record high)
Corporate debt/GDP: 85% (record high)
3. Geopolitical Tensions
Active conflicts affecting supply chains
De-dollarization accelerating
Energy market fragmentation
4. Cryptocurrency Systemic Risk
$2.5 trillion COINBASE:BTCUSD and over $4T gross crypto CRYPTOCAP:TOTAL asset class that didn't exist in 2008
Interconnected with traditional finance via ETFs
Untested in true liquidity crisis
Part V: The Three-Stage Crisis Model
Stage 1: The Warning Shot (Now - Q4 2025)
Timeline: Next 1-3 months
Characteristics:
Deteriorating breadth (fewer stocks making highs)
Defensive rotation begins
TVC:VIX creeping higher
First 10% correction dismissed as "healthy"
Stage 2: The Liquidity Cascade (Q4 2025 - Q2 2026)
Timeline: 6-9 months
Characteristics:
Multiple failed rallies
"Buy the dip" mentality breaks
Margin calls cascade
All correlations go to 1
Targets:
TVC:SPX : 5,000-5,500
CRYPTO:BTCUSD : $50,000-70,000
TVC:GOLD : $2,200-2,400
Stage 3: Capitulation and Reset (Q2 2026 - Q4 2026)
Timeline: 6-12 months
Characteristics:
Forced selling exhaustion
Government intervention
Market clearing prices reached
Final Targets:
TVC:SPX : 3,700-4,500
CRYPTO:BTCUSD : $25,000-35,000
TVC:GOLD : Begins new bull market from $2,800
My Risk Management Framework
Position Sizing
Current Risk Asset Exposure: Reduce to 30% of portfolio
Cash: 50%
Precious Metals (Physical): 10%
Strategic Shorts: 10% (via puts and/or inverse ETFs)
Key Indicators to Monitor
Weekly Unemployment Claims: ECONOMICS:USUR Sustained moves above 250K
Credit Spreads: HYG/TLT ratio breaking below 4.5
Dollar Strength: TVC:DXY above 110 signals global stress
IG:BITCOIN Dominance: Below 45% indicates alt-coin capitulation
TVC:VIX Term Structure: Inversion signals immediate stress
Invalidation Scenarios
This bearish thesis would be invalidated if:
Unemployment reverses below 4%
Fed pivots to QE without crisis
Fiscal stimulus exceeds $2 trillion
AI productivity gains offset job losses faster than expected
Conclusion: Probability-Weighted Scenarios
Based on historical precedent and current conditions, I assign the following probabilities:
60% Probability: Significant correction (20-30% drawdown) beginning Q4 2025
25% Probability: Major crisis (40-50% drawdown) rivaling 2008
15% Probability: Continued melt-up through 2026 (Fed intervention success)
The risk/reward severely favors defensive positioning. After a 15-year bull market across all assets, the convergence of deteriorating fundamentals, extreme valuations, and historical crisis patterns suggests we're approaching a critical inflection point.
Remember: Markets can remain irrational longer than you can remain solvent. This analysis presents probabilities , not certainties. Always manage risk appropriately and never invest more than you can afford to lose.
Disclaimer: This analysis is for educational purposes only and should not be considered financial advice. Past performance does not guarantee future results. Always conduct your own research and consult with financial professionals before making investment decisions.
Follow for updates as this thesis develops. Key milestones to watch:
October NFP report
November FOMC meeting
Q4 earnings season
Year-end positioning
BTC Possible Scenarios for the WeekPossible Scenarios for the Week
Bullish scenario: BTC holds support at $110,000, breaks through $120,000, and heads toward $125,000-$130,000.
Sideways/consolidation: Movement between $110,000 and $120,000 without a clear direction.
Bearish scenario: Break below $110,000 — test of $105,000 and below.
Risks and factors to monitor
Fed policy and rate announcements can significantly influence the trend (as a driver for the USD).
Trading volumes: Weak volumes during breakouts may be false.
US macroeconomics, inflation, geopolitics — increased tensions could trigger volatility.
BITCOIN HIGH PROBABILITY SETUP SOON!!!🚨 BTC HIGH PROBABILITY BUY SETUP 🚨
* Here We Can See Clearly The Next Potential Moves For BTCUSD Coming Hours/Days.
* Keep Your Eyes Close On Your Trading Positions.
* Happy PIP Hunting Traders.
FXKILLA.

BTCUSD Short/Sell SignalBitcoin (BTC/USD) – Tactical Short/Sell Positioning Framework
From a technical perspective, Bitcoin is currently presenting a compelling short-side opportunity as the structure unfolds. After multiple failed attempts to sustain momentum above the $110,000 handle, price action has carved out a sequence of lower highs and retests of the same horizontal zone, a classic sign of weakening bullish conviction and potential distribution at elevated levels.
The current chart reveals several critical dynamics:
1. Stop-Loss Placement (Risk Management Discipline)
A prudent protective stop (SL) I have set at $112,800, just above recent resistance. This ensures adverse upside volatility is capped while preserving favorable risk-to-reward asymmetry.
2. Initial Breakdown Trigger
Bitcoin’s repeated interactions with the 200-day moving average highlight the significance of this level as both psychological and structural support. A clean break beneath it could catalyze accelerated downside flows, inviting systematic selling and liquidations.
3. Downside Targets (Profit Objectives)
Take Profit 1 (TP1): $100,070
This marks the first tactical support level, aligning with prior consolidation and offering a conservative initial profit capture.
Take Profit 2 (TP2): $89,566
A more ambitious level, representing the mid-range support where prior accumulation took place. A breach of this zone would likely confirm a broader bearish continuation pattern.
Take Profit 3 (TP3): $76,193
The ultimate downside objective in this framework, corresponding to deep structural support. Achieving this would imply a full retracement of the bullish leg initiated earlier in the year.
4. Strategic Interpretation
This sequence of measured downside targets aligns with a tiered scaling-out methodology, ensuring that profits are progressively locked in as price declines. Such an approach maximizes capital efficiency while allowing flexibility to ride the broader bearish trend should momentum persist.
My Conclusion
The technical confluence of repeated resistance rejection, weakening market structure, and clear downside liquidity targets positions Bitcoin as a sophisticated short candidate at current levels. Risk is well-contained above $112,800, while downside projections toward $100K, $89.5K, and ultimately $76K create a compelling asymmetric opportunity.

BTC SCENARIOS TODAY | BTCUSD BEARISH TREND | SEP.271. Main Trend
The market is still in a downtrend (clear bearish trendline + multiple BOS to the downside).
Current moves are just retracements within the bearish trend.
2. Key Zones
Sell Zone (priority – trend-following):
110,200 – 110,800 (confluence of FVG + Fib 0.5–0.618).
If price retraces here, look for short setups.
SL: above 111,200.
TP1: 109,000.
TP2: 108,200 (nearest support).
Buy Zone (countertrend – higher risk):
108,000 – 108,500 (strong support with previous bullish reaction).
Only consider short-term buys if a clear bullish confirmation appears.
TP: 109,500 – 110,000.
SL: below 107,700.
3. Scenarios
Most likely: Price pulls back to 110,200 – 110,800 → rejection → short opportunity.
If 108,000 breaks: Downtrend continues, potential extension toward 106,500.
If strong breakout above 111,200: Market may form a major CHoCH, shifting bias to bullish.
👉 Summary:
Main strategy: Sell at 110,200 – 110,800.
Alternative strategy: Short-term buy at 108,000 – 108,500.

BTCUSDT (H1) – Trading ScenariosScenario 1 – Rebound from Demand Zone
The demand area at 108,500 – 108,700 remains the strongest short-term support.
If bullish reversal patterns (Pin Bar, Bullish Engulfing) form here with confirming volume, a rebound is likely.
Trade Setup: Enter long around 108,600 – 108,700, targeting 109,800 (PoC) as the first objective, and 111,900 – 112,100 (VAH) as the second.
Stop Loss: Below 108,300.
Scenario 2 – Consolidation around PoC
The PoC area at 109,400 – 110,200 represents the equilibrium zone where price may consolidate.
In this case, short-term scalping strategies can be applied: buying near the lower bound (109,400) and selling near the upper bound (110,200).
Take Profit: Quick targets of 30–50 USD.
Stop Loss: 0.3–0.5%, depending on position sizing.
Scenario 3 – Breakout above VAH
A decisive close above the 111,900 – 112,100 (VAH) zone would confirm bullish continuation.
This breakout would likely attract momentum buyers and trigger stop orders.
Trade Setup: Place buy stops at 112,150 – 112,200, aiming for 112,800 as the first target and 113,500 (liquidity zone above) as the second.
Stop Loss: If price falls back below 111,700.
Scenario 4 – Breakdown of Demand Zone
If price closes firmly below 108,500 with high volume, it signals bearish continuation.
Such a breakdown opens the path to lower liquidity levels.
Trade Setup: Enter short via sell stops at 108,450 – 108,500.
Targets: 107,800 initially, followed by 106,500.
Stop Loss: Above 108,900.
✅ Summary
Bullish setups: Buy from 108,600 – 108,700 (Demand Zone) or on breakout above 112,100.
Bearish setups: Sell if 108,500 breaks, or look for rejection signals near 113,000.

BTCUSD – Short-term Downward Channel.....BTCUSD – Short-term Downward Channel, Accumulation Before a Potential Rally
Good day traders,
On the H4 timeframe, BTC is moving within a short-term descending channel. After testing a strong support level, selling pressure has started to ease. That said, the 107.4k zone has yet to be retested, and it is quite likely the price will revisit this level once again.
Technical Outlook
Over the past week, BTC has traded in a highly technical manner – with clear ranges, precise reversal points, and a sustained channel structure.
Key Support: around 107.4k, coinciding with the Long Entry Zone.
Short-term Resistance: 110k – 111k, an area where price has frequently reacted during recovery moves.
Fundamental Perspective
From a fundamental standpoint, there are currently few factors pointing to a deeper decline in BTC. Furthermore, historical patterns suggest that October is often a month where BTC and the wider crypto market tend to recover. This underpins the likelihood of a strong rebound once support has been fully tested.
Trading Scenarios
Short towards support
Entry: 110.3k
SL: 110.8k
TP: 109k – 107.6k
Long at strong support
Entry: 107.4k
SL: 106.8k
TP:Strong reaction: hold the trade, adjust SL to breakeven, and aim for higher levels in line with the broader uptrend.
Weak reaction: close around 109k for a short-term gain.
Conclusion
Short-term: preference is to look for short opportunities near 110.3k, targeting a move back towards support.
Medium-term: watch for long entries around 107.4k, with the expectation that BTC could resume an upward phase into October.
Risk Management
Adhering to stop-losses is essential, particularly for longs at support, as this is the pivotal level that may determine BTC’s next direction.
This represents my personal outlook on BTC heading into the weekend. Please take it as a reference and adapt it to your own strategy.
👉 Follow me to share scenarios and receive the quickest updates when price structure shifts.

BTC Strong resistance around 110k! only one direction -> downBTC is having a tough time crossing 110k due to strong resistance. It's now under SMA9/50 and there's a lot of room for it to continue dropping. With the gov shutdown looming next week, it could be a good recipe for BTC to continue dropping. Proceed with caution!

BITCOIN SIGNAL: PROBABILITIES SHOWING THIS NOW!! (careful) Yello Paradisers! Enjoy the video!
And Paradisers! Keep in mind to trade only with a proper professional trading strategy. Wait for confirmations. Play with tactics. This is the only way you can be long-term profitable.
Remember, don’t trade without confirmations. Wait for them before creating a trade. Be disciplined, patient, and emotionally controlled. Only trade the highest probability setups with the greatest risk to reward ratio. This will ensure that you become a long-term profitable professional trader.
Don't be a gambler. Don't try to get rich quick. Make sure that your trading is professionally based on proper strategies and trade tactics.

BTC 110K IS A NEW UPTREND FOR LOW TIME FRAME UPDATE 26/09/2025BTC/USDT Update
On the low time frame, BTC is still in a breakdown structure, trading around 109.5K – 109.7K.
However, the market is now approaching a key reversal zone where a new uptrend could start.
Key levels:
110K → first confirmation level. A strong reclaim and close above this would be the first signal for a potential uptrend after more than a day under pressure.
113,296 – 113,892 → main trend resistance zone. Only a breakout and confirmation above this range would flip the structure fully bullish again.
Upside scenario: A move back above 110K confirms low time frame strength, opening the path to test 113K+.
Downside risk: Failure to reclaim 110K keeps BTC under bearish momentum, with risk of continuation toward 108K or lower.
📌 Summary
BTC remains in breakdown mode but is close to reversal territory.
Above 110K → first low time frame uptrend confirmation.
Above 113K+ → stronger trend reversal back into bullish cycle.
Below 110K → downside risk stays active.

BTC 1H: Selling pressure remains dominant.1. Trend Context
The short-term structure remains bearish, with the price trading below the EMA.
After breaking through the 111,200 – 112,000 zone, the market is forming a small correction.
2. Key Levels
Nearest Resistance: 110,700 – 111,800. Important zone to watch during this correction.
Main Support (Demand Zone): 108,000 – 108,500. Next target if the downtrend continues.
3. Scenario
Key Scenario : Currently, an uptrend line has been formed, indicating a slight recovery after the previous sharp decline. Wait for the EMA to move closer to the price and form a momentum accumulation zone, after which a first breakout through the uptrend line will appear.
Alternative scenario : If BTC sustains recovery to 110,700, sell-off at this level could be considered.
Please like and comment to support our traders. Your feedback motivates us to produce more analysis in the future 🙏✨

DeGRAM | BTCUSD will retest the $106900 level📊 Technical Analysis
● BTC/USD rejected dynamic resistance and broke lower within the falling channel, confirming short-term bearish momentum.
● The price targets the 106,900 support zone, with continued pressure from lower highs and strong resistance near 124,000.
💡 Fundamental Analysis
● Bitcoin is weighed down by risk-off sentiment as U.S. yields rise, while weaker liquidity and stronger dollar outlook add to downside pressure.
✨ Summary
BTC/USD remains under dynamic resistance, targeting 106,900 support as bearish momentum dominates. Short-term outlook stays negative unless 114,000 is reclaimed.
-------------------
Share your opinion in the comments and support the idea with a like. Thanks for your support!

BTC Breakdown: Watching 112.6K-113.5K for Rejection Toward 109kHello guys!
Trend Structure:
The price was moving in a clear ascending channel, but recently broke down below the lower boundary with strong bearish momentum. This confirms a structural shift from bullish to bearish sentiment.
Current Price Action:
After the breakdown, BTC attempted a relief rally but is now struggling around the 112,682 – 113,581 resistance zone (marked in blue). This area was previously support inside the channel and is now acting as resistance (role reversal).
Scenarios (Entries):
Rejection at 112,682 zone:
If BTC fails to break above this resistance, sellers could step in and push the price lower. A clean rejection here would open the way toward 109,884 (next major support).
Deeper pullback to 113,581:
If bulls manage to push higher, the 113,581 level becomes the last line of resistance. A rejection here would be a high-probability short entry, also targeting 109,884.
Target Zone:
Both rejection scenarios point to 109,884 as the key downside target. A break below that level would increase bearish momentum toward 108,000 and possibly lower.

BTC where are going from here?See the analysis I have made with BTC still some lows to be had however if we break that high then possible run up to the 120's makes sense
Stay cautious
Kris/Mindbloome Exchange

BTCUSDT H4 OUTLOOK Lets Goo
We Are Considering Buy Btcusdt Setup On Demand Zone
Liquidity Sweep
Demand Zone
High Probability Setup
Good Luck Guys

BITCOIN, BITCOIN DOMINANCE, ETHEREUM ANALYSIS 9-14-25Bitcoin has done a nice pullback from the initial sell off from the all time high and found a good support on the 21 EMA on the weekly chart. From the 21 EMA on the weekly chart it's now at a fib resistance level of 0.5 and could potential push up to the 0.618 fib level( 118k) otherwise my expectation is that the pullback is done and another sell off is likely to send price done to the 200 EMA on the daily chart or potential target of $105,530 in the coming week.
Ethereum is also struggling at the 2021 resistance high and more likely to pullback to the 0.382 level ($3,823) before it's continuation to higher high breakout of the 2021 resistance level.
BTC dominance is still in a strong down trend but quite oversold and likely to bounce up a little to the 58% level before continuation of the down trend. I think BTC. Dominance will ultimately reach a bearish Pennant Target of about 55% before a potential reversal.
Thank you for reviewing my analysis and don't hesitated to share your thoughts in the comments section. cheers and I wish you the best of trades this week.

BTCUSD update May 22nd, 2025I have returned and here is my updated chart. I'm such a perfectionist sometimes when it comes to lines that it takes my hours to get them exactly how I envision. To start off, yes I am bullish on Bitcoin and believe that this cycle hasn't ended yet but I will admit that I think the end of it is closer than the beginning. With that being said, I will not disappear when the bear market starts, I will simply make updates and try to catch the bottom like I did in the past. So far I am going with history and my bottom target is above 66,800 and I expect the floor to fizzle out around 71-73k; if it ends up being higher than that, great! Overall this idea is just an update for my own personal records and my prediction is based on what has happen that last time this pattern was brought to us.
Stay safe out there, happy trading, and as always--Cheers!

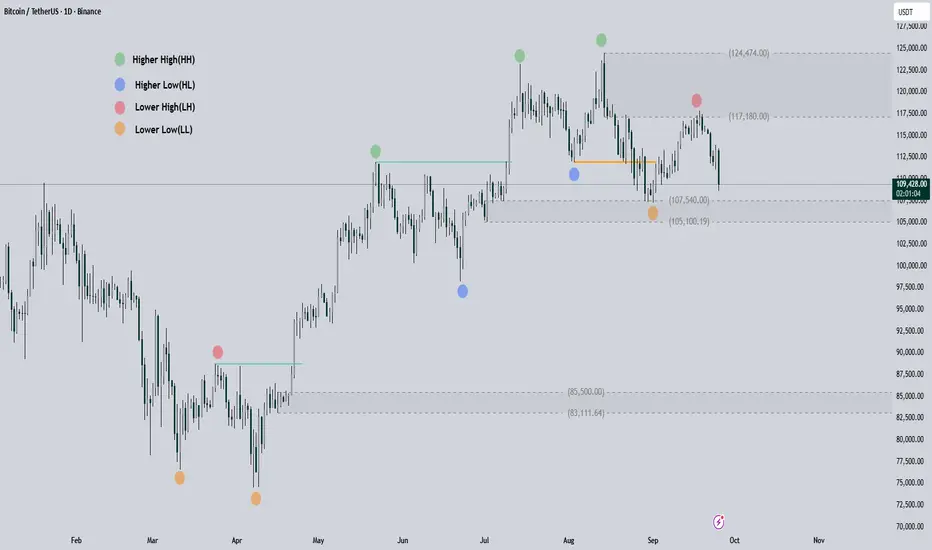
Bitcoin Price Analysis and PredictionIn my opinion, $124k was the highest price BINANCE:BTCUSD would see in this cycle, and the downtrend has started a long time ago.
The colored dots you see on the chart represent the main pivots of the weekly candles that were forming the bullish structure. Now we are seeing this structure being broken one after the other. You can see the key/legend for the colored dots on the chart.
Current Situation
Bitcoin broke the first weekly candle's Higher Low (HL) on August 22nd. Since then, we've seen a Lower Low (LL) and a Lower High (LH) on the weekly chart.
Now, the price is moving back towards that LL to break this LOW and form a new LL.
Last time, we saw good support at $107K and this area could be a support zone this time as well. However, the bearish structure has formed, and we will likely only face temporary reactions. In this area, we will either see the price range or a break of support and the start of a larger trend towards $85k.
Please note that this is just my opinion and it could be completely wrong. Even if it is correct, it might take a long time, or perhaps we'll move towards it with a sharp move!
$BTC More bleeding to come. Will cross SMA200BTC is in a downward channel and is going from SMA50 to SMA200 (down!). We'll see what happens, but Fridays it's typically softer and over the weekend less upside (if there is any at this point). Expect to drop and consolidate around SMA200 low 100k, and could cross 100k very soon. CBOE:MSTZ CBOE:UVIX are nice "insurance" policies right now :)

#BTC/USDT THE ONLY BITCOIN CHART YOU NEED!BTC : Almost There!
BTC is currently following the trajectory shown in my last chart. It took some time, but it’s playing out exactly as expected. Sooner or later, a bounce is coming — there’s no reason to panic unless we break below $103.5K, which is the key support level.
You need to understand that only when money moves out of BTC and big-cap alts will THE MID AND THE SMALL CAPS will have their time to shine. And sooner or later, you'll realise all this happened for good if you played it right. Even if not, many opportunities are coming ahead.
You’ll see this happen soon.
MY MESSAGE TO YOU ALL:
If you've been in crypto for a few years, you know this moment: it’s when the market is on the brink of a big move.
Be patient, it won’t happen overnight, but sooner or later, it will.
If you're currently in the red, take it as a lesson. It happens to the best of us. I've had four positions stopped out, too. It could have been worse if I hadn’t had a STOP LOSS in place.
The silver lining? I can re-enter at a better price.
A lesson I’ve learned over the years: STOP LOSS is a life-saver.
Stay strong and don’t give up right before the big opportunity we’ve all been waiting for.
Opportunities are ahead, manage your risks and remember to take a break, touch some grass. I’m with you.
I'll drop more charts shortly.
Stay strong, folks.
WAGMI!
Do hit the like button, and if you have any doubts, questions, or chart requests, drop them in the comments.
Thank you
#PEACE

Can't say I didn't warn you! BTC and VIXI hate to say it, but it will be worse than I thought! I've been telling folks to watch out as history repeats itself and the market is way too hot esp. in this crappy environment. There is more room to bleed. If you have a position, take the inverse like this second! CBOE:UVIX CBOE:MSTZ $ BTCZ could be nice plays
