Bitcoin BTC price analysis#Bitcoin remains in a compression phase between key structural levels.
A failed attempt to break the descending trendline resulted in a bearish 12H pin bar, increasing the probability of a short-term move toward $84,500.
Key OKX:BTCUSDT levels:
• Resistance: $91,000 → $94,000–95,000
• Support: $84,000–84,500
• Major downside target if support fails: $75,000–77,000
On the monthly timeframe, a sweep into the $75–77K zone in early January aligns with historical market behavior observed in early 2025-type structures.
Bullish continuation requires a clean break and acceptance above $91K, followed by short liquidation fuel above $94K.
Question for traders:
Will CRYPTOCAP:BTC resolve this range to the downside first, or can buyers reclaim control before year-end?
______________
◆ Follow us ❤️ for daily crypto insights & updates!
🚀 Don’t miss out on important market moves
🧠 DYOR | This is not financial advice, just thinking out loud
BTCUSDC

#BTC/USDT is currently strongly bullish#BTC
The price is moving in a descending channel on the 1-hour timeframe. It has reached the lower boundary and is heading towards breaking above it, with a retest of the upper boundary expected.
We have a downtrend on the RSI indicator, which has reached near the lower boundary, and an upward rebound is expected.
There is a key support zone in green at 86900. The price has bounced from this level multiple times and is expected to bounce again.
We have a trend towards stability above the 100-period moving average, as we are moving close to it, which supports the upward movement.
Entry price: 87844
First target: 88166
Second target: 88596
Third target: 89133
Stop loss: Below the support zone in green.
Don't forget a simple thing: capital management.
For inquiries, please leave a comment.
Thank you.

Bitcoin updateYearly chart:
The 2025 yearly chart looks like shit right now. This is the first time in Bitcoin history that the year is closing with a "Shooting Star". Usually, Market Makers try to "save" the year-end. I expect a push to close the yearly candle with a thin body or even close above the Yearly open. 2026 will likely be full of "fuckery" and the start of a bear market, so one last pump makes sense.
Weekly chart: (The 7 week rule)
We’ve been stuck in this $86.3k – $100k range for 7 weeks now. Bitcoin is currently "swimming" at the very bottom of this weekly trading range I follow since Q1 2025. History shows BTC rarely stays in one range for more than 8 weeks. On the 7th week, the direction usually flips. We are at the very edge atm, Eather it holds or it breaks...
The Monday range is officially set. Today is the final day for Market Makers to manipulate price action on the Low Time Frame (LTF) before the year ends.
BTC is currently hovering between key levels. Once it clears the major liquidity pools, we can look for higher-conviction trades.
The Data:
Liquidity Heatmap: The largest liquidity pool has shifted toward ~$86.3k (around the Previous Week Low, as explained yesterday). There’s a high probability we hunt this level first before MMs push the price back up.
OI & CVD: Open Interest (OI) is rising, while CVD and price remain sideways on the 4H. This divergence suggests a major move is brewing. The question is: where will that OI be unleashed?
The Scenario: On the other hand, today could bring a year-end surprise. We might see BTC push higher just to ensure a strong yearly close.
Could we see both today, by a hunt for liquidity followed by a pump? Let’s wait for the market to show its hand before stepping in...

BTC/USDT — Weekly Outlook✔️ Another week closed as a doji — a candle of indecision. The market is thin, with low volume. In this range-bound environment, leveraged traders continue to get liquidated.
🟢 This difficult year is coming to an end. Starting a new chapter is always easier with a clean slate.
🟢 Gold is preparing for a correction — which may redirect liquidity into risk assets.
🟠 Open Interest (OI) has increased — the number of open futures positions is rising.
When OI grows in a low-volume range, it often precedes a strong directional move.
🟠 A strong seller is defending the 90k level. With each retest, that seller appears to weaken.
🟠 Negative cumulative delta (–$1B ): large volume failed to move price meaningfully.
🟠 Market sentiment remains “consistently fearful.”
🔴 Price is still trading inside a bearish pennant.
🧠 The calendar year is ending. Traditional companies and funds are closing books, finalizing reports, paying bonuses, and sending teams on holidays.
Capital is effectively sidelined until 2026 budgets are approved.
Once the holiday slowdown ends and funds return to accounts, a new business cycle begins — and fresh liquidity flows back into markets, including crypto.

$BTCUSDT weekly analysis!BINANCE:BTCUSDT is testing a major confluence support where the rising trendline meets horizontal demand.
This zone has been respected multiple times in the past.
Holding here keeps the macro uptrend intact.
A weekly close below would open room for deeper correction.
Key zone to watch. No panic, no FOMO.

Elite | BTCUSD | Strong Range Accumulation After DistributionBITSTAMP:BTCUSD BINANCE:BTCUSD
After rejecting from the HTF resistance zone, BTC aggressively sold off and is now stabilizing inside a defined parallel range. Price is holding above the lower demand area, suggesting sellers are losing momentum. This structure favors a liquidity grab and expansion move once the range is resolved.
Key Scenarios
✅ Bullish Case 🚀
A sustained hold above 84,800 – 85,300 with bullish 4H structure shift opens upside expansion toward range high and HTF resistance.
🎯 Target 1: 96,800
🎯 Target 2: 104,000 – 106,000
❌ Bearish Case 📉
A 4H close below 84,000 invalidates accumulation and signals continuation toward HTF demand below.
Current Levels to Watch
Resistance 🔴: 96,800 → 104,000
Support 🟢: 85,300 → 84,000
⚠️ Disclaimer: This analysis is for educational purposes only. It is not financial advice.

Bitcoin (BTCUSD) – Demand Zone Rebound Targeting 90,400 ResistanMarket Structure
Short-term structure: Corrective / pullback within a broader bullish trend
BTC previously swept liquidity near the 90,400–90,500 area (marked target point), then rejected sharply.
Current price action shows lower highs, indicating a retracement phase rather than continuation yet.
🟥 Demand / Support Zone (Red Area)
Zone: ~85,400 – 86,450
This is a key demand & liquidity zone:
Prior impulsive bullish departure
Multiple reactions historically
Price recently tapped into this zone and bounced, confirming buyers are active here.
🟩 Upside Target / Supply (Green Area)
Target zone: ~90,400 – 90,500
This is:
Previous high
Strong resistance / liquidity pool
If price breaks structure to the upside, this zone becomes the primary bullish target.
📈 Current Price Behavior
Price is trading around 87,300
Structure shows:
Higher low forming inside demand
Early signs of bullish reversal, but confirmation is still needed
A break above the recent lower high (~88,000–88,200) would strengthen bullish continuation.
🧠 Trade Scenarios
✅ Bullish Scenario (Preferred)
Entry idea: Buy continuation after confirmation above 88,000
Aggressive entry: Deep pullback inside 86,000–85,500
Invalidation: Clean break & close below 85,388
Targets:
TP1: 88,800
TP2: 90,400 – 90,500
⚠️ Bearish Scenario
If price:
Fails to hold 86,000
Shows strong rejection from 88,000
Then price could range or revisit 85,000 liquidity
📌 Summary
Trend: Bullish overall, short-term corrective
Key zone: 85.4k–86.4k demand
Confirmation level: ~88k
Bias: Buy dips, wait for structure break before full conviction
If you want, I can:
Give a short chart title
Mark exact entry / SL / TP
Align this with H1 / H4 / Daily trend

BTC-----Sell around 90300-90000, target 88500-87000 areaYesterday's Market Recap:
Yesterday's intraday analysis clearly indicated that the resistance level was around 90500, which had been touched and subsequently pulled back multiple times. Last night, BTC reached a high of 90574, precisely hitting the resistance level. After selling, the price dropped to a low of 87800 in the early morning, resulting in a conservative profit of approximately 2700 points.
Today's Market Analysis: After yesterday's sharp drop of 2700 points, there was a slight rebound of about 1000 points this morning in Asia. Currently, it is still fluctuating within the 86000-90500 range. The key resistance level to watch is 90500. If a short-term rebound reaches the 90300-90000 range and fails to break through, consider selling. If it breaks through, look for a further sell opportunity around 91000. On the downside, watch the trend support at 86000. If a pullback to the 86000-86300 range holds, consider buying. If it breaks through, look for a further buy opportunity around 84500.
Technical Analysis:
The daily Bollinger Bands are narrowing, and after a series of positive days, a doji candlestick pattern formed at the high, indicating a clear reversal signal. The price tested the 90000 psychological level before encountering resistance and falling back, suggesting a short-term bearish trend.
The middle Bollinger Band and the 30-day moving average (MA30) are forming a confluence of resistance around 89500, with the lower Bollinger Band at 85300 as the target.
On the 12-hour chart, the middle Bollinger Band and the 10-day moving average (MA10) are forming support around 88000. A break below this level could lead to a further decline to 85800.
On the 2-hour chart, after last night's high-level spike, a green 9 signal appeared in the TD indicator, indicating a short-term drop of 2700 points. If the Bollinger Bands continue to widen, there is still room for further decline.
In summary, the intraday strategy is primarily to sell on rallies, with buying on dips as a secondary approach.
Trading Strategy:
1️⃣ Sell in the 90300-90000 range, with a target of 88500-87000 and a stop-loss at 90800.
2️⃣ Buy in the 86000-86300 range, with a target of 87500-89000 and a stop loss at 85500.

BITCOIN SIGNAL: HERE IS WHERE THEY CAN TAKE OVER!!! (Don’t miss)Yello Paradisers! Enjoy the video!
And Paradisers! Keep in mind to trade only with a proper professional trading strategy. Wait for confirmations. Play with tactics. This is the only way you can be long-term profitable.
Remember, don’t trade without confirmations. Wait for them before creating a trade. Be disciplined, patient, and emotionally controlled. Only trade the highest probability setups with the greatest risk to reward ratio. This will ensure that you become a long-term profitable professional trader.
Don't be a gambler. Don't try to get rich quick. Make sure that your trading is professionally based on proper strategies and trade tactics.

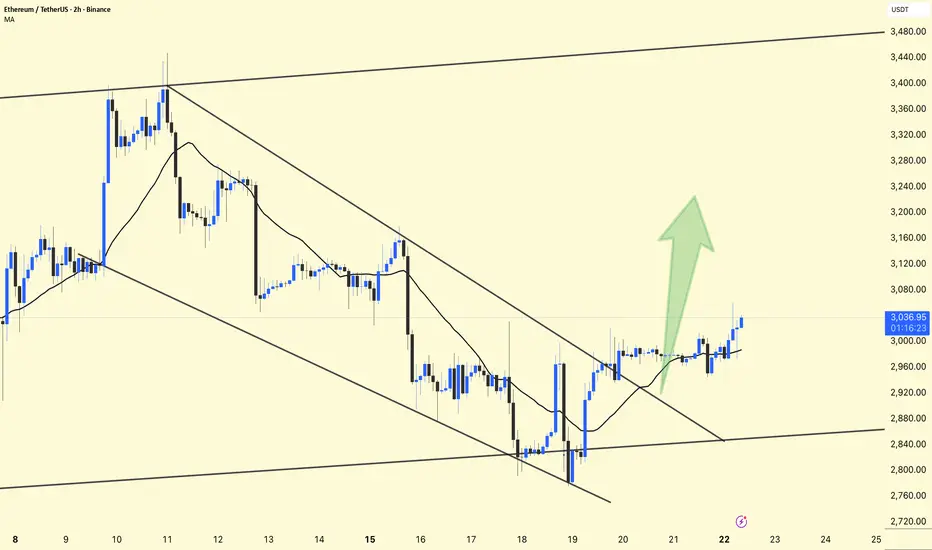
ETHUSDT – Chart Update ETHUSDT – Chart Update
ETH was moving inside a descending channel, now showing signs of reversal.
Price has broken the channel trendline and is holding above the short-term MA.
Momentum is slowly shifting bullish.
Support: 2,980 – 2,950
Major Support: 2,880
Resistance / Targets: 3,120 → 3,200 → 3,280
Bullish above 2,980 with confirmation.
⚠️ A pullback retest is healthy; avoid chasing.
Not financial advice. Trade with risk management.
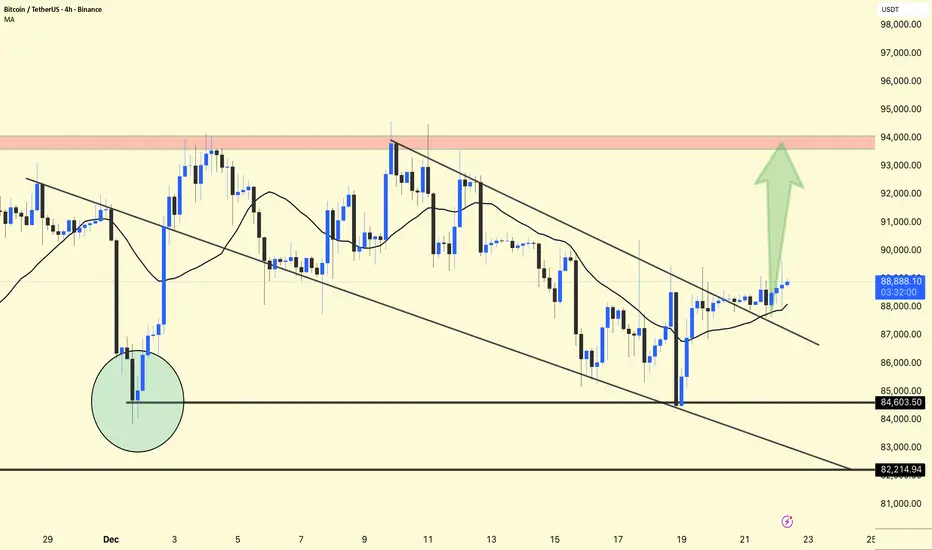
BTCUSDT –Chart Update (4H)BTCUSDT –Chart Update (4H)
Price is still inside a descending channel, but momentum is improving.
BTC is holding above 88,000 and forming higher lows.
A clean break & close above the channel can trigger upside continuation.
Support: 88,000 – 87,500
Major Support: 84,600
Resistance / Target: 93,500 – 94,000 zone
Cautiously bullish above 88K.
⚠️ Wait for confirmation; volatility remains high.
Not financial advice. Manage risk.
BITCOIN SIGNAL: ARE YOU SHORTING NOW LIKE EVERYONE ELSE?? (oops)Yello Paradisers! Enjoy the video!
And Paradisers! Keep in mind to trade only with a proper professional trading strategy. Wait for confirmations. Play with tactics. This is the only way you can be long-term profitable.
Remember, don’t trade without confirmations. Wait for them before creating a trade. Be disciplined, patient, and emotionally controlled. Only trade the highest probability setups with the greatest risk to reward ratio. This will ensure that you become a long-term profitable professional trader.
Don't be a gambler. Don't try to get rich quick. Make sure that your trading is professionally based on proper strategies and trade tactics.

BTC/USD – Potential Downtrend Continuation Toward Key Support"1. Descending Channel (Blue)
Price has been moving inside a downward sloping channel — lower highs and lower lows. This is a bearish pattern until broken convincingly.
Traders watch for price to stay inside or break out — a breakout above suggests potential trend reversal; a break below suggests continuation.
👉 The price recently bounced off the lower boundary, showing support at that channel floor.
---
🔴 2. Moving Average (Red Curve)
A moving average (likely something like a 200-period) is plotted. When price is below the moving average, it typically indicates bearish momentum; price above suggests bullish momentum.
Here we see price approaching that red line from below → this often acts as dynamic resistance for bulls.
---
🔵 3. Key Horizontal Support (Blue Line at ~85,170)
A strong horizontal “target point” / support level is marked.
This line represents a zone where buyers previously stepped in and could again if price falls.
The chart clearly marks this as target on downside if the current setup fails.
Support & resistance levels like this are some of the most watched areas on price charts — they act as floors and ceilings for price action.
---
🎯 The Trade Setup Illustrated
On the right side you see a green/red box which visually represents a trade idea:
🟢 Entry Area
The current price (~88,100–88,800) looks like the potential entry.
The green zone down below is the profit target zone.
🔴 Red Zone
This is the stop-loss area — meaning if price rises above ~90,000–90,400, the bearish setup would be invalidated.
📉 Directional Arrow Down
The big arrow pointing down suggests the analyst expects a move lower, from current levels toward the support around ~85,000+.
So the idea is:
If price fails at the descending resistance and moving average → enter short.
Stop above resistance / above high of red.
Target the lower support area.
This is classic channel-based trading logic: resistance to support → short trade.
---
🔎 Bull vs Bear Scenarios
🔻 Bearish Scenario (favored by this chart)
✔ Price confirms resistance at moving average / upper channel
✔ Breaks back down
✔ Moves toward target zone (~85,000)
This would follow the pattern of lower highs and lower lows.
📈 Bullish Break Scenario
If price breaks above the red moving average and upper trendline convincingly with volume, that would: ✔ Break the downtrend ✔ Signal potential for upside ✔ Invalidate the short setup
Volume confirmation for breakouts is crucial — without it, breakouts often fail.
---
🧠 Summary in Plain Terms
Trend: Currently still bearish inside a descending pattern.
Resistance: Moving average + upper channel line blocking upside.
Support: Strong horizontal area around mid-$80k’s.
Trade idea on chart: Short toward support, stop above recent highs.
Key levels drawn:
🚫 Stop zone: ~90,000+
🎯 Target zone: ~85,000ish

BitcoinBTCUSD
- Completed " 1234 " Impulsive Waves
- Buy Side Liquidity
- Bearish Channel as an corrective pattern in Short Time Frame
- RSI - Divergence
- Order Block

BITCOIN SIGNAL: HERE ARE THE NEXT BTC TARGETS!!!! (trap) Yello Paradisers! Enjoy the video!
And Paradisers! Keep in mind to trade only with a proper professional trading strategy. Wait for confirmations. Play with tactics. This is the only way you can be long-term profitable.
Remember, don’t trade without confirmations. Wait for them before creating a trade. Be disciplined, patient, and emotionally controlled. Only trade the highest probability setups with the greatest risk to reward ratio. This will ensure that you become a long-term profitable professional trader.
Don't be a gambler. Don't try to get rich quick. Make sure that your trading is professionally based on proper strategies and trade tactics.

Bitcoin BTC price analysis📊 US macro data has been updated — and CRYPTOCAP:BTC reacted with a bounce to the upside.
Altcoins, meanwhile, still look confused, as if they don’t know where to run yet 🤷♂️
😨 Fear & Greed Index: 11.
That’s extreme fear — and historically, such levels often mark zones where a gradual recovery can begin. Possibly even starting tomorrow.
📈 Overall, the OKX:BTCUSDT price action in 2025 looks very similar to #Bitcoin ’s behavior in 2021–2022.
We really want to believe we’re already in “Phase 2” of this fractal.
Because if this is still “Phase 1”, history suggests a scenario like:
➡️ first $103,000 BTC,
➡️ then potentially a deeper move toward $53,000.
🤔 What do you think — are we already transitioning into recovery, or is another painful leg still ahead?
______________
◆ Follow us ❤️ for daily crypto insights & updates!
🚀 Don’t miss out on important market moves
🧠 DYOR | This is not financial advice, just thinking out loud

BTC 4H Range Structure With Key Breakout Levels🔥 Welcome To FireHoseReel !
Let’s dive into Bitcoin (BTC) analysis.
👀 BTC 4H Overview
Bitcoin is currently trading inside a 4-hour range, with resistance at $93,663 and support at $84,563. A breakout from this box could trigger a major move. Keep in mind that December holiday conditions, especially Christmas, are keeping overall market volume relatively low.
📊 Volume Analysis
After breaking $88,082, Bitcoin’s volume shifted into strong selling pressure, printing a large 4H sell-off candle. A renewed volume expansion could lead to another significant move and potentially push price out of this range.
✍️ BTC Trading Scenarios
🟢 Long Scenario:
A breakout above $88,082 with rising buy volume could activate a low-risk long setup (~0.25% risk). If buying pressure expands into higher timeframes, the next resistance levels are $89,807, $93,663, and $96,412.
🔴 Short Scenario:
A breakdown below the current support near $84,563, confirmed by increasing sell volume, could provide a solid short opportunity.
🧠 Protect your capital first. No setup is worth blowing your account. If risk isn’t controlled, profit means nothing. Trade with rules, not emotions.
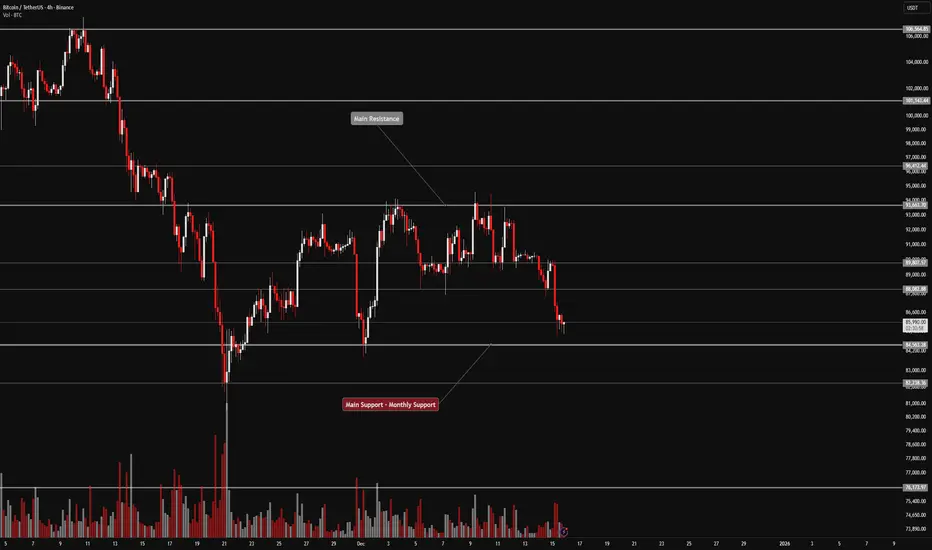
BTCUSD – Range-Bound Distribution | Liquidity-Driven Enviro🔍 Market Structure:-
HTF Range High / Sell-Side Resting Above:
94,500 – 95,200
HTF Range Low / Buy-Side Resting Below:
84,500 – 85,000
Mid-Range (Equilibrium):
~89,500 – 90,000 (current price area)
Price is currently hovering around equilibrium, which is typically low-probability for directional bias.
⚠️ Risk Disclaimer (TradingView-Friendly)
This analysis is for educational purposes only and does not constitute financial advice.
Market behavior is probabilistic and subject to change at any time.
Always apply proper risk management and use your own confirmation before executing trades.

#BTC/USDT is currently strongly bullish#BTC
The price is moving in a descending channel on the 1-hour timeframe. It has reached the lower boundary and is heading towards breaking above it, with a retest of the upper boundary expected.
We have a downtrend on the RSI indicator, which has reached near the lower boundary, and an upward rebound is expected.
There is a key support zone in green at 89300. The price has bounced from this level multiple times and is expected to bounce again.
We have a trend towards consolidation above the 100-period moving average, as we are moving close to it, which supports the upward movement.
Entry price: 90200
First target: 90600
Second target: 91256
Third target: 92000
Don't forget a simple principle: money management.
Place your stop-loss below the support zone in green.
For any questions, please leave a comment.
Thank you.

Breaking: Bitcoin Might Dip to $70k Support Point The price of Bitcoin is poised to dip to the $70k support to shake off weak hands before picking liquidity up albeit the market is generally bearish.
The $70k support is feasible or nearest support zone for bitcoin to consolidate before going back up. In similar context, as per data from crypto quant the open interest of Bitcoin on all exchanges is down 0.45% losing roughly $29 billion.
This data further solidifies our bearish thesis on $BTC.


BTCUSDT (4H) chart update !!BTC is holding above the rising trendline and trying to stabilize.
The 88,000–89,000 zone is acting as strong support, where previous bounces occurred.
As long as this support holds, upside targets remain 94,000 → 98,000 → 102,000.
A 4H close below 89K could open room for a pullback toward 85K–84K.
The overall structure remains bullish consolidation. 🚀
DYOR | NFA

BTC/USDT - The Calm Before the Storm - Breakout or Breakdown?Bitcoin is not simply moving sideways.
Price is currently compressed inside a critical technical structure, where buying and selling pressure is tightening aggressively. Historically, this type of compression often precedes a strong impulsive move.
After the sharp decline from the 126,000 area, BTC has entered a controlled consolidation phase within a falling wedge, while still trading below the major descending trendline. This is a decisive zone where the market chooses between reversal or continuation.
---
Current Market Structure
The higher-timeframe trend remains bearish, but selling pressure is weakening
Higher lows are forming, signaling early buyer participation
Volatility is shrinking → energy is being stored
Price is approaching the apex of the pattern, meaning a breakout decision is near
This is the market loading liquidity before the next major move.
---
Bullish Scenario — “Reversal Confirmation Zone”
If BTC:
Breaks and closes strongly above the descending trendline
Holds above 94,300
Shows expanding volume
Then:
The corrective phase is likely complete
Bearish structure starts to fail
A medium-term bullish reversal becomes highly probable
Upside targets:
99,000 → 103,000 → 107,000
A clean breakout could shift market sentiment from fear to confidence.
---
Bearish Scenario — “Continuation Trap”
If BTC:
Gets rejected again at the trendline
Loses the 90,300 support
Breaks down below the wedge structure
Then:
The consolidation becomes a bearish continuation pattern
Late buyers get trapped
The dominant downtrend resumes
Downside targets:
86,000 → 82,200 → potential retest of 80,500
---
Key Levels to Watch
94,300 – 99,000 → Breakout validation or fakeout zone
90,300 → Psychological mid-range support
86,000 – 82,200 → Final defensive demand zone
Price reaction at these levels matters more than any indicator.
---
Bitcoin is trading at a structural decision point.
This is not an area for FOMO — it is an area for confirmation.
➡️ Breakout = follow the trend
➡️ Breakdown = respect risk
Let price action do the talking.
---
#BTC #Bitcoin #BTCUSD #CryptoAnalysis #TechnicalAnalysis #PriceAction #FallingWedge #MarketStructure #CryptoTrading #SmartMoney
