BTCUSD SHORT Jan.1 You try, 2026. jan 1. Short position
Target 1
Target 2
Target 3
check out my profile!
Easy!
BTCUSDC

BTC 1H Analysis | Day 7🥳 Hey everyone! Hope you’re doing great! Welcome to SatoshiFrame channel.
✨ Today we’re diving into the 1-Hour Bitcoin analysis. Stay tuned and follow along!
👀 On the one-hour timeframe of Bitcoin, we can see that after last night’s pump, Bitcoin failed to break through the resistance zone at $113,400 and was rejected downward from this area. It’s currently sitting at its support floor around $107,537, and losing this level could lead to a further decline.
🧮 The RSI oscillator has now formed two important zones — 50 and 38 — and when the fluctuation limit crosses these zones, Bitcoin may start its next move with increased volatility.
🕯 Last night, Bitcoin had good buying volume while approaching its resistance, but the key point was that it was then pushed down sharply by heavy selling pressure, losing even its multi–timeframe support floors. Keep in mind that Bitcoin needs an increase in buying or selling volume to break through these identified levels.
🧠 I’ve explained the upcoming Bitcoin scenarios in the following paragraph.
🟢 Long Position Scenario: A breakout of the nearest resistance zone at $109,383, along with the RSI crossing above the 50 level and buying pressure strong enough to absorb all the sell orders in this area.
🔴 Short Position Scenario: The current level Bitcoin is sitting at is a very critical support. Losing this support at $107,537, combined with the RSI dropping below 38 and increased selling pressure, could trigger a continued downward move, pushing Bitcoin toward its lower support zones.
❤️ Disclaimer : This analysis is purely based on my personal opinion and I only trade if the stated triggers are activated .

btc on buy reverse#BTCUSD we await price to drop below 107851 to buy, which will retrace back 110150.
Buy limit at 107851, target 109533-110150, stop loss 106900.
Below 106800 holds continuation on sell target 103k

BTC 1H Analysis | Day 6🥳 Hey everyone! Hope you’re doing great! Welcome to SatoshiFrame channel.
✨ Today we’re diving into the 1-Hour Bitcoin analysis. Stay tuned and follow along!
👀 After faking the 111377$ resistance area, Bitcoin ran its stop-hunts and then moved toward its supports. In the process, after breaking the 109383$ support, it headed toward its current support in the 107508$ price area.
🔍 The exhaustion of buyers’ strength and the unusual participation of TakerSeller at the 111377$ price caused selling pressure on Bitcoin, making sellers the winners from that area. Bitcoin is now near its support, and the next resistances are at 109383$ and 111377$. With a break of these zones, it can move further upward.
🧮 On the RSI oscillator, we see that after losing the 50 zone, it moved strongly toward the oversell area and stayed there for a very short time—so short that we can call it a fakeout—and it formed a low near the 30 area. Now, losing the 30 zone and entering Oversell can be a confirmation for more selling pressure. The RSI resistance zone is at 50, and once the oscillation range passes above this zone, long-side momentum increases.
🕯 We’re going to check volume to understand better and get more data. After approaching its resistance, Bitcoin was accompanied by a decrease in buy volume, and subsequently sellers took control of the market; with increasing sell volume, Bitcoin’s price moved downward.
🧠 For a Bitcoin position we have 2 scenarios on the table that, if they occur, we can evaluate a position.
🟢 Long scenario: Break of the 109383$ resistance area and the oscillation limit crossing above the RSI 50 zone, together with increasing buy volume, with maker buyers also participating in this scenario for a price jump.
🔴 Short scenario: Break of the current support along with more selling pressure on Bitcoin, losing the 30 oscillation zone and RSI entering the oversell area.
❤️ Disclaimer : This analysis is purely based on my personal opinion and I only trade if the stated triggers are activated .

BTC 4H Analysis | Day 5🥳 Hey everyone! Hope you’re doing great! Welcome to SatoshiFrame channel .
✨ Today we’re diving into the 4-Hour Bitcoin analysis. Stay tuned and follow along!
👀 After breaking out of the descending channel and confirming the long setup I explained in the previous post, Bitcoin moved upward and easily broke through its Maker-buyer zone.
🔍 Over the past two market-holiday days, Bitcoin consolidated in a multi-timeframe accumulation phase with a ceiling at $107,356, which was easily breached. The price then advanced toward its higher-level key resistances. It’s now trading between $110,500 and $113,000 — the $113,000 zone is our long trigger since price has struggled there multiple times before. This makes it a bit risky, but if the upward movement continues, the next resistances could be at $115,800 and $120,836.
🧮 Looking at the RSI oscillator, it has comfortably passed the 50 level on the 4-hour chart and is now heading toward the overbought zone, facing a key resistance at 70. This 70 level overlaps with the 50 zone on the daily timeframe, meaning that if RSI enters overbought on the 4-hour, the daily will just be shifting from a bearish swing phase to a long-position momentum phase — so the 70 zone is crucial.
🕯 If you check the lower-volume section of the chart, you’ll notice something interesting: the breakout above the two-day accumulation range came with a clear rise in buy volume, which helped Bitcoin easily break both the resistance area and the descending trendline (the upper boundary of the previous channel). This suggests Bitcoin may soon take a volume or price correction to gain more strength for another upward move.
⏰ During today’s New York session, we might see some strong moves. Remember last week when U.S. investors were selling off their ETF holdings, and the market was hesitant to buy? That fear caused weak participation. This time, we may have a reason to stay active during New York hours as sentiment shifts.
🧠 Here are the two key scenarios to watch:
🟢 Long Position Scenario
Wait for Bitcoin to react either to the micro-buyer zone or to the $113,000 area. If we see a pullback followed by an indecision candle (confirmation setup) touching the SMA-7, that’s our entry cue — ideally with a tighter stop size.
🔴 Short Position Scenario
Ignore shorts for now. Bitcoin already completed its second downward wave with an imbalanced slope, and over the last two days, seller momentum has weakened. Buyers are now driving price through resistance levels, so shorting here would go against the current flow.
❤️ Disclaimer : This analysis is purely based on my personal opinion and I only trade if the stated triggers are activated .

Breakdown or Bounce Incoming? | BTC 4H Analysis D4🥳 Hey everyone! Hope you’re doing great! Welcome to SatoshiFrame channel .
✨ Today we’re diving into the 1-Day BITCOIN analysis. Stay tuned and follow along!
👀 Yesterday I shared Bitcoin’s daily analysis in the channel, and today we’re going to review the 4-hour timeframe, from its recent all-time high up to the present.
🔍 After setting its ATH, Bitcoin entered a descending channel (driven by profit-taking and reactivated whale activity). Each time price reached the top of this channel, it was rejected and moved toward the midline or bottom. The last touch of the channel’s top led to another drop toward the midline, and price failed to break above the channel. The major buy zone (micro buyer area) at the top of the channel was lost and has now turned into a key static resistance, overlapping with the dynamic channel resistance — creating a crucial pivot zone for Bitcoin’s potential trend reversal. The next key support lies below this zone at $105,634; a confirmed break and close below it could extend the downtrend further.
🧮 The RSI oscillator is currently fluctuating between 30 (support) and 50 (resistance). A breakout beyond either side — as highlighted in the chart — could add significant momentum to Bitcoin’s next move. These RSI levels are default static zones, which makes their reliability stronger.
🕯 After the massive flash crash that shook the crypto market, traders have shown a stronger inclination toward selling, keeping Bitcoin within this descending channel. As seen in the volume data, the flash crash was accompanied by extreme selling pressure, and whales broke the micro buyer zone with a large “whale candle.” Continued selling pressure could push Bitcoin toward lower supports, while renewed buying volume and whale re-entry could drive it back toward the channel top to test that resistance once more.
🧠 For those without open positions, here are two key scenarios to consider:
🟢 Long Setup: A breakout above the key static + dynamic resistance zone at $109,222, along with increasing buy volume and RSI crossing above 50, could be a solid long opportunity.
🔴 Short Setup: A confirmed breakdown below the nearest support at $105,634, accompanied by strong selling pressure and RSI falling below 30 into oversold territory, could present a strong short setup.
❤️ Disclaimer : This analysis is purely based on my personal opinion and I only trade if the stated triggers are activated .

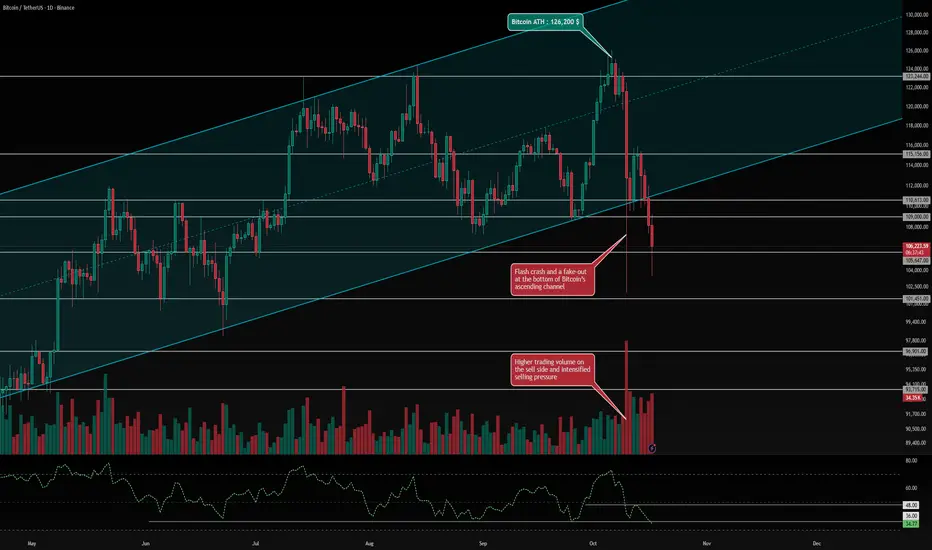
BITCOIN From ATH to Breakdown | BTC 1D Analysis D3😎 Hey everyone! Hope you’re doing great! Welcome to SatoshiFrame channel .
👍 Today we’re diving into the 1-Day BITCOIN analysis. Stay tuned and follow along!
👀 Bitcoin has been trading within a strong ascending channel, recently hitting the upper boundary and setting a new all-time high (ATH) at $126,200. However, this was immediately followed by a flash crash that wiped out roughly $20 billion in futures positions. During the crash, the lower boundary of the ascending channel was also fake-broken, after which buyers temporarily pushed the price back inside the channel. Yet, due to extreme market fear and uncertainty, Bitcoin lost its key support zone at $110,613, continuing the downtrend that began with the flash crash. With yesterday’s daily candle close, Bitcoin officially broke down from its ascending channel, and price action is now heading toward lower support levels. The nearest support lies around $105,647, and if this zone fails to hold, Bitcoin could extend its decline toward the next support at $101,451.
🔍 Bitcoin currently faces two major resistance zones at $109,000 and $110,613. A confirmed breakout above these could signal the start of a reversal, but the main long trigger is located at $115,156. If Bitcoin breaks and holds above this zone with strong buying volume, it could mark the beginning of a powerful bullish leg, potentially leading to a new ATH.
🧮 The RSI oscillator is now sitting near its support region around 36. A daily close below this level would strengthen bearish momentum and could push RSI into oversold territory. The midline resistance sits near 48, and a breakout above this would indicate a possible trend reversal toward renewed bullish momentum.
🕯 Recent candlestick volume shows extremely high selling pressure, marking one of the most intense liquidation waves in recent crypto history. The number of red candles has surged in recent days, suggesting a continuation sell-off pattern, with traders increasingly favoring short positions. The market is currently in extreme fear, and for any bullish reversal to occur, Bitcoin would need massive buy-side volume and strong support to push prices back up. Without that, more long-term holders may start selling as well.
🧠 Current Scenarios (Daily Timeframe) — Patience is key. If you haven’t already entered a short based on previous analyses, consider these setups:
🟢 Long Scenario: Enter on a confirmed breakout and consolidation above $115,156, accompanied by a spike in buying volume and an RSI move above 48.
🔴 Short Scenario: Enter on a confirmed breakdown and close below $105,647, which could trigger a deeper correction toward lower levels. This move would likely coincide with continued selling pressure and RSI dropping below 36 into the oversold zone.
❤️ Disclaimer : This analysis is purely based on my personal opinion and I only trade if the stated triggers are activated .
#BTC/USDT Bullish Momentum: Will It Break Through Resistance?
#BTC
The price is moving in a descending channel on the 1-hour frame and is expected to break and continue upward.
We have a trend to stabilize above the 100 moving average once again.
We have a downtrend on the RSI indicator that supports the upward move with a breakout.
We have a major support area in green that pushed the price higher at 109860.
Entry price: 112045.
First target: 113534.
Second target: 115471.
Third target: 117400.
To manage risk, don't forget stop loss and capital management.
When you reach the first target, save some profits and then change your stop order to an entry order.
For inquiries, please comment.
Thank you.

BTC Trade Idea: Will Support Hold or Is a Reversal Coming? Bitcoin has broken structure to the upside and is showing early bullish signs 🟢. I’m watching closely for a long opportunity if price holds above the current support level and we see a confirmed break of structure from the current low.
However ⚠️ — if this level fails to hold and price breaks below the previous low, we could shift bias and look for a short opportunity 🔻.
📊 Not financial advice — for educational purposes only.

BITCOIN SIGNAL: ROUND 2 OF CRASH INCOMING!!!? (watch out) Yello Paradisers! Enjoy the video!
And Paradisers! Keep in mind to trade only with a proper professional trading strategy. Wait for confirmations. Play with tactics. This is the only way you can be long-term profitable.
Remember, don’t trade without confirmations. Wait for them before creating a trade. Be disciplined, patient, and emotionally controlled. Only trade the highest probability setups with the greatest risk to reward ratio. This will ensure that you become a long-term profitable professional trader.
Don't be a gambler. Don't try to get rich quick. Make sure that your trading is professionally based on proper strategies and trade tactics.

Bitcoin BTC price analysis after crash📈 OKX:BTCUSDT held above the key psychological level of $100,000, remaining within the long-term uptrend 💪
💀 Altcoins suffered heavy losses — liquidity vanished across the board.
This highlights the importance of balance:
🔸 20% in low-cap alts
🔸 80% in resilient assets
💰 The official $19–20B liquidation figure seems understated —
data suggests the cascade started on CEX platforms after algorithmic issues and liquidity gaps.
📊 Fear & Greed Index: 38 — still fear, volatility ahead ⚠️
🇺🇸 The U.S. market open could set the tone for the week 🎢
💭 Do you expect CRYPTOCAP:BTC to retest lower levels before the next leg up?
______________
◆ Follow us ❤️ for daily crypto insights & updates!
🚀 Don’t miss out on important market moves
🧠 DYOR | This is not financial advice, just thinking out loud

Bitcoin Another Bounce Coming?Bitcoin is currently retesting its 50-week Simple Moving Average (SMA) — a historically significant support zone that has acted as a launchpad for multiple bullish continuations throughout previous markets.
Each time BTC has interacted with this moving average since mid-2023, it has managed to rebound strongly, confirming it as a key dynamic support level during this bull phase.
🔶If BTC holds above the 50-week SMA, it may indicate another healthy correction within an ongoing uptrend, potentially setting the stage for the next leg higher.
🔶A clean weekly close below the 50 SMA could suggest a trend weakening and open the door for deeper retracements toward the $90K–$95K region.
Cheers
Hexa

BITCOIN !!!Hello friends
Given the good decline we had, a good opportunity was provided to buy at good prices with capital and risk management and in steps and move to the specified goals.
There was good liquidity at the bottom that was collected, now we can expect a good growth.
*Trade safely with us*

BITCOIN SUPPORTHello friends
Well, as you can see, we have entered a correction and I have found important support areas for you, if buyers support the price in these areas, the price can move to the specified targets.
*Trade safely with us*

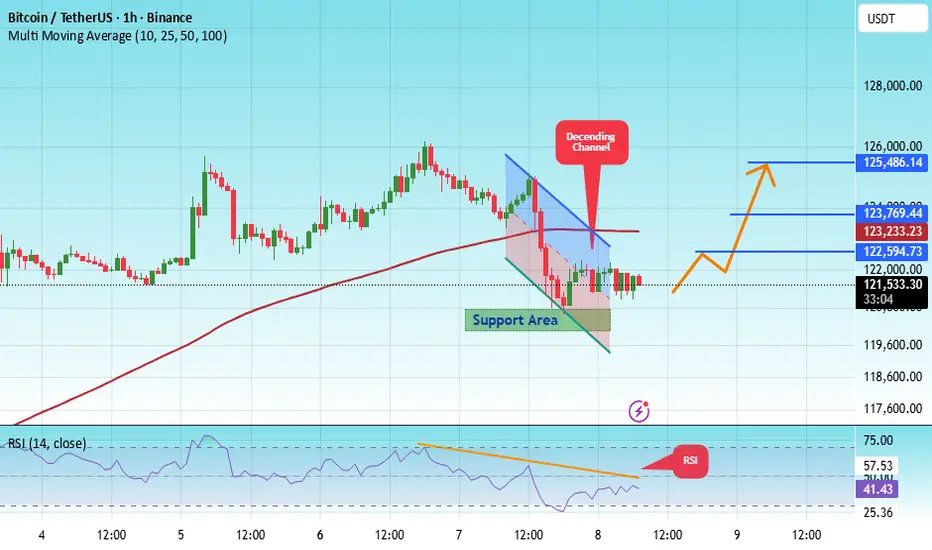
#BTC/USDT bounce from Support, Bullish Momentum Intact#BTC
The price is moving within a descending channel on the 1-hour frame, adhering well to it, and is heading for a strong breakout and retest.
We have a bearish trend on the RSI indicator that is about to be broken and retested, which supports the upward breakout.
There is a major support area in green at 120,500, which represents a strong support point.
We are heading for consolidation above the 100 moving average.
Entry price: 121,666.
First target: 122,600.
Second target: 123,770.
Third target: 125,480.
Don't forget a simple matter: capital management.
When you reach the first target, save some money and then change your stop-loss order to an entry order.
For inquiries, please leave a comment.
Thank you.
#Bitcoin $BTC price hits a new ATH over the weekend!Despite the excitement, there’s no sign of panic liquidations — around $200–400M per day, which is perfectly normal 👌
😬 The Fear & Greed Index now ranges between 71–74 — high, but not extreme.
Altcoins still look hesitant, which keeps both BTC.D and USDT.D in focus.
This setup closely resembles late April and June 2025, when both indexes started dropping — giving alts room to rally 🚀
📊 Order book ( OKX:BTCUSDT ) shows mixed sentiment:
Light resistance at $126K–130K
Strong bids near $118K
That suggests a sharp correction isn’t part of the plan — yet 👀
P.S:
This chart hasn’t been redrawn in years — it’s our “purity benchmark,” clearly showing the uptrend since late 2022 📆
🤔 What’s your take — will alts finally wake up, or will CRYPTOCAP:BTC keep stealing the show?
______________
◆ Follow us ❤️ for daily crypto insights & updates!
🚀 Don’t miss out on important market moves
🧠 DYOR | This is not financial advice, just thinking out loud

#BTC/USDT Analysis — Pullback Before Bullish Continuation#BTC
The price is moving within a descending channel on the 4-hour frame, adhering well to it, and is heading for a strong breakout and retest.
We have a bearish trend on the RSI indicator that is about to be broken and retested, which supports the upward breakout.
There is a major support area in green at 111600, which represents a strong support point.
We are heading for consolidation above the 100 moving average.
Entry price: 111750.
First target: 112684.
Second target: 113672.
Third target: 115048.
Don't forget a simple matter: capital management.
When you reach the first target, save some money and then change your stop-loss order to an entry order.
For inquiries, please leave a comment.
Thank you.

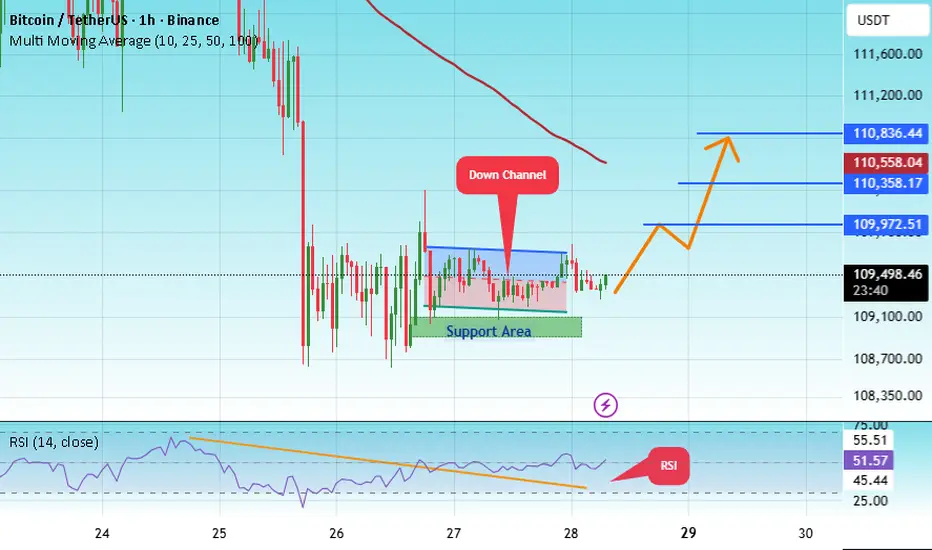
#BTC/USDT Analysis: Key Level to Watch#BTC
The price is moving within a descending channel on the 1-hour frame, adhering well to it, and is heading for a strong breakout and retest.
We have a bearish trend on the RSI indicator that is about to be broken and retested, which supports the upward breakout.
There is a major support area in green at 109100, representing a strong support point.
We are heading for consolidation above the 100 moving average.
Entry price: 109470.
First target: 109900.
Second target: 110360.
Third target: 110836.
Don't forget a simple matter: capital management.
When you reach the first target, save some money and then change your stop-loss order to an entry order.
For inquiries, please leave a comment.
Thank you.
BTC/USDT — Bull Flag Formation: Continuation Rally or Breakdown?📝 Full Analysis
Bitcoin is currently forming a classic Bull Flag pattern. This setup appears after a strong impulsive rally (flagpole), followed by a corrective consolidation within a descending channel (the flag). Technically, a bull flag often indicates a bullish continuation, suggesting the market is taking a breather before resuming its upward trend.
🔍 Bull Flag Characteristics on the Chart
Flagpole: The sharp rally that pushed BTC up to 124,474.
Flag: A descending parallel channel where price consolidates with lower volatility and reduced volume.
Key Support (~109k): This level acts as the foundation of the flag. As long as BTC holds above it, the bull flag remains valid.
---
📈 Bullish Scenario (Bull Flag Confirmation)
Price holds above 109k and bounces higher.
A valid breakout above the upper flag trendline with a strong 2D candle close and higher volume would confirm the bull flag.
Upside targets:
Immediate Resistance: 117k → 120k.
Retest of Previous High: 124.4k.
Theoretical Bull Flag Target: potentially extending toward 130k+ in the mid-term.
---
📉 Bearish Scenario (Invalidation of Bull Flag)
If BTC fails to sustain above 109k, the bull flag risks invalidation.
A breakdown of this key level could drag price back to 103k, with extended downside risk toward 74.5k if selling pressure intensifies.
In this case, the flag turns into a failed continuation setup, shifting market sentiment bearish.
---
⚖️ Conclusion
The chart currently reflects a textbook Bull Flag: impulsive rally → corrective descending channel.
As long as 109k holds, the bullish continuation bias remains intact.
A breakdown below 109k, however, opens the door to a deeper correction.
---
📌 Trading Outlook (Not Financial Advice)
Bullish Plan: Enter on a confirmed breakout above the flag with strong volume. Targets: 117k → 120k → 124k+.
Bearish Plan: If breakdown occurs below 109k, short-term target ~103k, extended target ~74.5k.
---
#Bitcoin #BTC #BTCUSDT #BullFlag #Crypto #TechnicalAnalysis #ChartPattern #BullishContinuation #Breakout

BTC:ConsolidatingFor BTC, the short-term key support level isstill 111000, which is the starting point of the recent rebound. The strong support range is 105000–109000, while the strong resistance zone above remains at 115000. The overall trend is biased toward oscillating upward: if it breaks through the resistance level, it may accelerate its rise; if it falls below the key support, it may pull back.
At the same time, the approaching options expiration may intensify late-session volatility. It is recommended to gradually reduce leveraged positions after 16:00. Overall, Bitcoin's trend today will feature "oscillating to build a bottom and waiting for a breakthrough"—the competition between bulls and bears at key technical levels will determine the short-term direction. Investors should remain rational: they need to be alert to the potential pressure from the "September effect" while paying attention to the possibility of a rebound from oversold levels, and prioritize risk control when responding to market fluctuations.
Buy 111000 - 115000
TP 112000 - 112500 -113000
Daily-updated accurate signals are at your disposal. If you run into any problems while trading, these signals serve as a reliable reference—don’t hesitate to use them! I truly hope they bring you significant assistance

BTCUSD: hold a bullish viewThe current price is around 112700, up 0.17% from the previous trading day. It has fluctuated within the 111000 - 113300 range in the past 24 hours, showing a narrow - range consolidation trend. However, it has not yet broken below the 111000 support level, so we still hold a bullish view. That said, the market is currently in a phase of game between "institutional accumulation and short - term caution"—do not blindly chase the upside.
Buy 112000 - 112500
TP 113000 - 113500 -114000
Daily-updated accurate signals are at your disposal. If you run into any problems while trading, these signals serve as a reliable reference—don’t hesitate to use them! I truly hope they bring you significant assistance

$BTC Crucial range!BTC attempted to break above the lower resistance zone and the descending channel, but failed to sustain momentum. ⚠️
📉 If rejection continues from this level, we could see a move towards the lower side of the channel, where multiple support zones await around:
$114,700
$112,000
$110,400
This will be a key area to watch for potential bounce setups or further breakdown confirmation.
🔎 Stay cautious — until BTC reclaims and holds above $116,700–117,300, downside pressure remains in control.

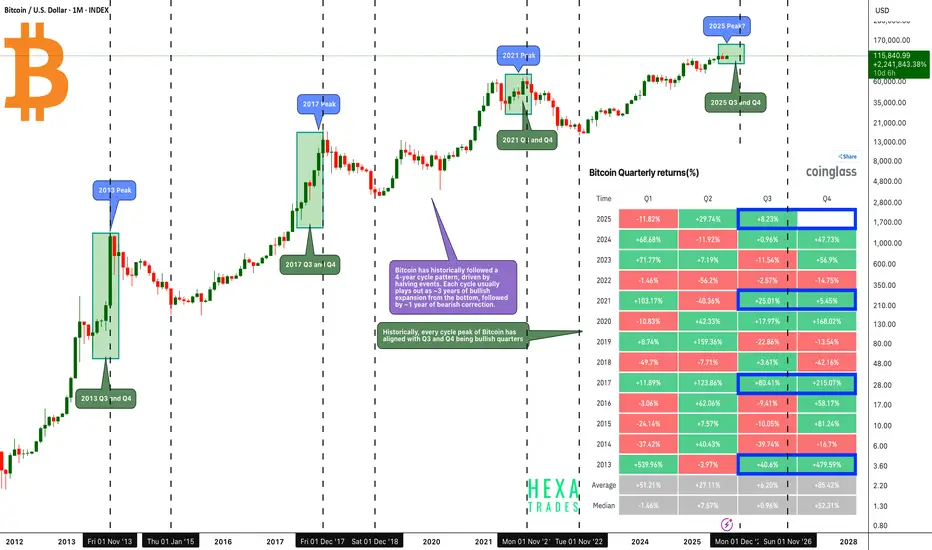
Bitcoin - Final Pump Before the Crash?Bitcoin has historically followed a 4-year cycle pattern, driven by halving events. Each cycle usually plays out as ~3 years of bullish expansion from the bottom, followed by ~1 year of bearish correction.
Historically, every cycle peak of Bitcoin has aligned with Q3 and Q4 being bullish quarters, making the second half of the year the most critical period for cycle tops.
Key Observations from Previous Cycle Peaks:
🔶 2013 Peak:
- Q3: +40.6%
- Q4: +479.59%
Strong acceleration into year-end marked the cycle top.
🔶 2017 Peak:
- Q3: +80.41%
- Q4: +215.07%
A similar explosive move as Bitcoin entered the mania phase.
🔶 2021 Peak:
- Q3: +25.01%
- Q4: +5.45% .
🔶 Current Cycle (2025 Peak?):
- Q3 2025 is already up +8.23% with 15 days remaining until the quarter ends.
- If history repeats, Q4 could be the blow-off phase where Bitcoin accelerates sharply to its peak.
🔶 Potential 2025 Target:
Bitcoin’s Q4 2025 peak could realistically reach the $140K–$160K range before entering the next corrective phase.
Conclusion: If Bitcoin follows its established 4-year cycle structure, we could be entering the final bullish leg of this cycle. History suggests Q3 and Q4 have the highest probability of producing outsized gains, with Q4 especially aligning with cycle peaks.
Cheers
Hexa
BINANCE:BTCUSDT CRYPTOCAP:BTC BITSTAMP:BTCUSD BINANCE:BTCUSDC